- Updates and Announcements
- User Tutorial
- Product Introduction
- Purchase Guide
- Getting Started
- Configuration Guide
- Permission Management
- Use Cases
- Best Practice
- API Documentation
- FAQ
- Troubleshooting Methods
- CDN Service Level Agreement
- Glossary
- Updates and Announcements
- User Tutorial
- Product Introduction
- Purchase Guide
- Getting Started
- Configuration Guide
- Permission Management
- Use Cases
- Best Practice
- API Documentation
- FAQ
- Troubleshooting Methods
- CDN Service Level Agreement
- Glossary
This document describes the new version of the console. It provides more comprehensive and detailed statistics and is used as the basis for billing. We recommend you use the new version.
Metrics Descriptions
Metrics on the overview page
Log in to the CDN Console and select Statistics > Realtime Monitoring on the left sidebar to enter the management page. The Access Monitoring tab is displayed by default. The monitoring curves of all domain names with a 1-minute granularity in the last 6 hours will be returned, including the following metrics:
- Bandwidth: Calculated by dividing the total traffic in one minute by 60 seconds.
- Traffic hit rate: (Total downstream traffic - origin-pull traffic) / total downstream traffic in one minute.
- Percentage of request status code: Percentage chart of status codes (2XX/3XX/4XX/5XX) returned within the selected time period.
- 2XX request status codes: Status codes generated by 2XX status code monitoring will be counted.
- 3XX request status codes: Status codes generated by 3XX status code monitoring will be counted.
- 4XX request status codes: Status codes generated by 4XX status code monitoring will be counted.
- 5XX request status codes: Status codes generated by 5XX status code monitoring will be counted.
Data on the details page
Click View Details under each metric to enter the metric details page.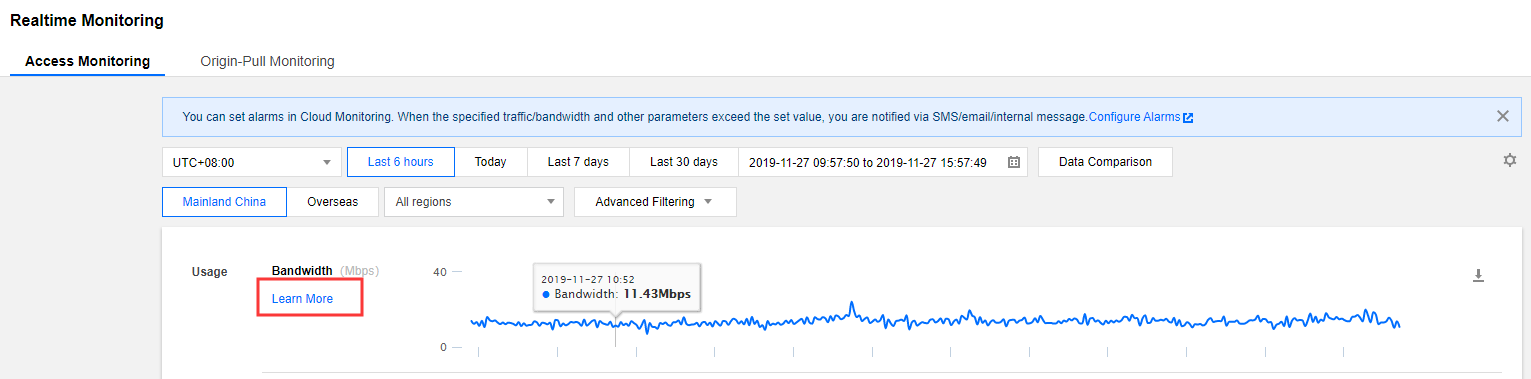
You can also switch to another metric by selecting it from the drop-down list on the top-left corner of the details page.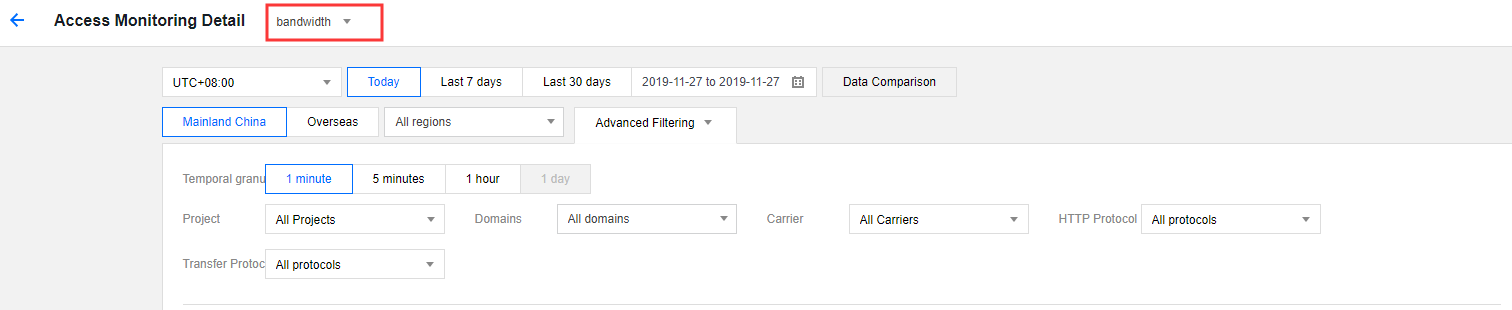
On the details page, you can view the following metric data:
- Bandwidth: Total peak bandwidth, real-time bandwidth curve, and bandwidth rankings of domain names (from large to small).
- Traffic: Total traffic, real-time traffic curve, traffic rankings of domain names (from high to low), and traffic rankings of URLs (from high to low).
- Traffic hit rate: Traffic hit rate, real-time traffic hit rate curve, and traffic hit rate rankings of domain names (from high to low).
- Requests: Total number of requests, curve of real-time request count, request count rankings of domain names (from high to low), and request count rankings of URLs (from high to low)
- Status code percentage: Pie chart of 2XX, 3XX, 4XX, and 5XX status codes and their counts and percentages.
- 2XX status codes: Real-time monitoring curve of 2XX status codes and their sub-status codes and 2XX status code rankings of domain names (from high to low).
- 3XX status codes: Real-time monitoring curve of 3XX status codes and their sub-status codes and 3XX status code rankings of domain names (from high to low).
- 4XX status codes: Real-time monitoring curve of 4XX status codes and their sub-status codes and 4XX status code rankings of domain names (from high to low).
- 5XX status codes: Real-time monitoring curve of 5XX status codes and their sub-status codes and 5XX status code rankings of domain names (from high to low).
Granularity Description
Granularity on the overview page
The monitoring page provides options to display data curves at a 1-minute, 5-minute, 1-hour, or 1-day granularity. The minimum time granularity can be displayed varies by the selected time period.
- Time period ≤ 6 hours: The minimum time granularity is 1 minute. The latency for displaying the 1-minute curve is about 5–10 minutes.
- 6 hours < time period ≤ 24 hours: The minimum time granularity is 5 minutes. The latency for displaying 5-minute curve is about 5–10 minutes.
- 24 hours < time period ≤ 31 days: The minimum time granularity is 1 hour.
- Time period > 31 days: The minimum time granularity is 1 day.
Granularity on the details page
The time granularity options on the metric details page are as follows:
- Time period ≤ 1 day: The minimum time granularity is 1 minute. The latency for displaying the 1-minute curve is about 5–10 minutes.
- 1 day < time period ≤ 31 days: The minimum time granularity can be 5 minutes, 1 hour, or 1 day.
- Time period > 31 days: The minimum time granularity is 1 day.
Note:
- Currently, data query at 1-minute statistics granularity is only supported in mainland China. The minimum granularity for historical data query is 5 minutes.
- The maximum time period for query is 90 days.
Aggregation Description
The method for aggregating 1-minute data into 5-minute, 1-hour, or 1-day data varies by data metric.
- Bandwidth: The smallest granularity provided by CDN for monitoring bandwidth data is 1 minute. Based on industry standard, fees are generally billed by 5-minute granularity, which is calculated by taking the average of 1-minute data values. Therefore, the bandwidth data at a 1-hour or 1-day granularity can be calculated based on the maximum 5-minute bandwidth value.
- Traffic: The traffic data at a 5-minute, 1-hour, or 1-day granularity is obtained by aggregating 1-minute traffic data.
- Traffic hit rate: Based on the selected granularity, the traffic hit rate is calculated by using the formula "(total downstream traffic - origin-pull traffic) / total downstream traffic" rather than taking the average of 1-minute data values.
- Number of requests and status codes: Data at a 5-minute, 1-hour, or 1-day granularity is obtained by aggregating 1-minute data.
Data source description
Billable data and log data
- The data collected based on the downstream bytes in the log of an acceleration domain name is data at the application layer, while traffic generated during actual data transfers over the network is 5–15% more than application-layer data.
- Consumption by TCP/IP headers: In TCP/IP-based HTTP requests, each packet has a maximum size of 1,500 bytes, including TCP and IP headers of 40 bytes, which generate traffic during transfer but cannot be counted by the application layer. The overhead of this part is around 3%.
- TCP retransmission: During normal data transfer over the network, around 3–10% packets are lost on the internet, and the server will re-transmit the lost parts. This traffic cannot be counted by the application layer, which accounts for 3–7% of the total traffic.
- As an industry standard, the billable data is the sum of the application-layer data and the above-mentioned overheads. Tencent Cloud CDN takes 10% as the overheads proportion, so the monitored billable traffic/bandwidth is around 110% of the logged data.
- Except for traffic and bandwidth, all other metrics are collected at the application layer. Due to network fluctuation, statistics displayed on the monitoring page are slightly different from those in the log, as data loss may occur during log pulling from nodes or data reporting by servers.
Data source description
- If statistical district or ISP option is not selected as a filter, all queried data will be billable data.
- If statistical district or ISP option is selected as a filter, the data needs to be matched for calculation by client IP in the access log, and all queried data will be log data.
Filter Description
- Currently, query by both statistical district and ISP is not supported. You can only query all ISPs by district or query all districts by ISP.
- Currently, origin-pull monitoring does not support filtering by statistical area or ISP.
- Currently, origin-pull monitoring does not support filtering by HTTPS/HTTP request.

 Yes
Yes
 No
No
Was this page helpful?