- Updates and Announcements
- User Tutorial
- Product Introduction
- Purchase Guide
- Getting Started
- Configuration Guide
- Permission Management
- Use Cases
- Best Practice
- API Documentation
- FAQ
- Troubleshooting Methods
- CDN Service Level Agreement
- Glossary
- Updates and Announcements
- User Tutorial
- Product Introduction
- Purchase Guide
- Getting Started
- Configuration Guide
- Permission Management
- Use Cases
- Best Practice
- API Documentation
- FAQ
- Troubleshooting Methods
- CDN Service Level Agreement
- Glossary
Note:Origin-pull data query is not available for ECDN domain names now.
Metric Description
Metrics on the overview page
Log in to the CDN Console and select Statistics > Realtime Monitoring on the left sidebar to enter the management page. The Access Monitoring tab is displayed by default. You can click Origin-Pull Monitoring on the right to enter the origin-pull monitoring metrics page. The monitoring curves of all domain names with a 1-minute granularity in the last 6 hours will be returned, including the following metrics:
- Origin-pull bandwidth: Calculated by dividing the total origin-pull traffic in one minute by 60 seconds.
- Origin-pull traffic: Total origin-pull traffic in the cache node at the last layer.
- Origin-pull requests: Total number of origin-pull requests in the cache node at the last layer.
- Origin-pull failure rate: Percentage of failing origin-pull requests out of all origin-pull requests.
- Percentage of origin-pull status code: Percentage charts of status codes (2XX/3XX/4XX/5XX) returned for origin-pull requests within the selected time period.
- 2XX origin-pull status codes: Status codes generated by 2XX origin-pull status code monitoring will be counted.
- 3XX origin-pull status codes: Status codes generated by 3XX origin-pull status code monitoring will be counted.
- 4XX origin-pull status codes: Status codes generated by 4XX origin-pull status code monitoring will be counted.
- 5XX origin-pull status codes: Status codes generated by 5XX origin-pull status code monitoring will be counted.
The following conditions will be counted as failing origin-pull requests:
- Timeout in receiving origin-pull data.
- Timeout in sending origin-pull request.
- Timeout in establishing a TCP connection for origin-pull.
- The origin server actively closes the connection.
- HTTP protocol compatibility error of the origin server.
Data on the details page
Click Learn More under each metric to enter the metric details page.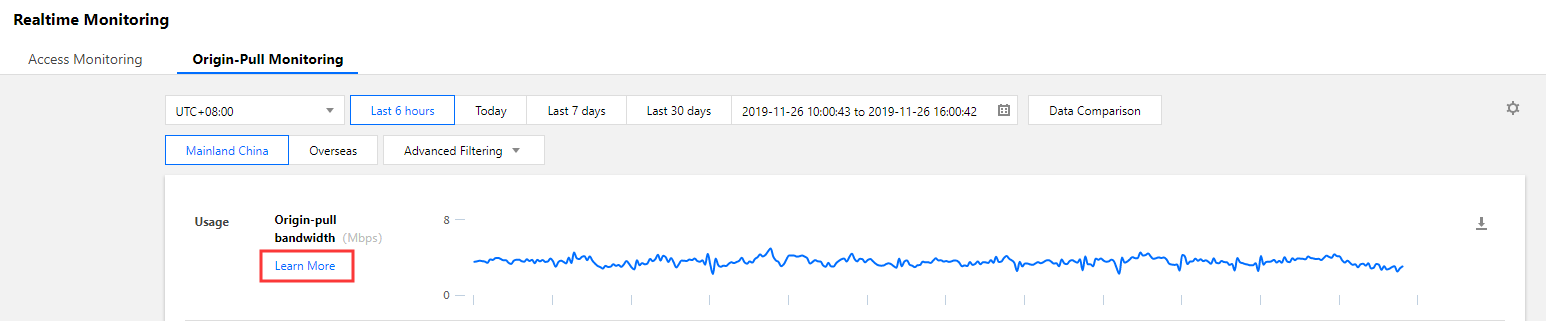
You can also switch to another metric by selecting it from the drop-down list on the top-left corner of the details page.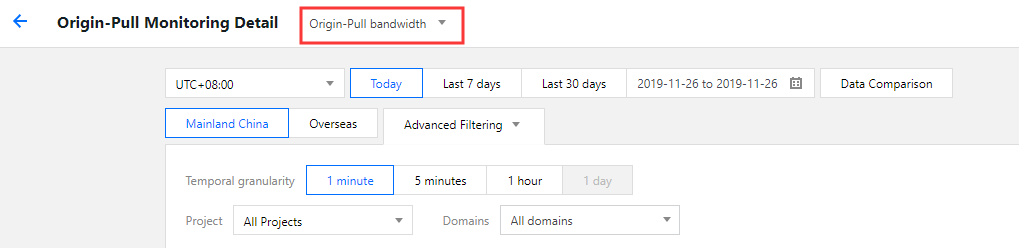
Granularity Description
Granularity on the overview page
The monitoring page provides options to display data curves at a 1-minute, 5-minute, 1-hour, or 1-day granularity. The minimum time granularity can be displayed varies by the selected time period.
- Time period ≤ 6 hours: The minimum time granularity is 1 minute. The latency for displaying the 1-minute curve is about 3 minutes.
- 6 hours < time period ≤ 24 hours: The minimum time granularity is 5 minutes. The latency for displaying the 5-minute curve is about 5–10 minutes.
- 24 hours < time period ≤ 31 days: The minimum time granularity is 1 hour.
- Time period > 31 days: The minimum time granularity is 1 day.
Granularity on the details page
The time granularity options on the metric details page are as follows:
- Time period ≤ 24 hours: The minimum time granularity is 1 minute. The latency for displaying the 1-minute curve is about 3 minutes.
- 24 hours < time period ≤ 31 days: The minimum time granularity can be 5 minutes, 1 hour, or 1 day.
- Time period > 31 days: The minimum time granularity is 1 day.
Note:
- The data collected at a 1-minute granularity can be queried only in the new version of the console. For historical data, the minimum granularity for query is 5 minutes.
- The maximum time period for query is 90 days.
Aggregation Description
The method for aggregating 1-minute data into 5-minute, 1-hour, or 1-day data varies by data metric.
- Origin-pull bandwidth: The smallest granularity provided by CDN for monitoring bandwidth data is 1 minute. Based on industry standard, fees are generally billed by 5-minute granularity, which is calculated by taking the average of 1-minute data values. Therefore, the bandwidth data at a 1-hour or 1-day granularity can be calculated based on the maximum 5-minute bandwidth value.
- Origin-pull traffic: The traffic data at a 5-minute, 1-hour, or 1-day granularity is obtained by aggregating 1-minute traffic data.
- Origin-pull requests: The request count at a 5-minute, 1-hour, or 1-day granularity is obtained by aggregating 1-minute request counts.
- Origin-pull failure rate: Calculated by dividing the total number of origin-pull failures by the total number of origin-pull requests based on the selected time granularity.
- Origin-pull status codes: The status code data at a 5-minute, 1-hour, or 1-day granularity is obtained by aggregating 1-minute status code data.

 Yes
Yes
 No
No
Was this page helpful?