Viewing and Handling
Unduh
Mode fokus
Ukuran font
CSC generates security alarms when it detects asset intrusions, malware, or abnormal behavior. Timely risk assessment and proper response are critical to ensuring business stability and data security. This document describes how to complete the workflow from filtering to analysis to response in the Alarm Center, as well as how to export data and view Task Record.
Recommended Disposal Priority
It is recommended to handle alarms by reducing noise first and then analyzing them by priority to avoid spending excessive effort on low-priority events.
Sequence | Action | Description |
1 | Exclude events that are not of concern. | Ignore alarms that have been confirmed as secure or add them to the allowlist. |
2 | Prioritize critical assets. | Prioritize alarms related to critical accounts and core business hosts, and filter them by asset tags. |
3 | Prioritize by threat level and ATT&CK stage. | Prioritize critical/high-risk alarms. Alarms at later ATT&CK stages are more urgent. |
4 | Assist analysis by detection mode. | Precision: A high-confidence malicious verdict is produced after a match. Balanced: The matched behavior is suspected of being an attack. Depth: Further verification is required based on the context. |
Note:
For concepts such as alarm type, threat level, ATT&CK stage, and detection mode, see Alarm Overview.
Operation Steps
Step 1: Go to Alarm Center
1. Log in to the CSC console.
2. In the left sidebar, select Alarm Center.
3. At the top of the page, you can view the alarm overview, which includes the total number of critical/high-severity pending alarms, the total number of alarms, and the Scan/Protection configuration.

4. The following entries are provided at the top of the page:
Policy management: Configure protection items, rules, and client-related settings. For details, see Protection Configuration, Rule Management, and Client Management.
Task records: View scan records, export records, and more.
Scan/protection configuration: View the status of the protection engine, virus database/vulnerability database update time, collection enhancement, security hardening, and detection switch, and provides quick management entries.
5. At the bottom of the page, you can view the detailed alarm list.
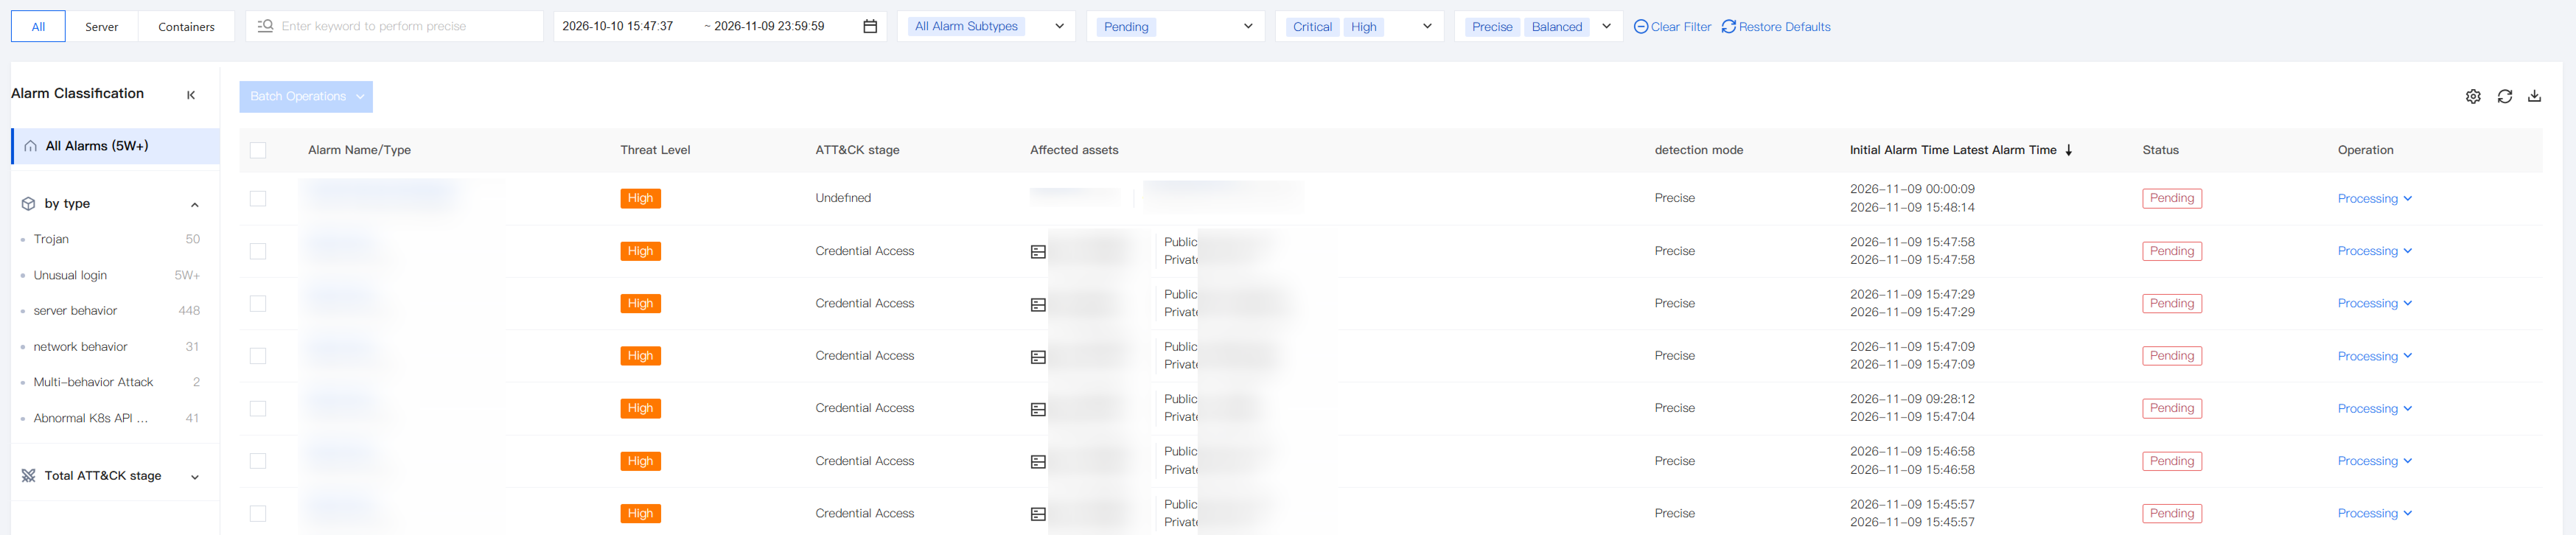
Field description:
Alarm name/type: File scan and kill - malicious file, File scan and kill - malicious process, abnormal login, password cracking, malicious request, high-risk command, local privilege escalation, reverse shell, network attack, vulnerability defense, memory shell injection, memory shell scan, and multi-behavior attack.
Threat level: Critical, High, Medium, Low, and Informational.
ATT&CK stage: The ATT&CK stage in which the behavior is involved.
Affected assets: Identifiers of affected hosts or containers, IP addresses, and other related information.
Detection mode: Precise, Balanced, and Depth.
Associated account: The account currently anchored in a multi-account scenario.
Initial Alarm Time,Latest Alarm Time: The first and last time this alarm was detected.
Status: The current processing status.
Operation: Processing (supports expanding optional operations).
Step 2: Filter Alarms
You can filter alarms above the alarm list by combining asset scope and conditions, and quickly filter them on the left by detection type and ATT&CK phase.
1. Switch asset scope: All / Server / Containers.
2. Set filter conditions as needed and then view the list.
Keyword search: You can perform fuzzy queries by alarm ID, asset name, instance ID, or IP address.
Time range: Today, Yesterday, Last 7 days, Last 30 days, or a custom start and end time.
Alarm subtype: File scan and kill - malicious file, File scan and kill - malicious process, abnormal login, password cracking, malicious request, high-risk command, local privilege escalation, reverse shell, network attack, vulnerability defense, memory shell injection, memory shell scan, and multi-behavior attack.
Status: Pending, Handled, Blocked, Allowlisted, Isolated, Cleaned up, Ignored, Permanently ignored, Isolating, Recovering, Terminating, Terminated.
Threat level: Critical, High, Medium, Low, and Informational.
Detection mode: Precise, Balanced, and Depth (corresponding to the rule modes configured in the AI-Link engine).
Note:
By default, the list filters all alarm types, pending alarms, critical + high-severity alarms, precise + balanced modes, and the last 30 days (adjustable as needed).
Step 3: View Alarm Details and Analyze
The alarm details page helps you determine whether an alarm is genuine and assess its severity.
1. Use keyword search to quickly locate the alarm by its ID in the notification, and then click the target alarm name in the list to open the alarm details.
2. The system performs analysis in the following three stages, from basic to in-depth, and then proceeds to handling after the analysis is complete.
Use the summary at the top of the details page to quickly determine the threat level, impact scope, and urgency.
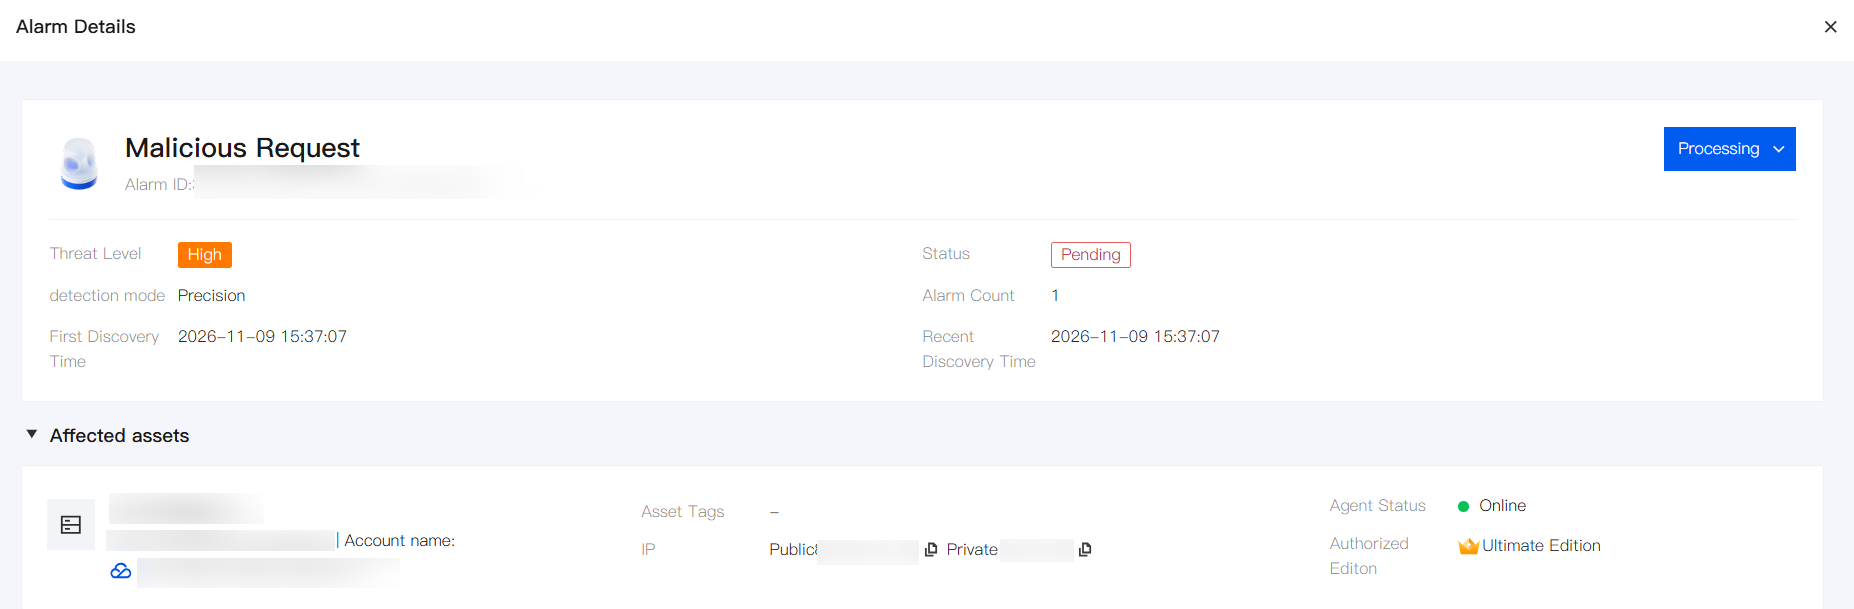
Field description:
Alarm name: The name of the alarm type.
Alarm ID: The unique identifier of the alarm, which can be used for search and location.
Threat level/Attack status: Critical, High, Medium, Low, and Informational. For network attack events, the attack status (such as attempted attack) may also be displayed.
Processing status: The current processing status of the alarm.
Detection mode: Precise/Balanced/Depth, which helps determine the confidence level.
Number of alarms: The total number of hits displayed in a consolidated manner.
First/Recent Discovery Time: The first and last time the alarm was detected.
First detection method: Scanning or real-time monitoring.
Affected assets:
Host: Occurs at the host process layer (most common).
Inside a container: Occurs within a container process (such as an abnormal process inside the container).
Container process/Container orchestration: Occurs at the container orchestration layer (such as K8s nodes).
Note:
In the Affected assets area, container alarms typically display information such as container name, running status, image, Pod, and cluster.
ATT&CK stage: A later stage usually indicates higher urgency.
Note:
Key points for initial analysis:
Immediate handling: Critical/High + later stages such as data theft or impact and damage
Attention but not urgent: Medium/Low + early stages (reconnaissance, initial access)
If the summary information is insufficient for assessment, continue to view basic information, intelligence analysis, and alarm sources.
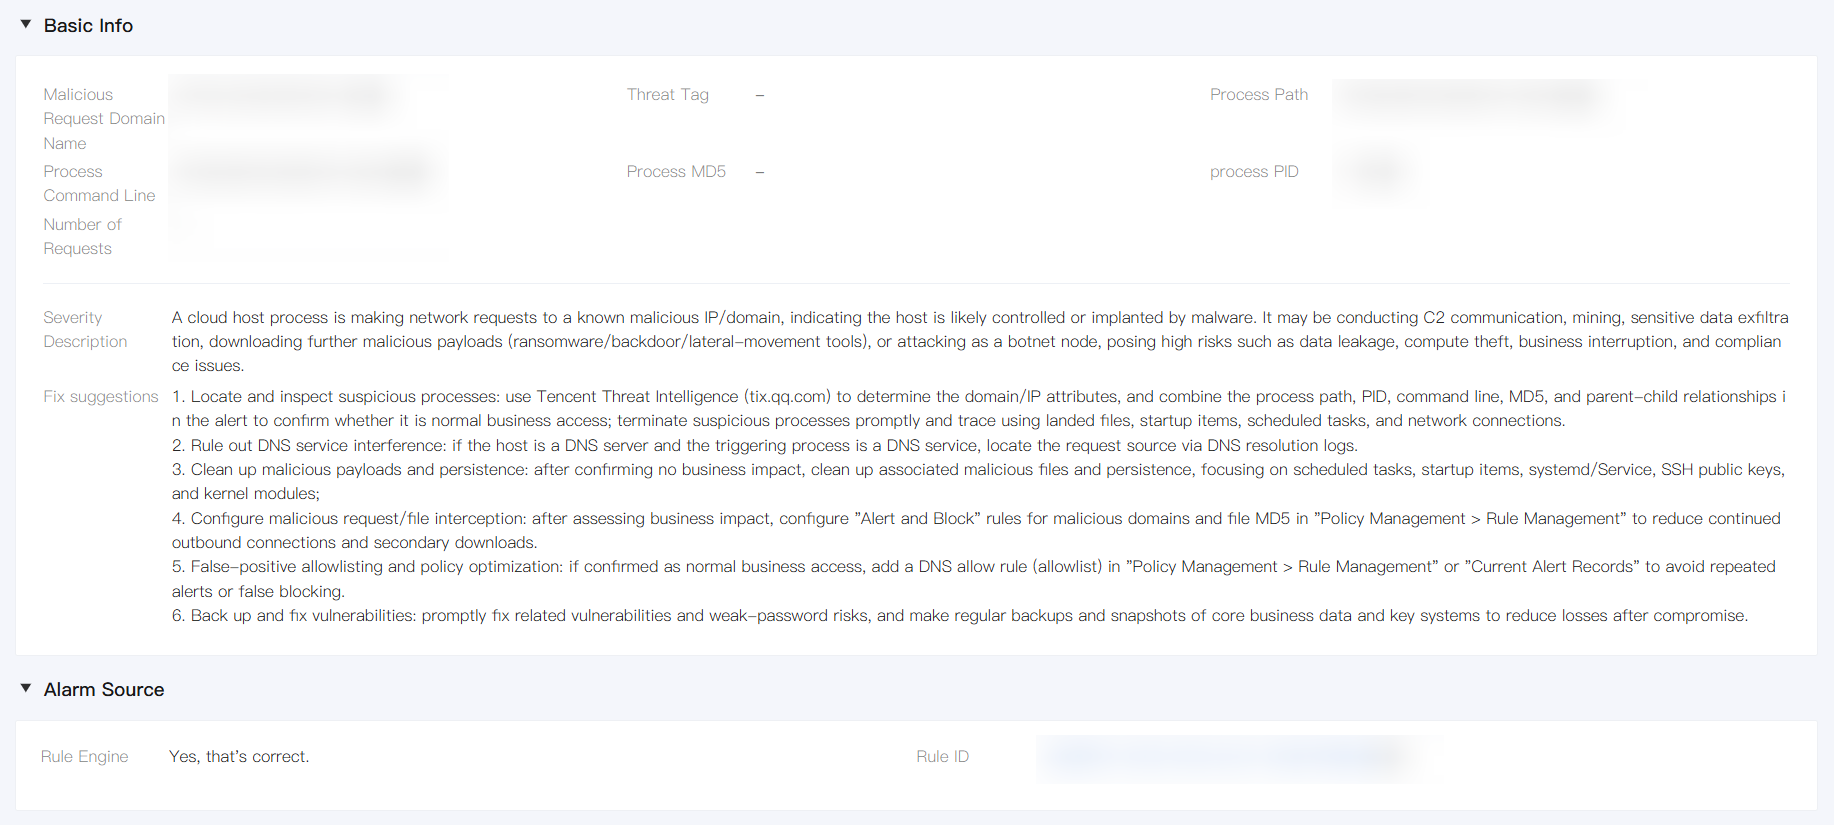
For complex attacks or scenarios requiring forensics, use the deep investigation capability: Event Investigation and Tracing (Ultimate Edition).
Event investigation and tracing: Restore the attack timeline and the complete cross-stage attack chain on a single host.
Step 4: Processing Alarms
The available handling actions vary with the alarm subtype and the current handling status.
Single Alert Processing
1. Click Processing in the operation column of the list or on the details page.
2. Select a handling action and confirm as prompted.
3. Wait for the execution to complete, and the status will be updated to the corresponding result (such as Isolated, Handled, or Allowlisted).
4. The general handling actions are described as follows:
Mark as handled: Manually handle the alarm risk, and you can mark the alarm as handled.
Add to allowlist: Subsequent matches of the same type will no longer trigger alarms, which is suitable for long-term normal business.
Ignore: Only ignore the selected alarms. If the same alarm occurs again, an alarm will still be triggered.
Delete records: Delete the selected alarm records. The console will no longer display them, and the records cannot be recovered. Proceed with caution.
Alarm Subtype | Supported Disposal Actions |
File Scan and Kill - Malicious File | Isolate, isolate and clear related processes (recommended), mark as handled, add to allowlist, ignore, delete record, restore from isolation. Note: Isolate: Back up the threat file to a secure quarantine area, encrypt it, and then delete the original file. The file is usually no longer visible locally on the asset. Isolate and remove related processes: Isolate the file and stop the related processes (recommended). Restore from isolation: Available only in the isolated state. It is used to restore business files after an incorrect isolation. |
File Scan and Kill - Malicious Process | Terminate process, mark as handled, add to allowlist, ignore, delete record. Note: Terminate processes: End malicious or abnormal processes. |
Unusual Login | Mark as handled, add to allowlist, ignore, delete record. |
Password Cracking | Mark as handled, add to allowlist, virus scan, ignore, delete record. Note: Virus scan: Provides a quick entry to scan the assets impacted by the current alarm for viruses and Trojans. |
Malicious Request | Mark as handled, add to allowlist, add to blocklist, ignore, delete record. Note: Add to blocklist: Change the corresponding rule action from alarm to alert and intercept. The same applies when high-risk commands are added to the blocklist. |
High-Risk Command | Mark as handled, add to allowlist, add to blocklist, ignore, delete record. |
Local Privilege Escalation | Mark as handled, add to allowlist, ignore, delete record. |
Reverse shell | Mark as handled, add to allowlist, ignore, delete record. |
Network Attack | Mark as handled, enable application protection, add to allowlist, ignore, delete record. Note: Enable application protection: Guides you to enable the application protection capability. The same applies to vulnerability defense and memory trojan injection. |
Vulnerability Defense | Mark as handled, enable application protection, add to allowlist, ignore, delete record. |
Memory Shell Injection | Mark as handled, enable application protection, add to allowlist, ignore, delete record. |
Memory Shell Scan | Mark as handled, add to allowlist, ignore, delete record. |
Multi-behavior Attack | Mark as handled, ignore, ignore permanently, delete record. Note: Permanent ignore: Dedicated to multi-behavior attacks. It persistently ignores by asset instance ID + rule ID and supports canceling the ignore. |
Note:
Ignore is not equivalent to adding to the allowlist: Ignore applies only to the current alarm record. If the same alarm occurs again after being ignored, an alarm will still be triggered. Adding to the allowlist suppresses subsequent alarms of the same type. For long-term normal business operations, adding to the allowlist is recommended.
Blocked events are mostly the result of protection policies or the blocklist taking effect. You can configure blocking in advance in Protection Configuration/Rule Management.
Notifications are generally for pending alarms. When the same alarm transitions between different states, no duplicate notification is sent.
Batch Handling
1. Select one or more alarms, and then click Batch Operations.
2. Select the batch action and confirm (mark as processed, ignore, or delete records).
3. Wait for the execution to complete. The status will be updated to the corresponding result (such as Handled or Ignored), or the related alarm list records will be deleted.
Step 5: Export Data and View Task Record
Exporting Alarm Data
1. Filter the target data in the alarm list as needed, and click the Export icon.

2. After the export is complete, download the file in Alarm Center > Task Record > Export Records.

Note:
Export history and download links are typically retained for about 7 days. After expiration, you need to export them again.
Viewing Scan Record
Results of scheduled scans and manual scans can be checked in task records, making it easier to compare alarms of the "first detection method: scanning" type.
1. In Alarm Center > Task Records, choose the Scan Records tab to view the history of scheduled or one-time scans.
2. In the scan record list, you can rescan or delete target records.
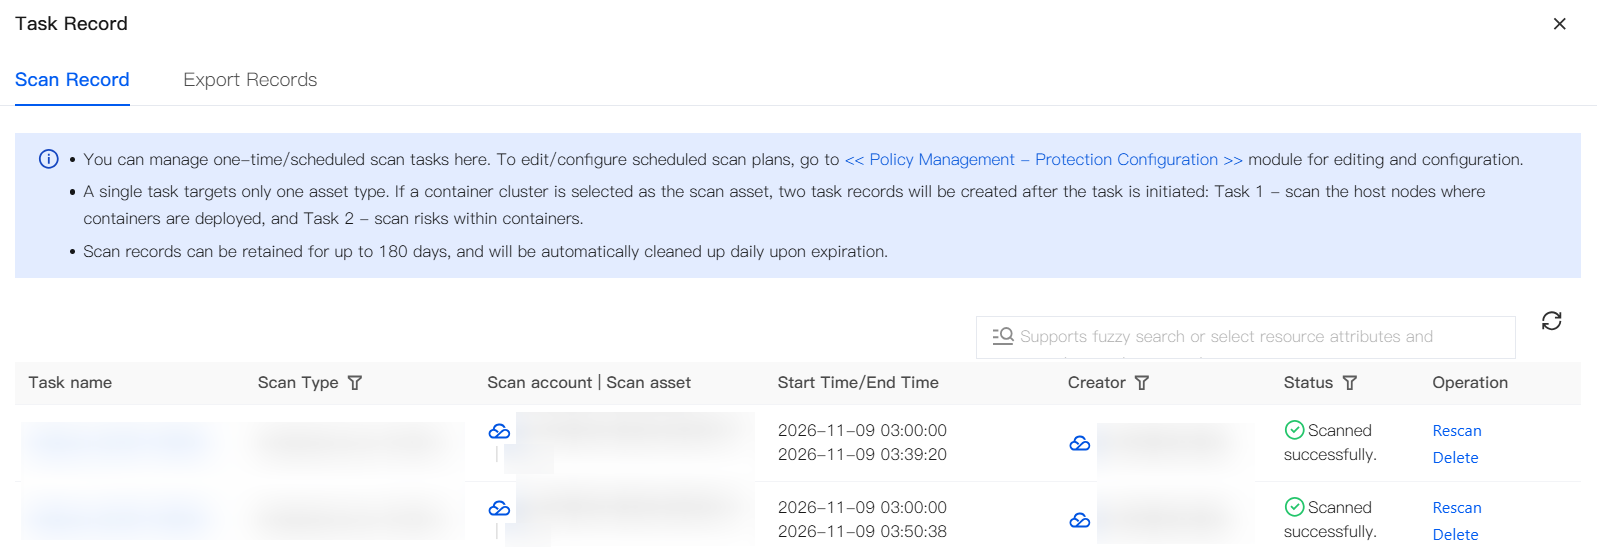
Note:
You can manage one-time or scheduled scan tasks. If you need to edit or configure a scheduled scan plan, go to Alarm Center > Policy management > Protection Configuration to make changes.
A single task targets only one asset type. If a container cluster is selected as the scan asset, two task records will be saved after the task is initiated: Task 1 - scanning host nodes where containers are deployed, and Task 2 - scanning risks within containers.
Scan records can be retained for up to 180 days. After expiration, historical records are automatically cleaned up on a daily basis.
Bantuan dan Dukungan
Apakah halaman ini membantu?
Anda juga dapat Menghubungi Penjualan atau Mengirimkan Tiket untuk meminta bantuan.
masukan