- Release Notes and Announcements
- Product Introduction
- Purchase Guide
- Getting Started
- EMR on CVM Operation Guide
- Planning Cluster
- Configuring Cluster
- Managing Cluster
- Instance Information
- Node Specification Management
- Checking and Updating Public IP
- Cluster Scale-Out
- Cluster Scale-in
- Auto Scaling
- Repairing Disks
- Graceful Scale-In
- Disk Update Check
- Scaling up Cloud Disks
- Changing Configurations
- Automatic Replacement
- Exporting Software Configuration
- Cluster Scripts
- Cluster Termination
- Operation Logs
- Task Center
- Managing Service
- Managing Users
- Adding Components
- Restarting Service
- Starting/Stopping Services
- WebUI Access
- Resetting WebUI Password
- Software WebUI Entry
- Operation Guide for Access to WebUI over Private Network
- Role Management
- Client Management
- Configuration Management
- YARN Resource Scheduling
- HBase RIT Fixing
- Component Port Information
- Service Operation
- HBase Table-Level Monitoring
- Component Health Status
- Monitoring and Alarms
- Cluster Overview
- Node Status
- Service Status
- Cluster Event
- Log
- Application Analysis
- Cluster Inspection
- Monitoring Metrics
- Node Monitoring Metrics
- HDFS Monitoring Metrics
- YARN Monitoring Metrics
- ZooKeeper Monitoring Metrics
- HBase Monitoring Metrics
- Hive Monitoring Metrics
- Spark Monitoring Metrics
- Presto Monitoring Metrics
- Trino Monitoring Metrics
- ClickHouse Monitoring Metrics
- Druid Monitoring Metrics
- Kudu Monitoring Metrics
- Alluxio Monitoring Metrics
- PrestoSQL Monitoring Metrics
- Impala Monitoring Metrics
- Ranger Monitoring Metrics
- COSRanger Monitoring Metrics
- Doris Monitoring Metrics
- Kylin Monitoring Metrics
- Zeppelin Monitoring Metrics
- Oozie Monitoring Metrics
- Storm Monitoring Metrics
- Livy Monitoring Metrics
- Kyuubi Monitoring Metrics
- StarRocks Monitoring Metrics
- Kafka Monitoring Metrics
- Alarm Configurations
- Alarm Records
- Container-Based EMR
- EMR Development Guide
- Hadoop Development Guide
- HDFS Common Operations
- HDFS Federation Management Development Guide
- HDFS Federation Management
- Submitting MapReduce Tasks
- Automatically Adding Task Nodes Without Assigning ApplicationMasters
- YARN Task Queue Management
- Practices on YARN Label Scheduling
- Hadoop Best Practices
- Using API to Analyze Data in HDFS and COS
- Dumping YARN Job Logs to COS
- Spark Development Guide
- Hbase Development Guide
- Phoenix on Hbase Development Guide
- Hive Development Guide
- Presto Development Guide
- Sqoop Development Guide
- Hue Development Guide
- Oozie Development Guide
- Flume Development Guide
- Kerberos Development Guide
- Knox Development Guide
- Alluxio Development Guide
- Kylin Development Guide
- Livy Development Guide
- Kyuubi Development Guide
- Zeppelin Development Guide
- Hudi Development Guide
- Superset Development Guide
- Impala Development Guide
- ClickHouse Development Guide
- Druid Development Guide
- TensorFlow Development Guide
- Jupyter Development Guide
- Kudu Development Guide
- Ranger Development Guide
- Doris Development Guide
- Kafka Development Guide
- Iceberg Development Guide
- StarRocks Development Guide
- Flink Development Guide
- RSS Development Guide
- Hadoop Development Guide
- Best Practices
- API Documentation
- FAQs
- Service Level Agreement
- Contact Us
Description
HBase table-level monitoring enables you to monitor the numbers of read and write requests and storage usage of each table in HBase.
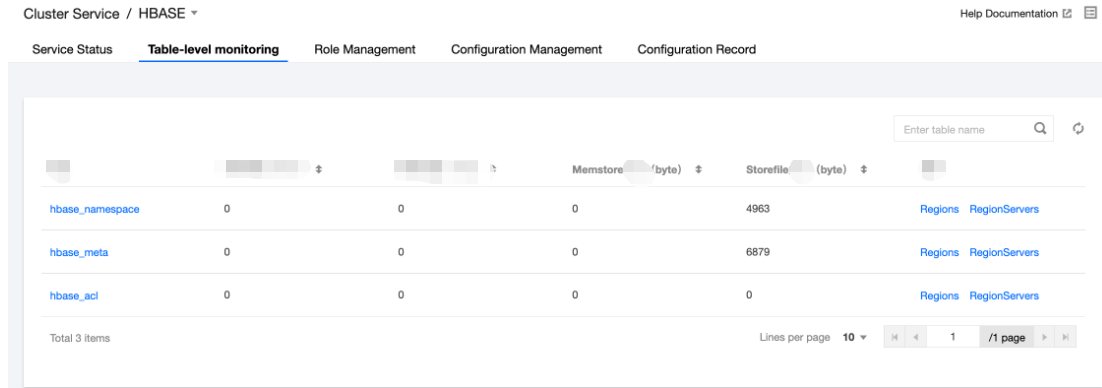
HBase Table Load List
1. Log in to the EMR console and click a Cluster ID/Name on the Cluster List page to enter the cluster details page.
2. On the cluster details page, click Cluster Service and select Operation > Table-Level Monitoring in the top-right corner of the HBase component block to query HBase table loads.
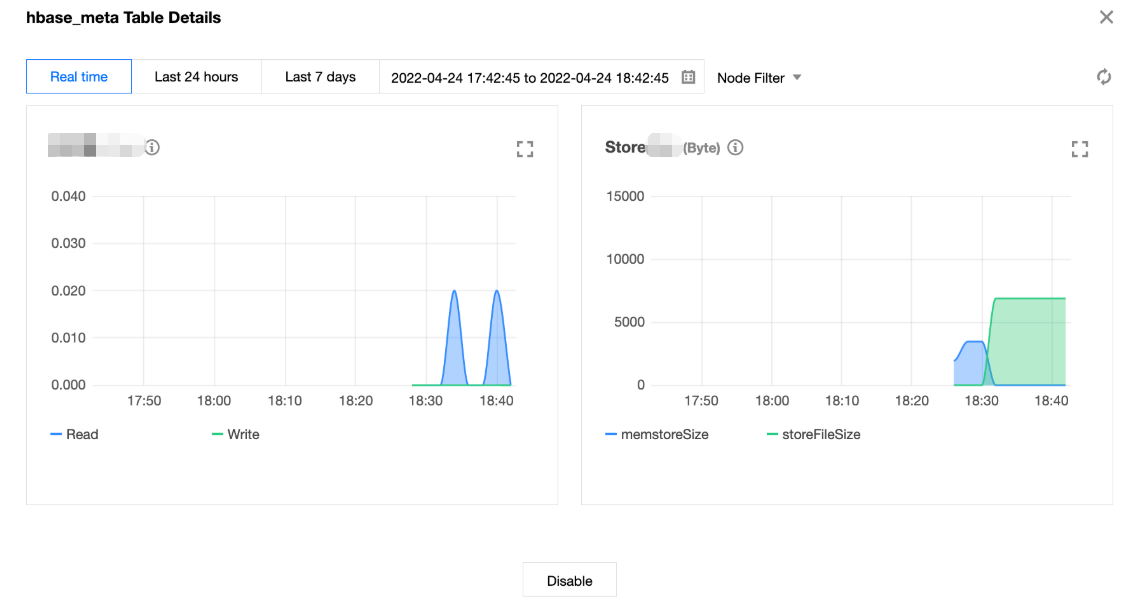
Viewing Table Details
Click a table name to pop up the table details. The details page can display the numbers of read and write requests and size of store (including MemStore and StoreFile) of the selected table in the dimension of the entire table or node. You can switch between nodes by using the Node Filter in the top-right corner.
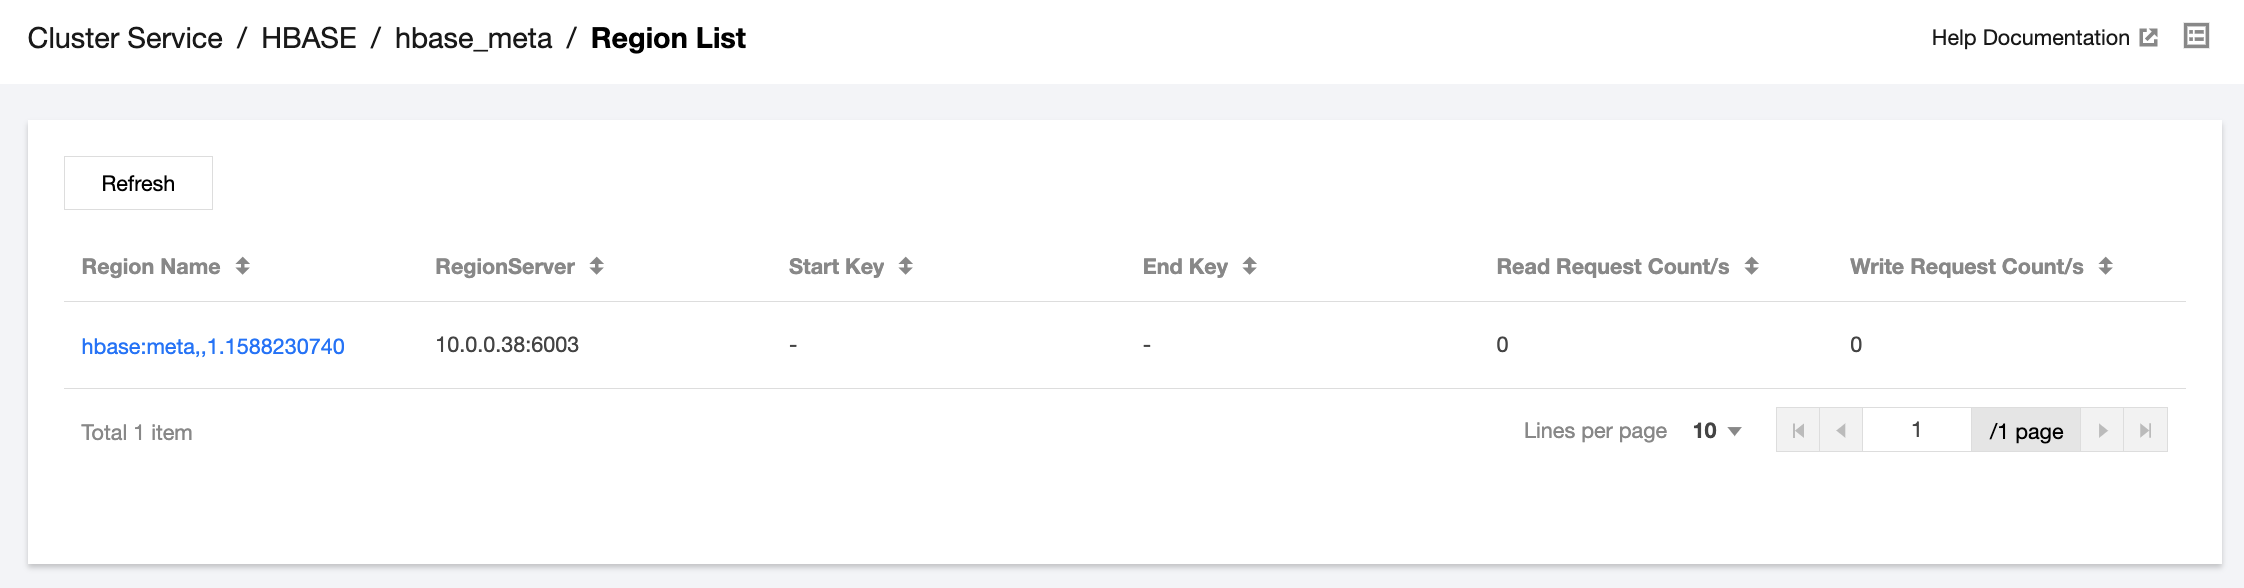
Regions Operation
Click Regions Operation to view the numbers of read and write requests of each region contained in the table.
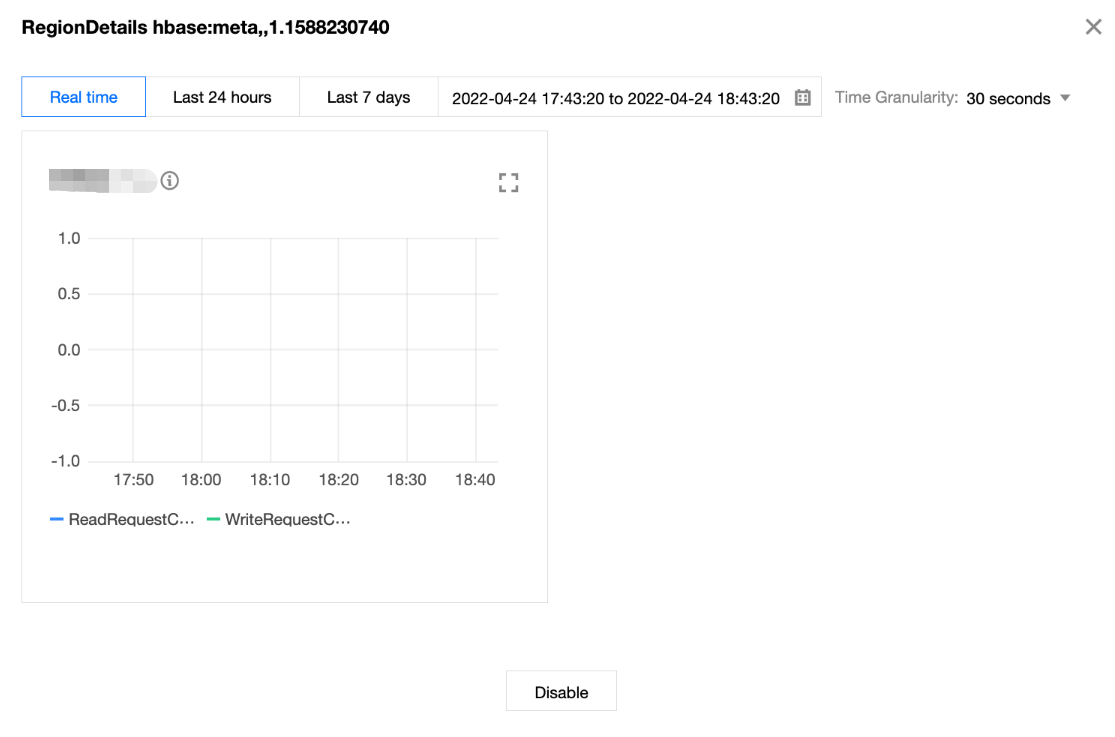
Region Details
Click a region name to pop up the region details page, where the numbers of read and write requests of the selected table are displayed at different time granularities. Click Time Granularity in the top-right corner to switch between time granularities.
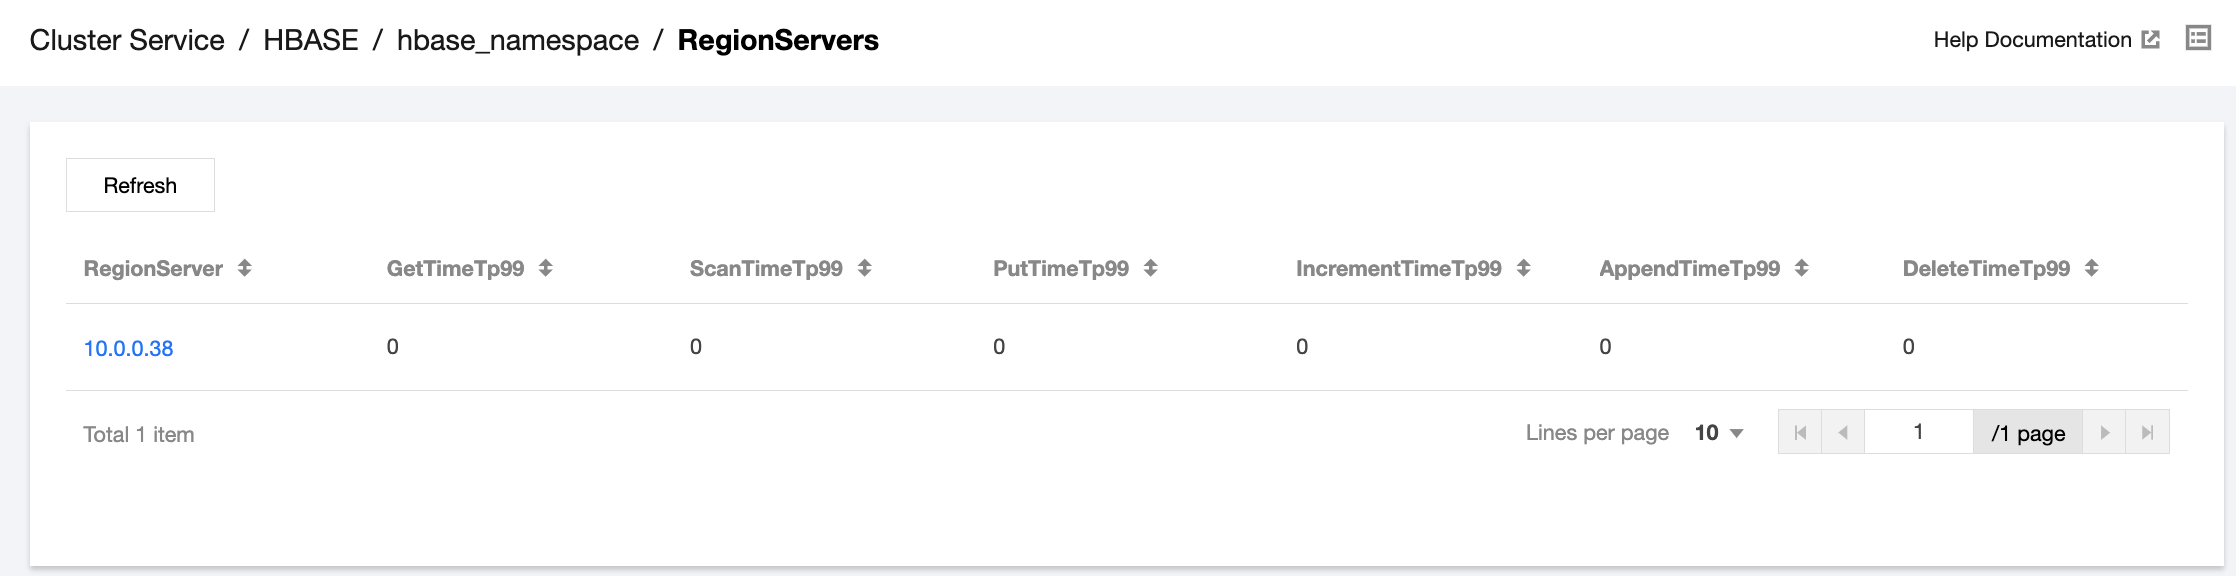
RegionServers Operation
Click RegionServers Operation to view the request delay of each RegionServer where the table is distributed.

 Yes
Yes
 No
No
Was this page helpful?