Instance Overview
Download
フォーカスモード
フォントサイズ
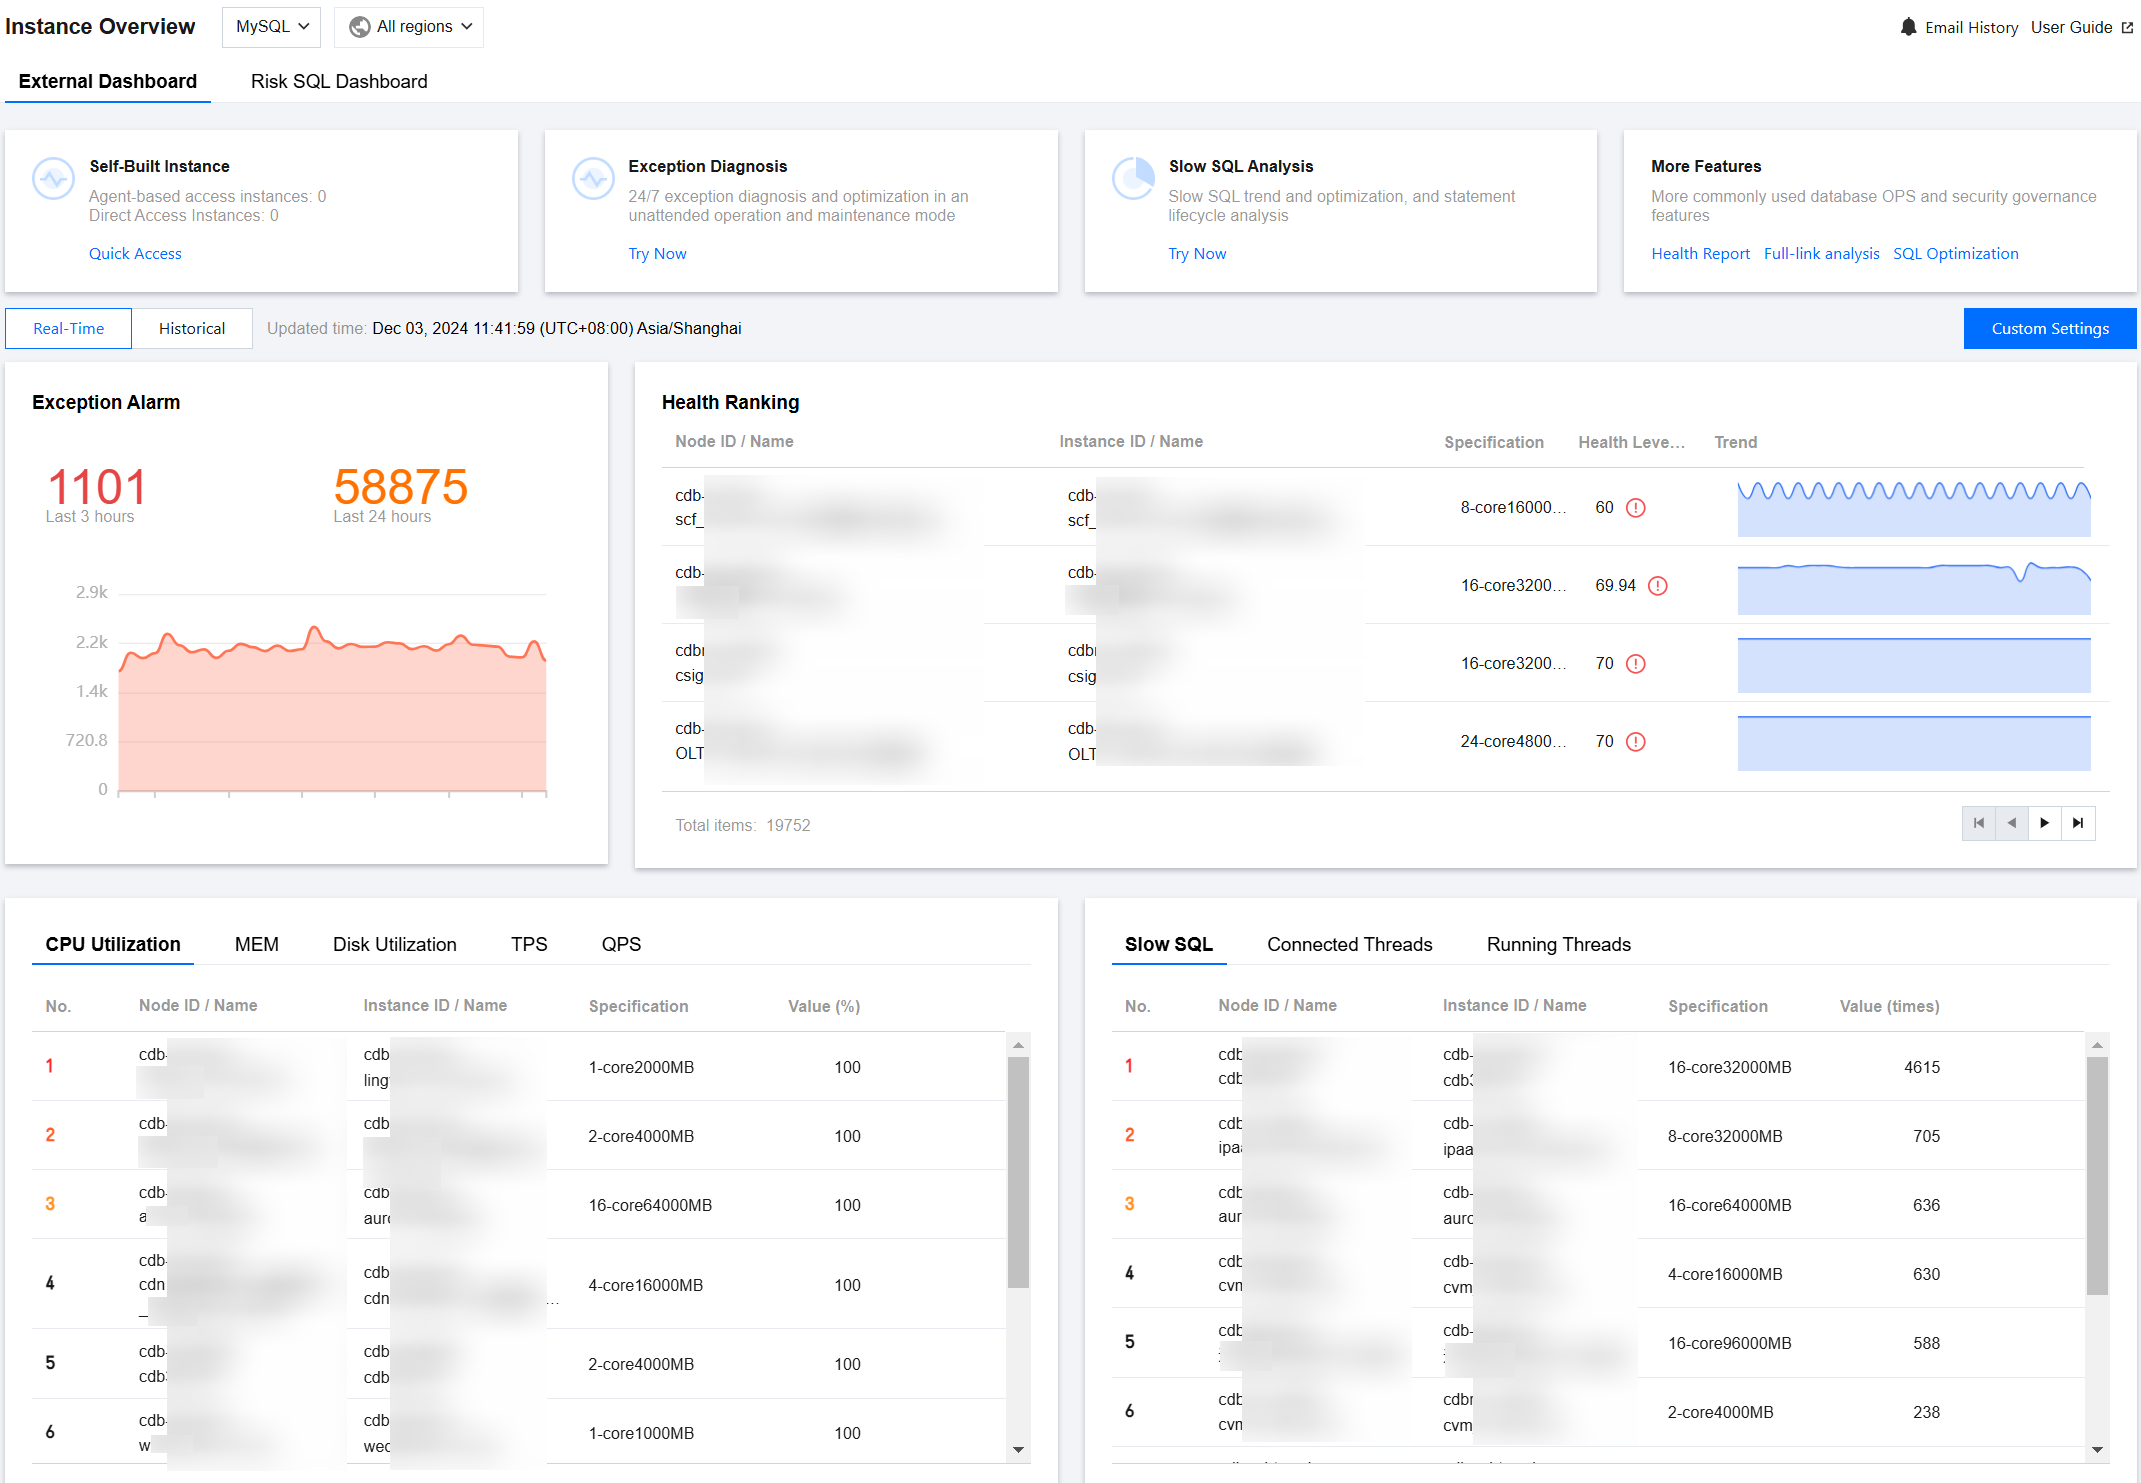
The Instance Overview page displays the global dashboard of user instances, where you can view the abnormal alarm count, health ranking, top performance metrics of all connected instances, and provides access to recommended features, and customization settings to enable or disable instance inspection and overview capabilities.
Note:
Currently, Instance Overview supports TencentDB for MySQL (excluding Single-node (Cloud Disk)), TDSQL-C (TDSQL-C for MySQL), TDSQL for MySQL, TencentDB for MariaDB, Tencent Cloud Distributed Cache, TencentDB for MongoDB, and user self-built MySQL databases.
Prerequisites
There are already instances with the Instance Overview feature enabled. All instances accessed to DBbrain have the Instance Overview feature enabled by default.
Directions
1. Log in to the DBbrain Console.
2. In the left sidebar, select Instance Overview.
3. Select the type of database and region to view at the top of the page.
4. View Instance Overview page.
View the recommended features.
Displays popular feature entries officially recommended by DBbrain, including Self-Built Instance Access, Exception Diagnosis, Slow SQL Analysis, and more features (such as Health Report and SQL Optimization). Feature item descriptions are as shown in the table below.
Feature | Descriptions and Operations |
Self-Built Instance | Provides an entry for accessing self-built MySQL instances, displaying the number of instances connected via Agent and Direct Connect under the logged-in account. Click Quick Access. View the supported access methods and access instructions. For self-built database access instructions and detailed operations, see Self-Built Database Access. |
Exception Diagnosis | 24/7-hour exception performance optimization and unattended operations mode. Click Try Now to enter Performance Optimization > Exception Diagnosis page. |
Slow SQL Analysis | Slow SQL trends and optimization and statement lifecycle analysis. Click Try Now to enter Performance Optimization > Slow SQL Analysis page. |
More Features | Covers various common database Ops and security governance features. Click Health Report to enter Performance Optimization > Health Report page. Click Full-link analysis to enter Full-link analysis > SQL Analysis page. Click SQL Optimization to enter Performance Optimization > SQL Optimization page. |
Customization Settings
DBbrain provides users with Customization Settings features, allowing users to customize the instances displayed in the Overview according to their needs.
In the top right corner of the page, click Custom Settings to enter Instance Management page. Here, you can customize whether to enable Instance Inspection, Overview, Full-link Analysis, or Large Key Analysis capabilities. For detailed operations, see Instance Configuration.
View real-time and historical instance overview information.
4.1.1 In the Exception Alarm area, select real-time or historical at the top.
Real-Time: Displays data information from the past 3 hours.
Historical: When you select to view historical information, the historical view supports any time period within a certain day in the past 7 days.
4.1.2 View exception alarms, health rankings, and performance monitoring metrics TOP table information for the selected time period. Detailed area descriptions are shown in the table below.
Region | Descriptions and Operations |
Exception Alarm | DBbrain's 24/7-hour exception diagnosis module will detect issues with database instances (or shards) in real time and provide corresponding optimization solutions. This section displays the number of exception alarms in the past 3 hours, the last 24 hours, and the trend chart of the number of exception alarms for the selected period. Click the abnormal alarm count to enter Monitoring & Alarm > Exception Alarm page to view details of exception alarms. |
Health Ranking | Ranks the average health score of instances during the selected time period and displays both the specification of instances (or shards) and the trend chart of the health score for the selected time period. Click the row of an instance (or shard) to enter the corresponding Performance Optimization > Exception Diagnosis page to view details of abnormal diagnoses. |
Top Performance Monitoring Metrics | Displays the top-ranking performance monitoring metrics by consumption in the Resource Monitoring Ranking. MySQL database metrics include: CPU, memory, disk utilization, TPS, QPS, slow SQL, Connected Threads, and Running Threads. TDSQL-C for MySQL database metrics include: CPU, memory, commit count, operations per second, slow SQL, Connected Threads, and Running Threads. TencentDB for MariaDB and TDSQL for MySQL database metrics include: CPU, data disk utilization, slow SQL, Connected Threads, and Running Threads. Tencent Cloud Distributed Cache database metrics include: CPU utilization, memory utilization, connection utilization, inbound traffic utilization, outbound traffic utilization, and read request hit rate. TencentDB for MongoDB database metrics include: CPU, memory, disk, QPS, number of connections, requests (>100 ms), and average request latency. Click the row of the corresponding instance (or shard) to perform the following operations: Click Monitor to enter the corresponding Intelligent Monitoring > Full Instance Monitoring page corresponding to the instance (or shard) to view the monitoring data. Click Optimization to enter Performance Optimization > Exception Diagnosis page corresponding to the instance (or shard) to view details of the exception diagnosis. |
フィードバック