How do I view the storage capacity usage of a TencentDB for MySQL instance?
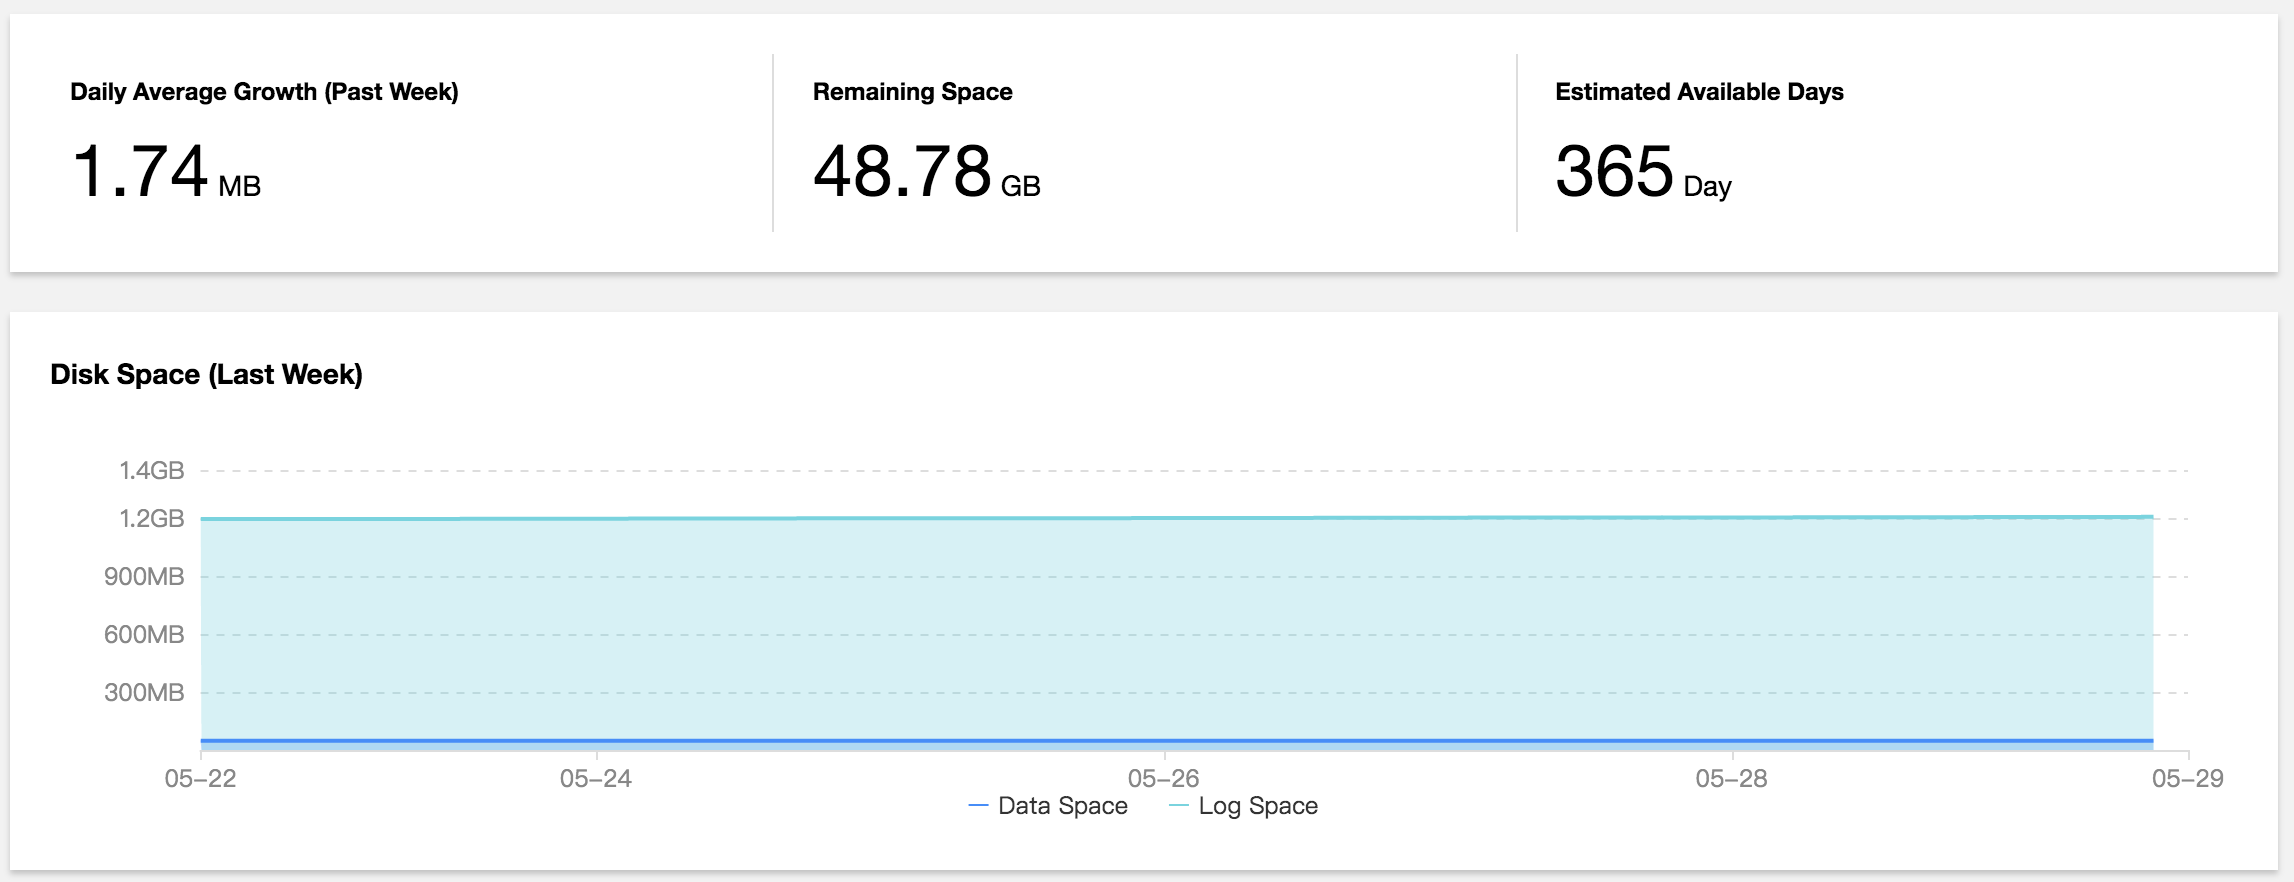
Log in to the DBbrain Console and select Performance Optimization on the left sidebar. On the displayed page, select a database at the top and select the Space Analysis tab.
On the capacity analysis page, you can view the comparison between daily increases in the last week, available disk capacity, estimated number of available days, and disk capacity usage trends in the last week. In addition, you can view the capacity utilization and fragmentation details of each database table in your instance.
How do I analyze the full SQL execution track of a TencentDB for MySQL instance?
Log in to the DBbrain Console and select Performance Optimization on the left sidebar. On the displayed page, select a database at the top and select the Audit Log Analysis tab.
1. Click Create Analysis Task at the top of the chart, select the desired time period, and click Confirm.
2. Click View SQL Analysis in the task list to access the SQL analysis page.
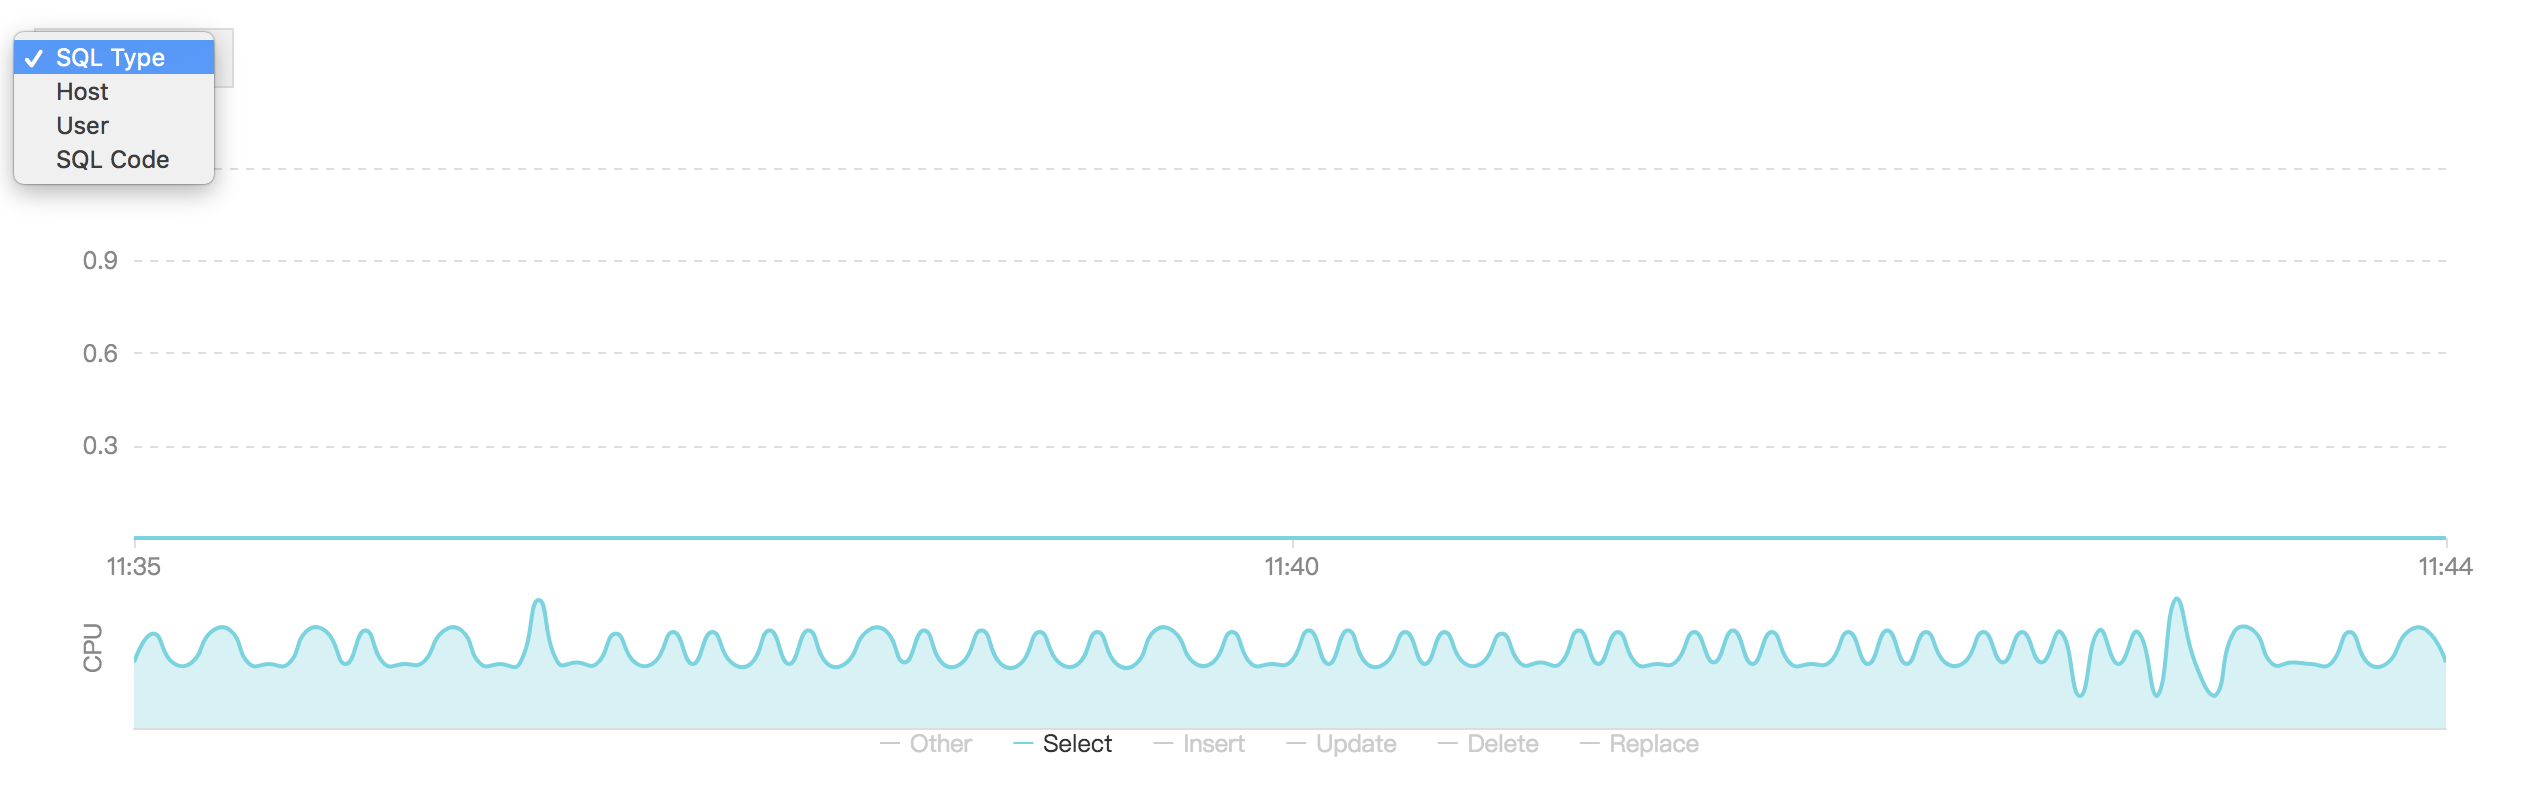
3. On the SQL analysis page, you can display the view by SQL Type, Host and User and specify a time period to expand the view and view data at specific time points.
4. Click the SQL template on the target row, and the SQL statement details will be displayed on the right.
On the analysis page, you can view and copy specific SQL statements and optimize them based on the provided optimization suggestion or description.
On the statistics page, you can view the statistical analysis and execution duration track of the specified types of SQL statements by Host, User, and SQL Code.
How do I perform diagnosis or optimization by myself when a TencentDB for MySQL instance is faulty or has an exception?
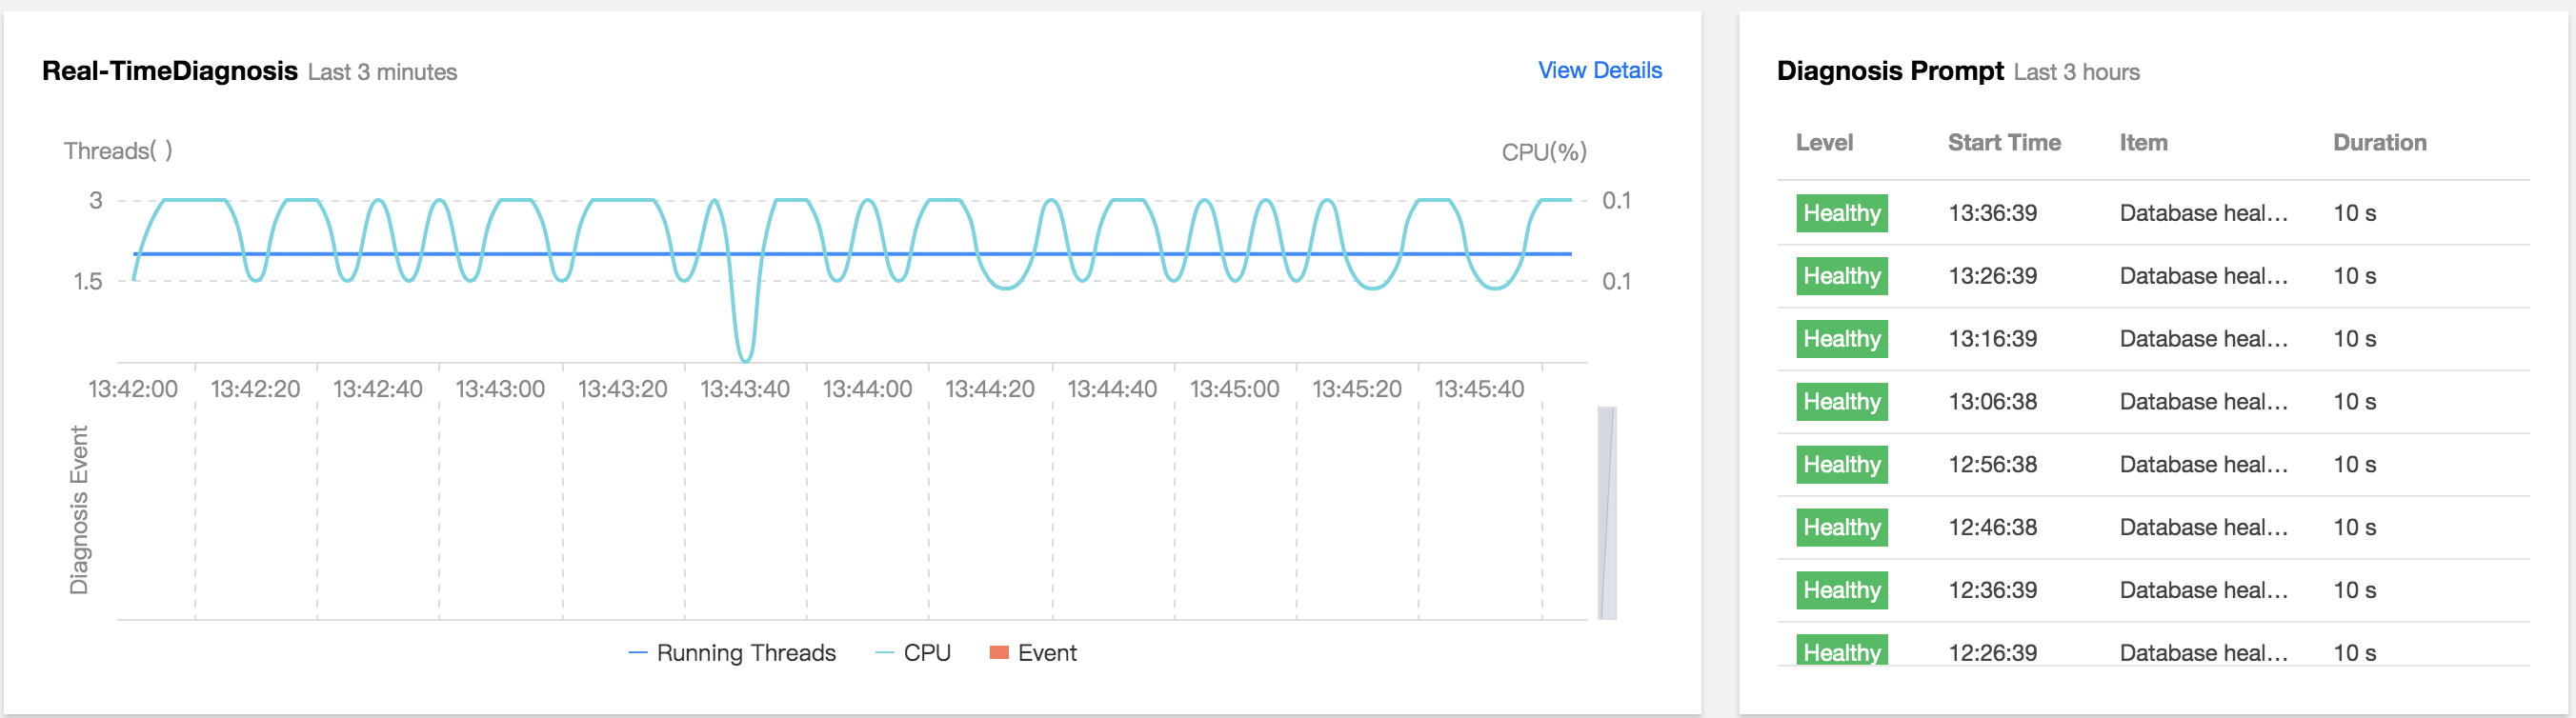
1. Log in to the DBbrain Console and select Performance Optimization on the left sidebar. On the displayed page, select a database at the top and select the Exception Diagnosis tab.
2. The "Diagnosis Prompt" column displays the diagnosis event history, including the health level, start time, diagnosis items, and duration. DBbrain performs health checks on the instance regularly.
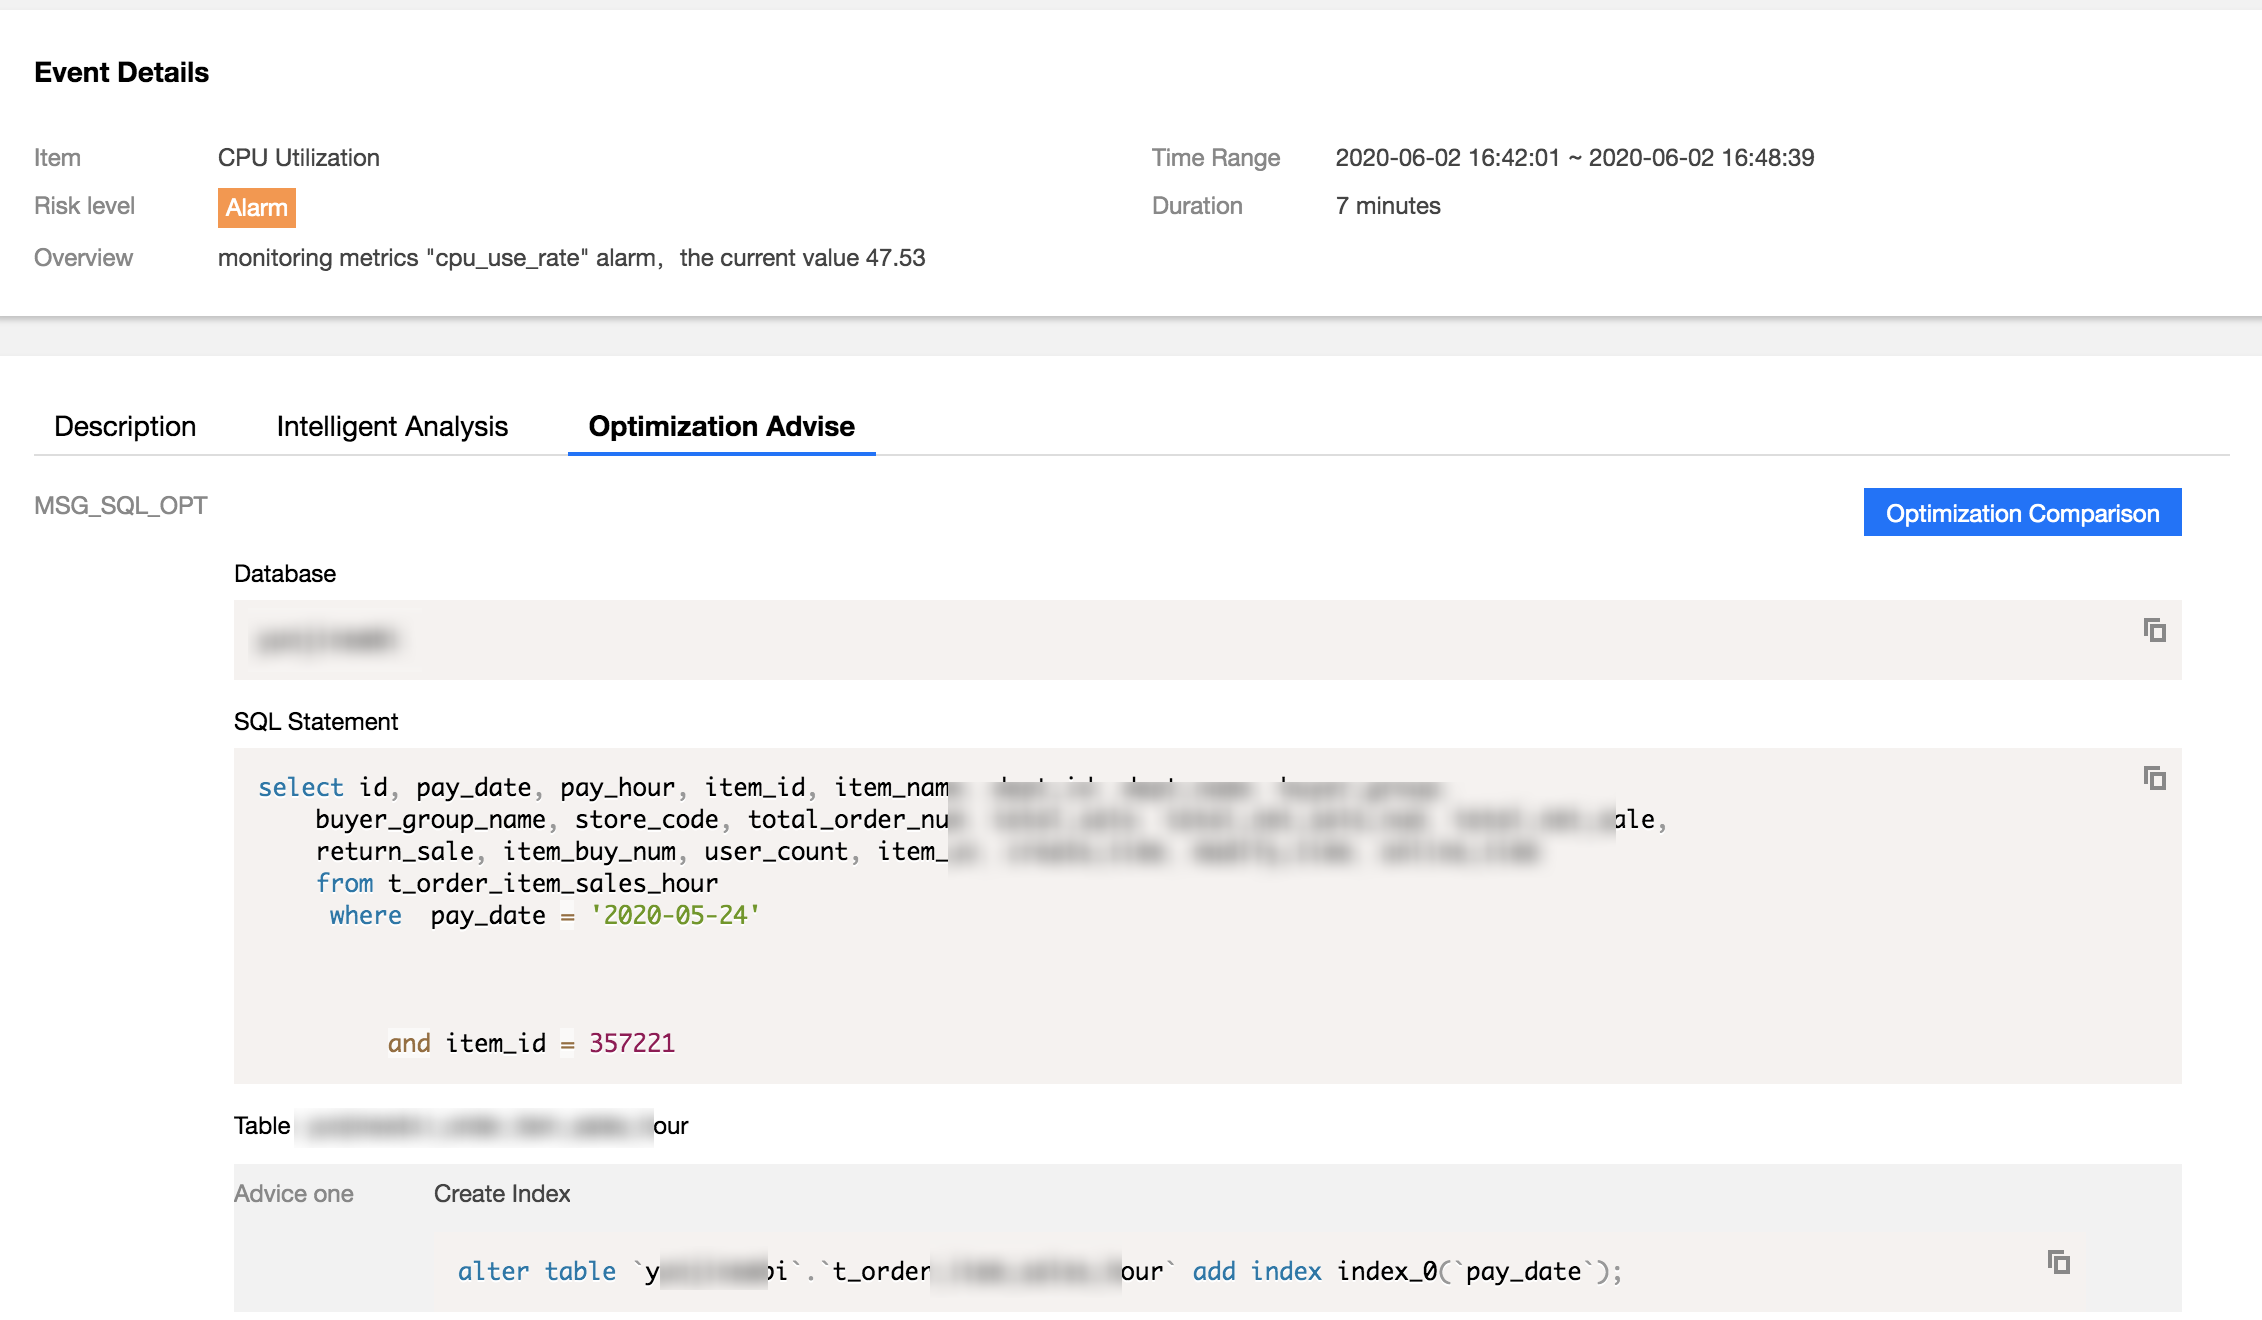
3. You can click View Details or a diagnosis item in the "Diagnosis Prompt" to access the diagnosis details page. Click a diagnosis event in the view, and its details will be displayed below, including the event overview, symptom description, intelligent analysis, and expert suggestions. Based on the expert suggestions, you can perform optimization to solve the database exception and improve the instance performance.
How can I receive the TencentDB for MySQL health report regularly?
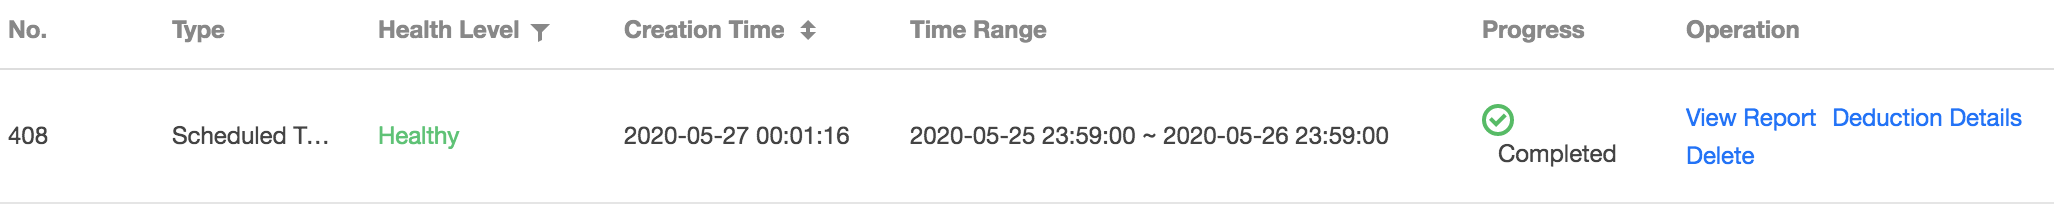
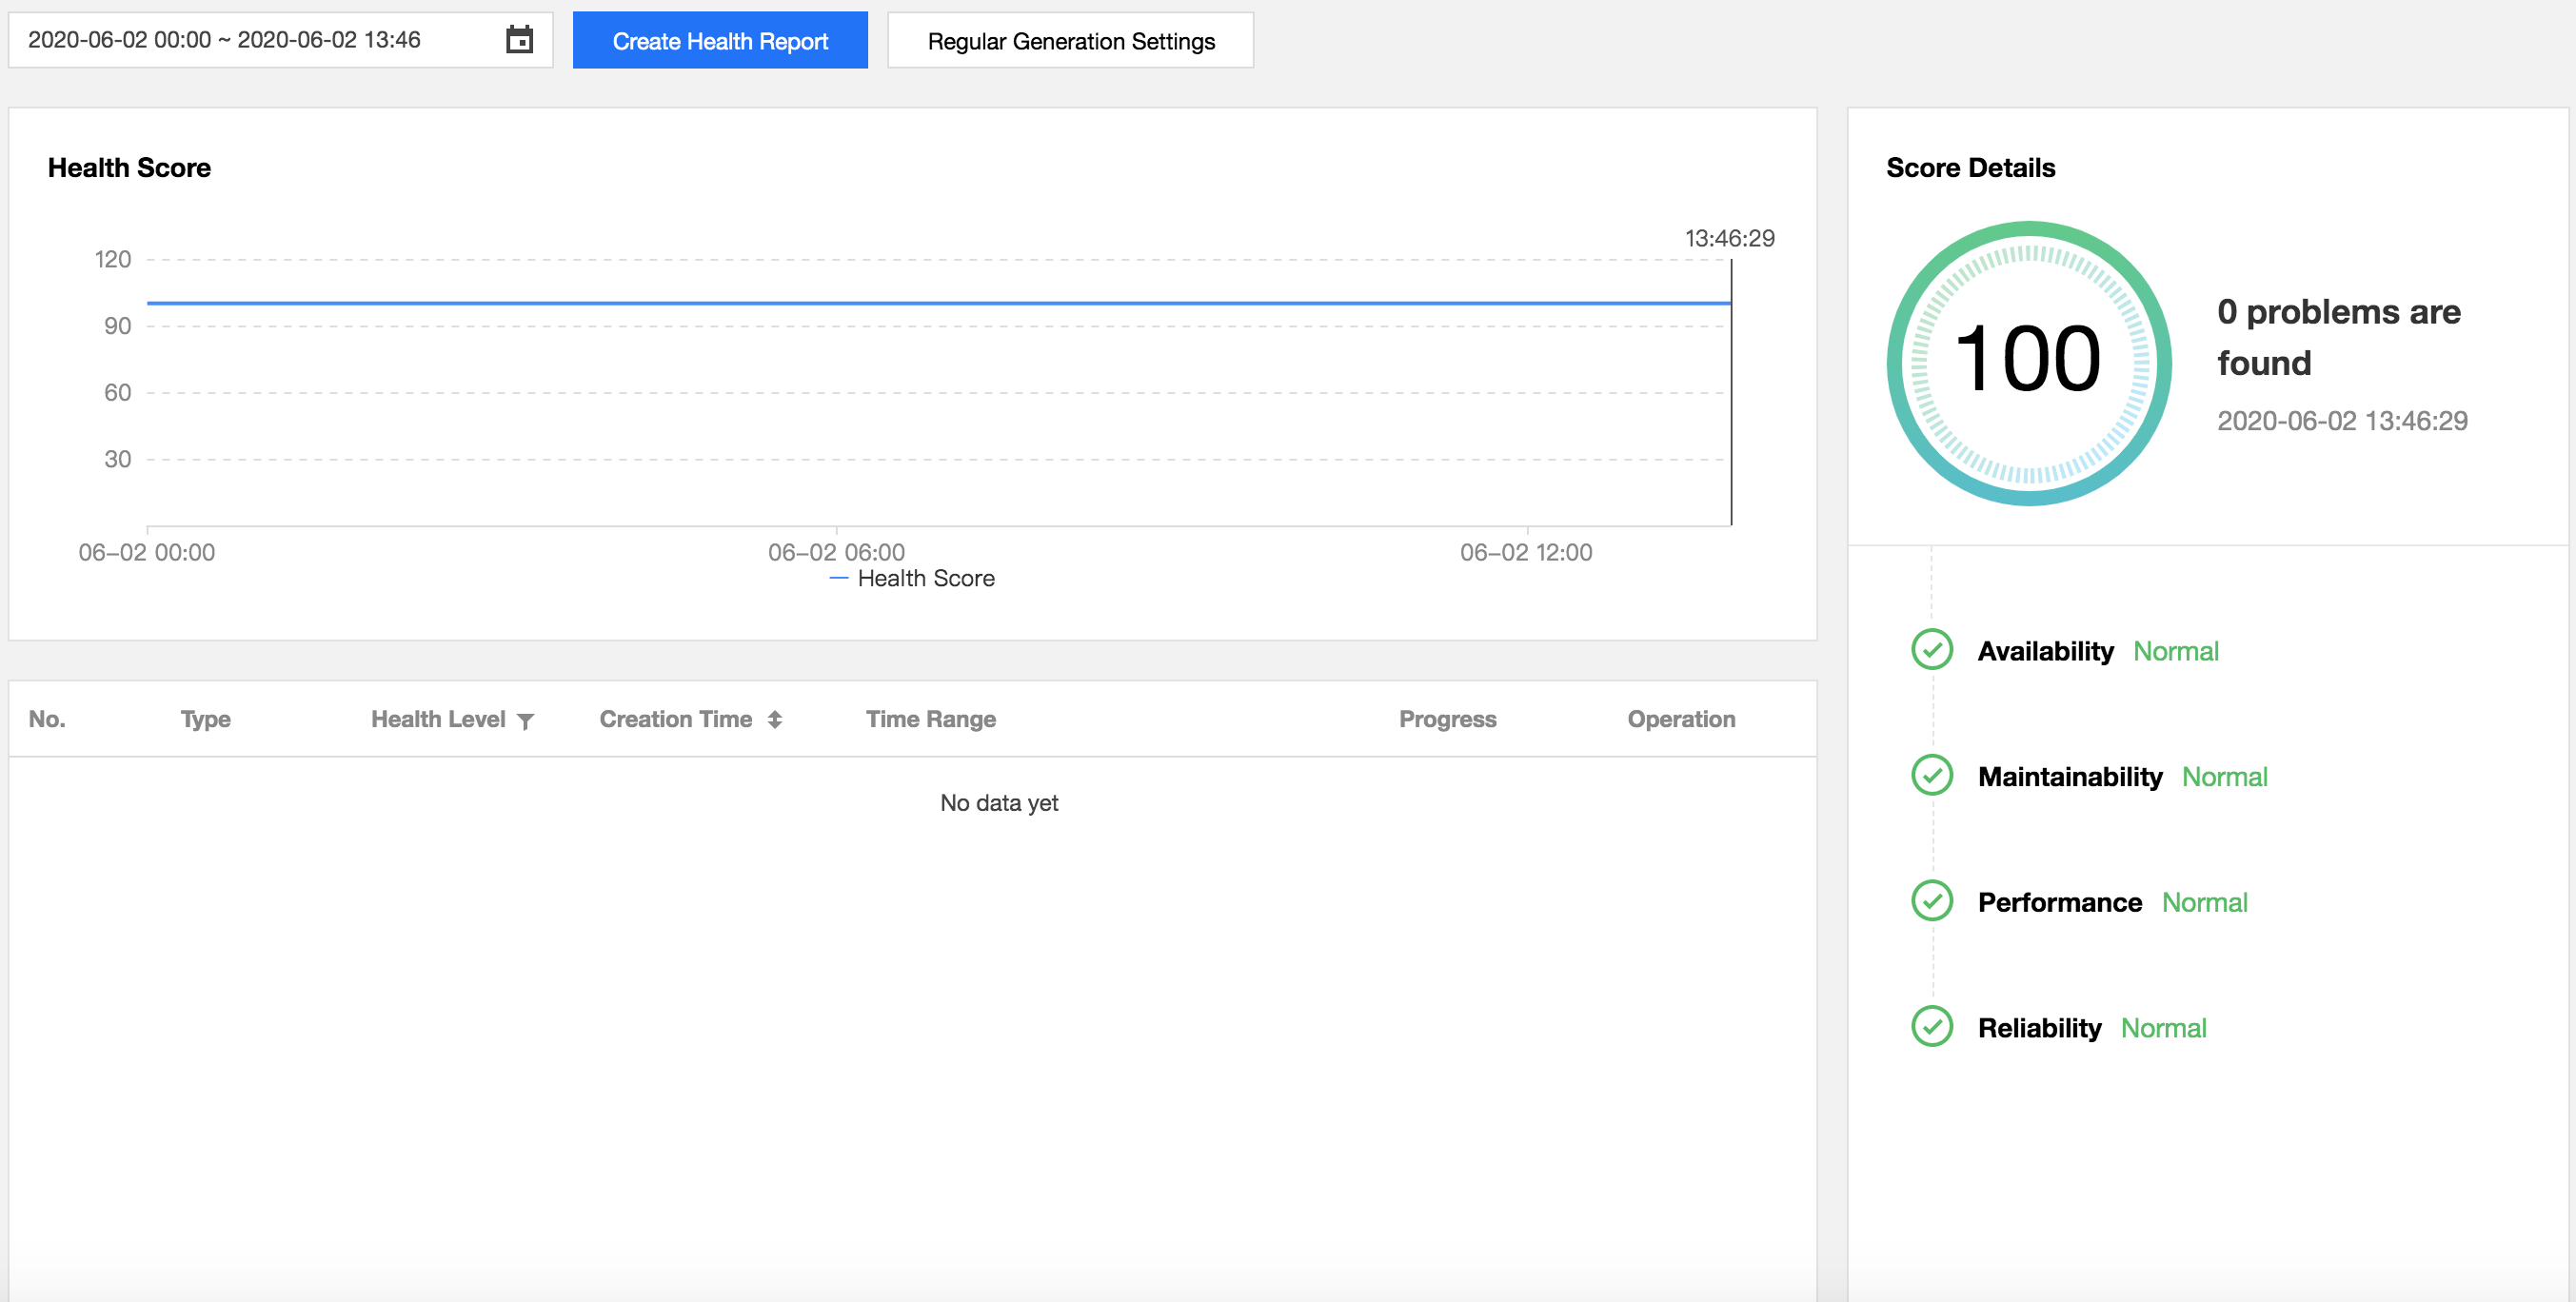
Log in to the DBbrain Console and select Performance Optimization on the left sidebar. On the displayed page, select a database at the top and select the Health Report tab. You can view health score trends and the problem overview for the specified time period.
Select the report time range and click Create Health Report. After the task is completed, you can view or download the health report for the specified time period.
Click Regular Generation Settings to configure the frequency for automatically generating health reports.
How do I view and optimize MySQL slow logs?
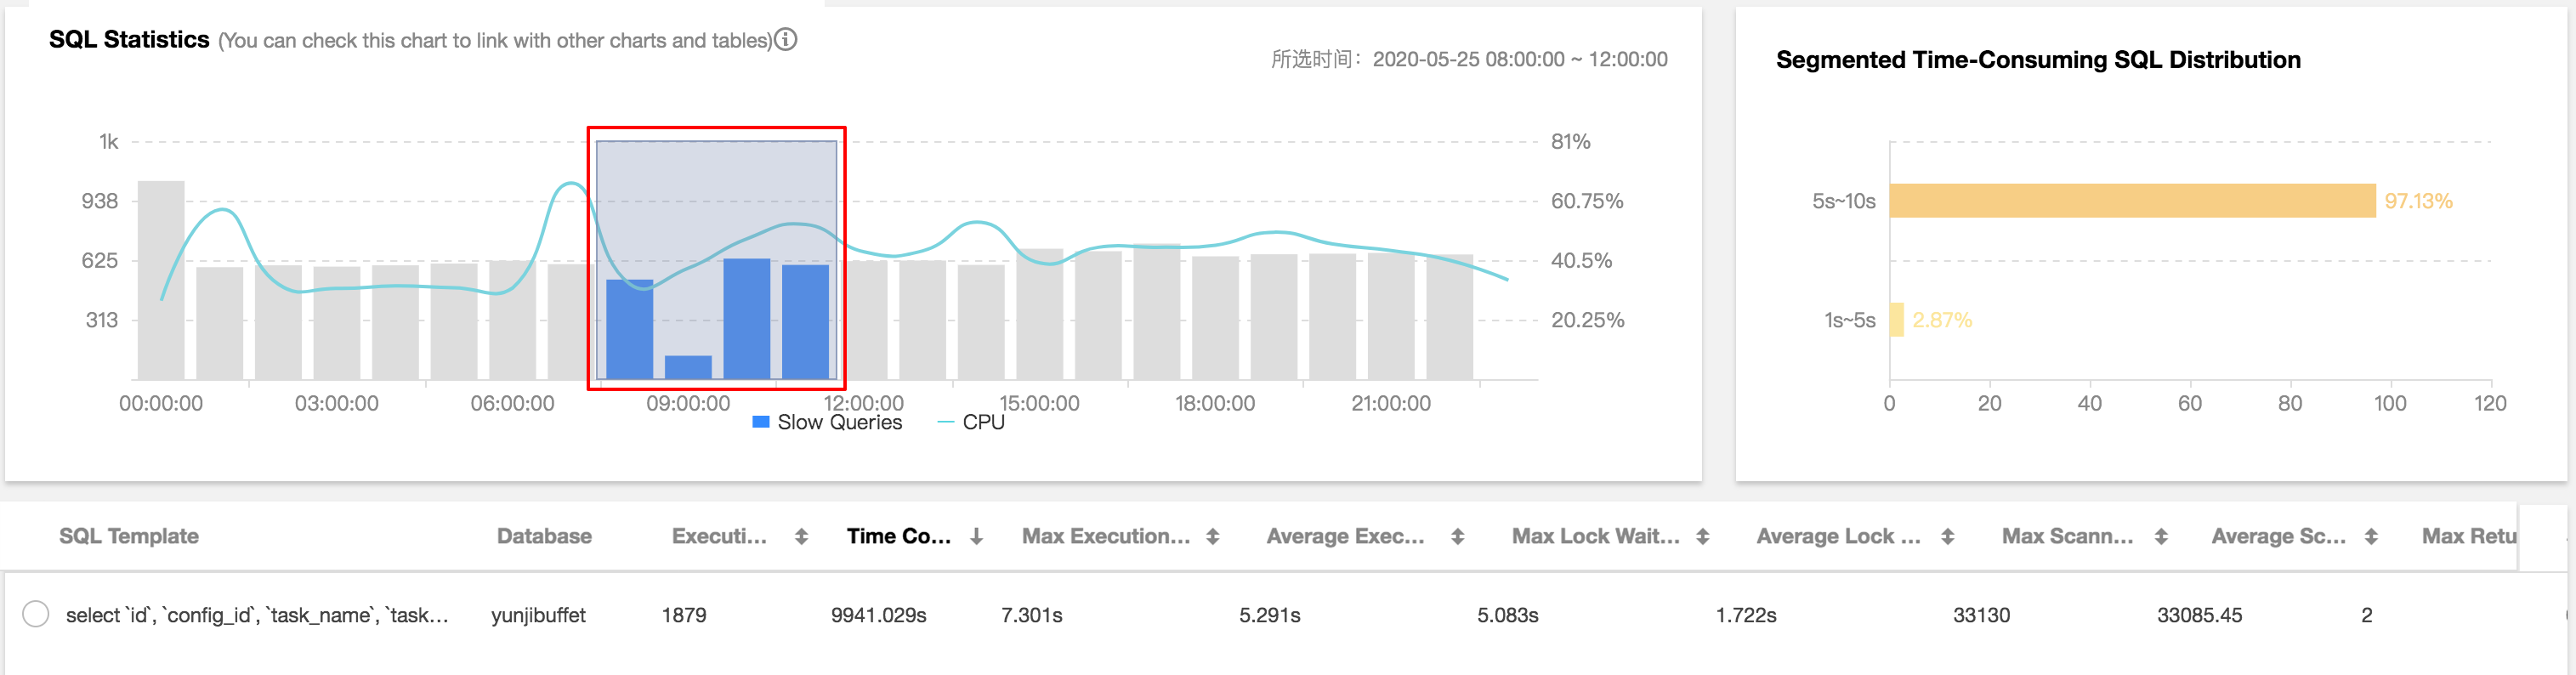
1. Log in to the DBbrain Console, select Diagnosis and Optimization on the left sidebar, and select Slow SQL Analysis at the top. The "SQL Statistics" section displays the number of slow queries and the CPU utilization of the instance.
2. You can click or drag slow queries in "SQL Statistics", and the aggregated SQL template and execution information will be displayed below. Each column of data can be sorted in ascending or descending order. The duration distribution section on the right displays the distribution of the overall SQL statement execution duration for the selected time period.
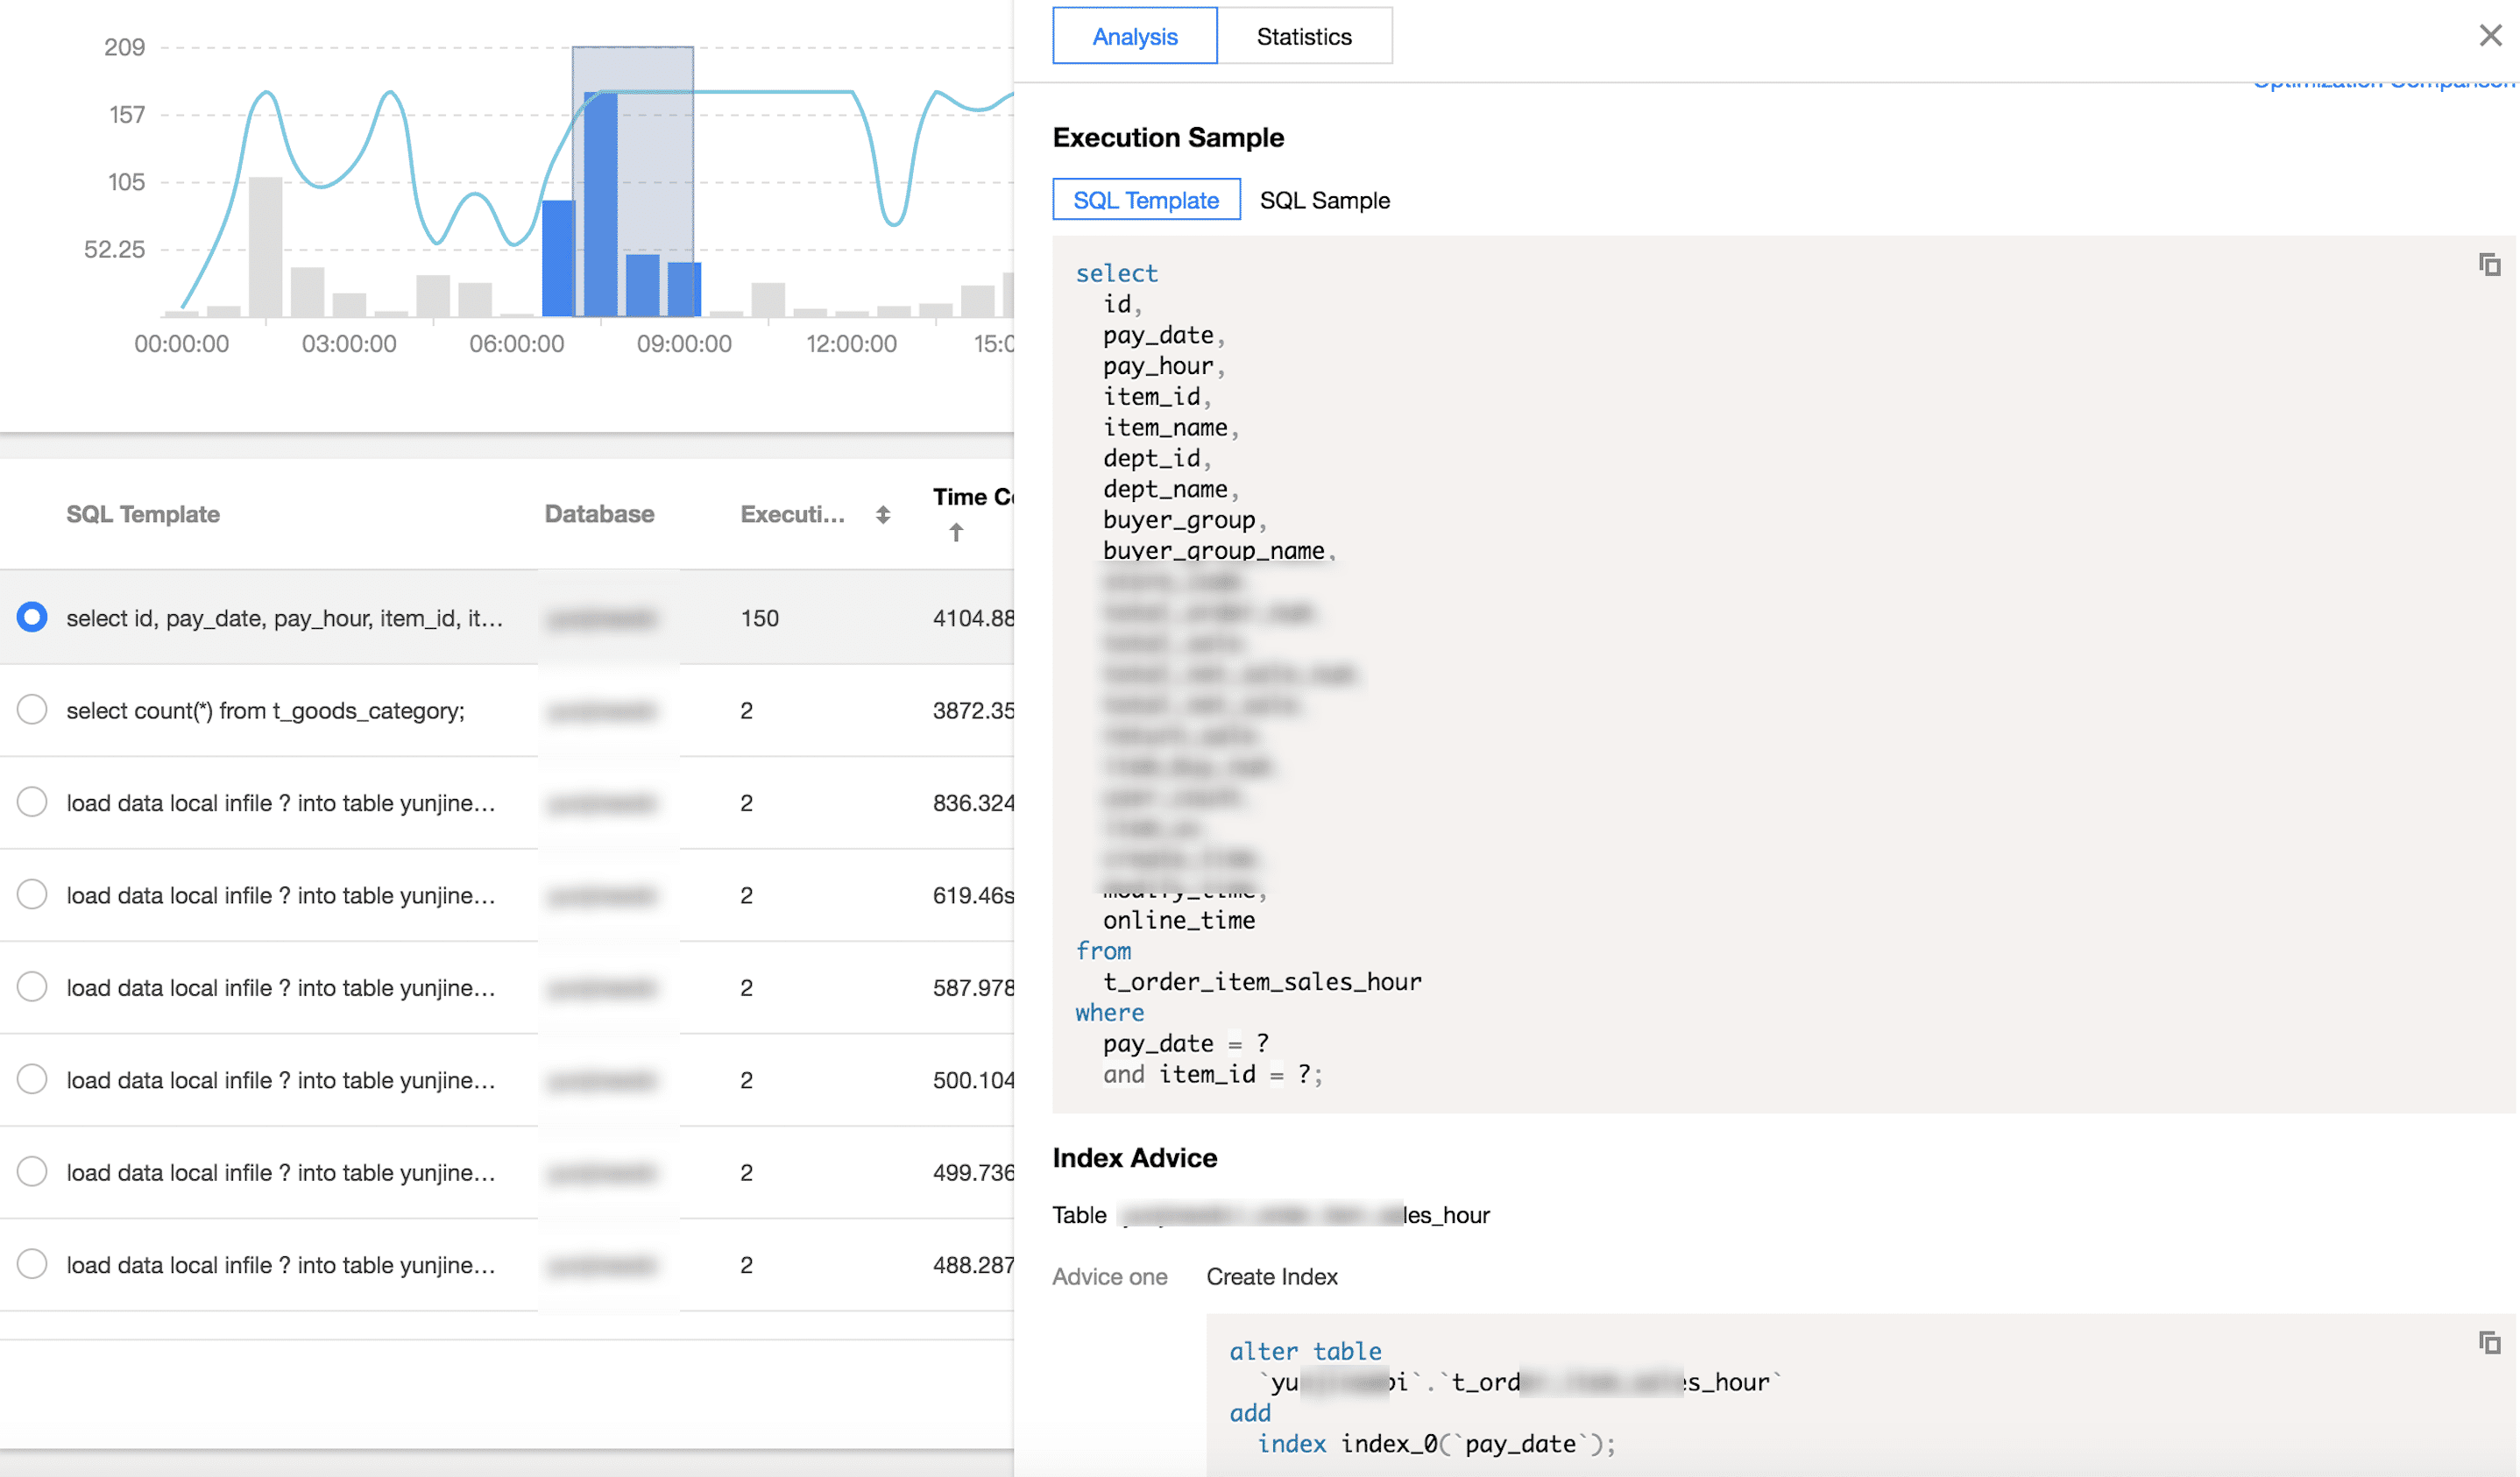
3. Click an aggregated SQL template and the SQL optimization suggestions and statistics will be displayed on the right. You can rewrite the SQL statement or add appropriate indexes based on the optimization suggestion to improve the SQL statement execution efficiency and database performance.