The exception alarm page displays the information overview of exception alarms (exceptions detected by "24/7 Exception Diagnosis") generated by database instances connected to DBbrain under your account.
Note:
Currently, exception alarm is supported only for TencentDB for MySQL (excluding basic single-node instances), TDSQL-C for MySQL, TencentDB for MariaDB, TDSQL for MySQL, Tencent Cloud Distributed Cache, TencentDB for MongoDB, and self-built MySQL.
2. In the left sidebar, choose Monitoring & Alarm > Exception Alarm.
3. On the top of the page, select the database type and region.
4. Select the time range for viewing alarms. Supported options are the last 3 hours, last 24 hours, last 7 days, and a custom time range.
5. View exception alarms.
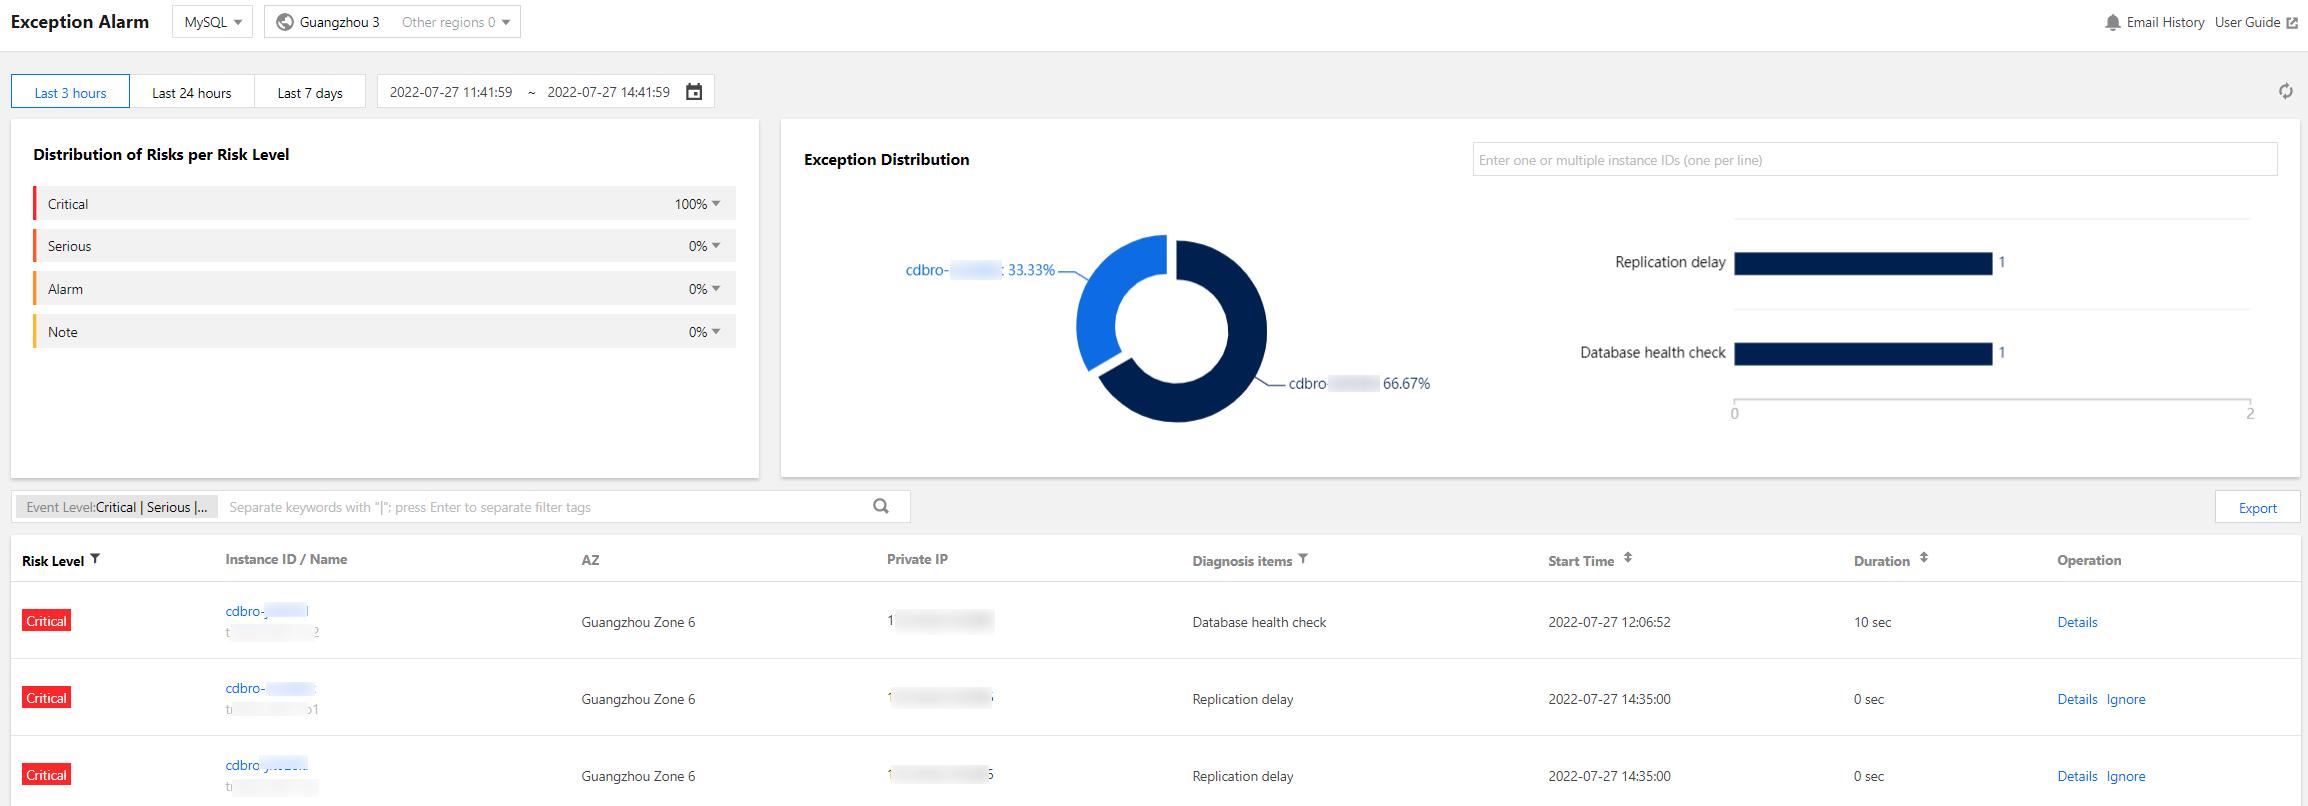
View distribution of risks per risk level:
Displays the proportion of alarms at each risk level (including note, alarm, serious and critical). Click a specific proportion number to view the involved diagnosis items and the number of alarms. Click a specific diagnosis item's row in the alarm list to show the list of that diagnosis item.
View exception distribution:
In the pie chart, you can view the proportion of exception alarms for each instance. Click the instance name to view the diagnosis items and the number of alarms related to each instance. It also supports filtering by instance ID to view the alarm proportion and involved diagnosis items and alarm quantity for one or more instances.
Click the right-side diagnosis items bar chart, and the alarm list will show the list of that diagnosis item.
View the exception alarms list:
You can filter alarms by instance name, instance ID, private IP address, and diagnosis items.
The list displays fields such as risk level, instance ID/name, diagnosis items, start time, last occurrence time, and operation. For different selected database types, the list shows different fields. Refer to the actual display.
Both risk level and diagnosis items in the list support filtering. The action bar supports viewing alarm details, ignoring, and unignoring alarms.
On the top right corner of the page, click collapse chart to collapse the risk level distribution and exception alarm distribution, showing only the exception alarms list.
2. In the left sidebar, choose Monitoring & Alarm > Exception Alarm.
3. On the top of the page, select the database type and region.
4. Select the time range for viewing alarms. Supported options are the last 3 hours, last 24 hours, last 7 days, and a custom time range.
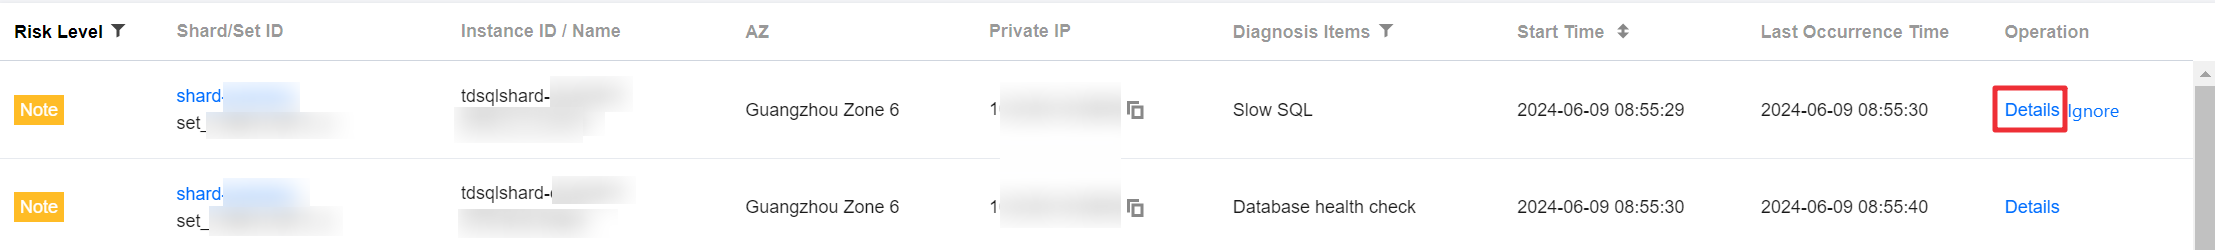
5. In the exception alarm list's Operation bar, click Details to enter the alarm details page, where you can view the alarm details corresponding to the instance.
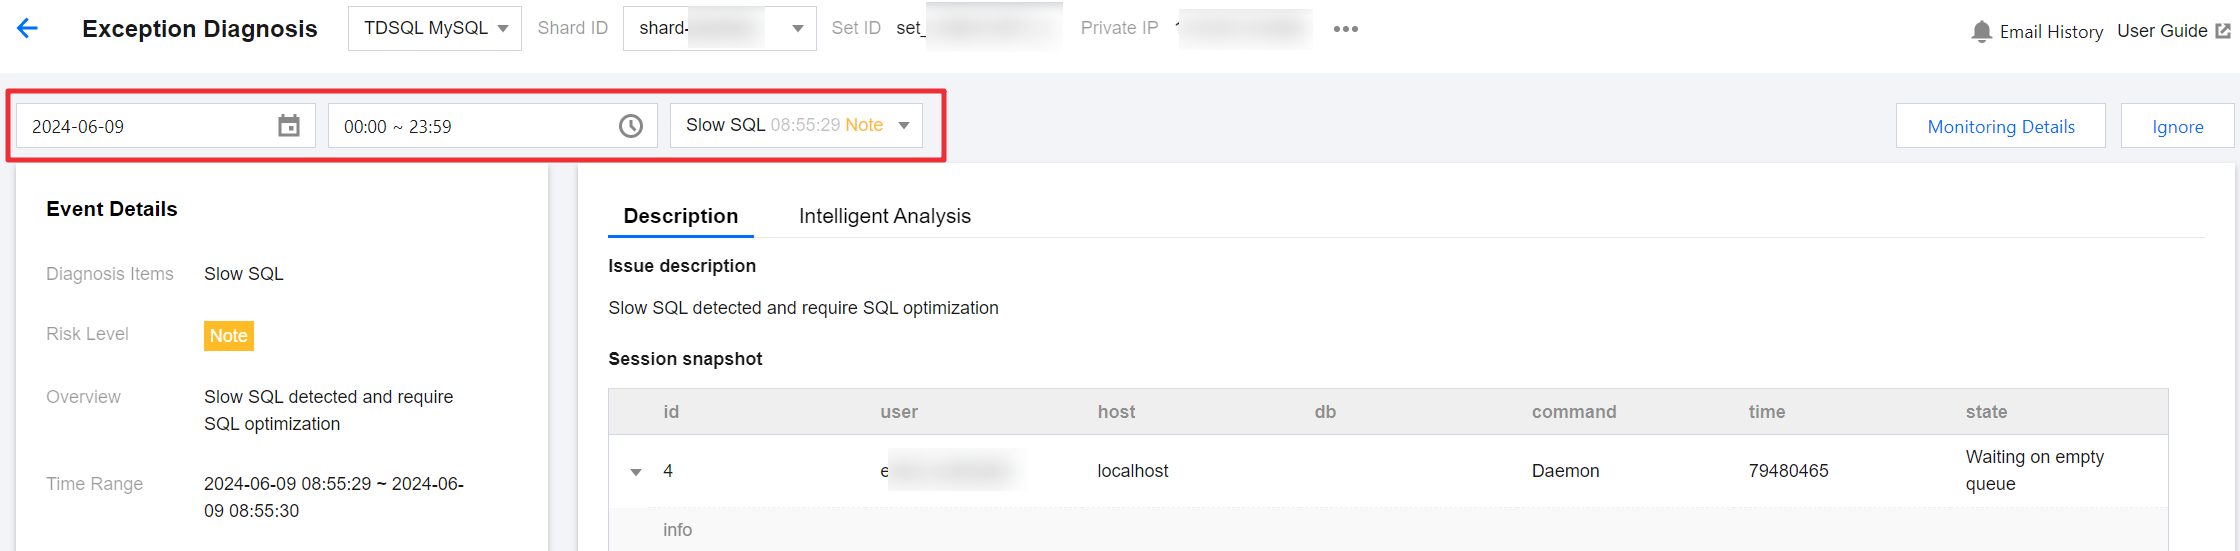
You can select the time range and diagnosis item type to view the alarm details. The content displayed in the alarm details varies according to the diagnosis item.
Ignoring/Unignoring an Alarm
You can ignore or unignore exception alarms that are not generated by health inspections to better filter exception alarms.
2. In the left sidebar, choose Monitoring & Alarm > Exception Alarm.
3. On the top of the page, select the database type and region.
4. Select the time range for viewing alarms. Supported options are the last 3 hours, last 24 hours, last 7 days, and a custom time range.
5. In the exception alarm list's Operation bar, click Ignore to select Ignore this item or Ignore this type, and then click OK. You can also ignore alarms on the alarm details page.
Ignore this alarm: Only ignores this specific alarm.
Ignore this type: Once it is configured, exception alarms caused by the same root cause will also be ignored.
Alarms that have been ignored will be grayed out.
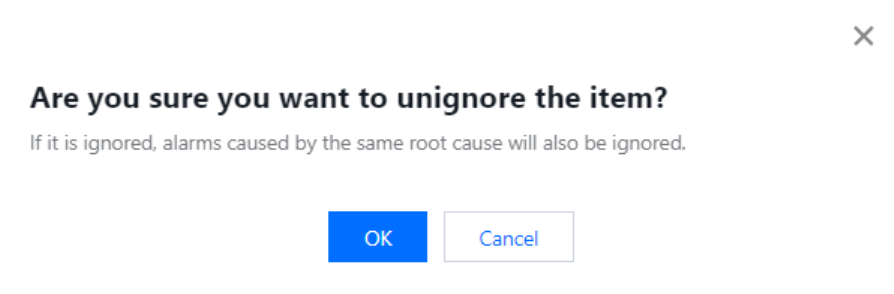
In the exception alarm list's Operation bar, click Unignore to unignore.
2. In the left sidebar, choose Monitoring & Alarm > Exception Alarm.
3. On the top of the page, select the database type and region.
4. Select the time range for viewing alarms. Supported options are the last 3 hours, last 24 hours, last 7 days, and a custom time range.
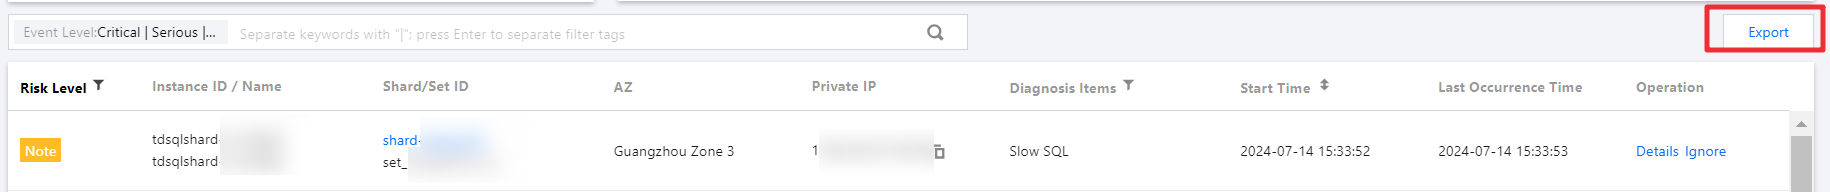
5. At the top of the exception alarm list, click Export to export the exception alarm list in .csv format.
Up to 10,000 pieces of alarm data can be exported.
Viewing an Alarm from a Database
Option 1
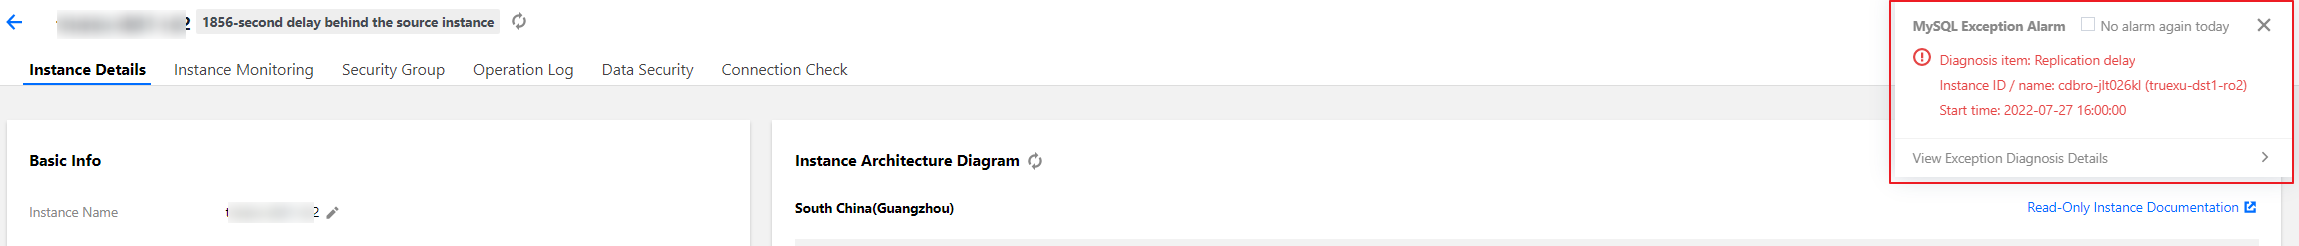
Log in to the supported database console. If an instance has an exceptional diagnosis issue at the current time, a pop-up window will be pushed in real time in the top right corner of the console to notify you. The message contains the instance ID/name, diagnosis item, and start time, allowing you to quickly understand the instance's diagnostic problems.
This document takes logging in to the MySQL console as an example to view alarms.
2. View exception alarms in the pop-up window on the top right of the page.
Click View Exception Diagnosis Details in the message notification to view the specific diagnostic details and optimization suggestion for the instance.
If you check No alarm again today in the message notification, when an exception diagnostic problem occurs in a database instance under your account, no exception alarm messages will be pushed to you in a pop-up window.
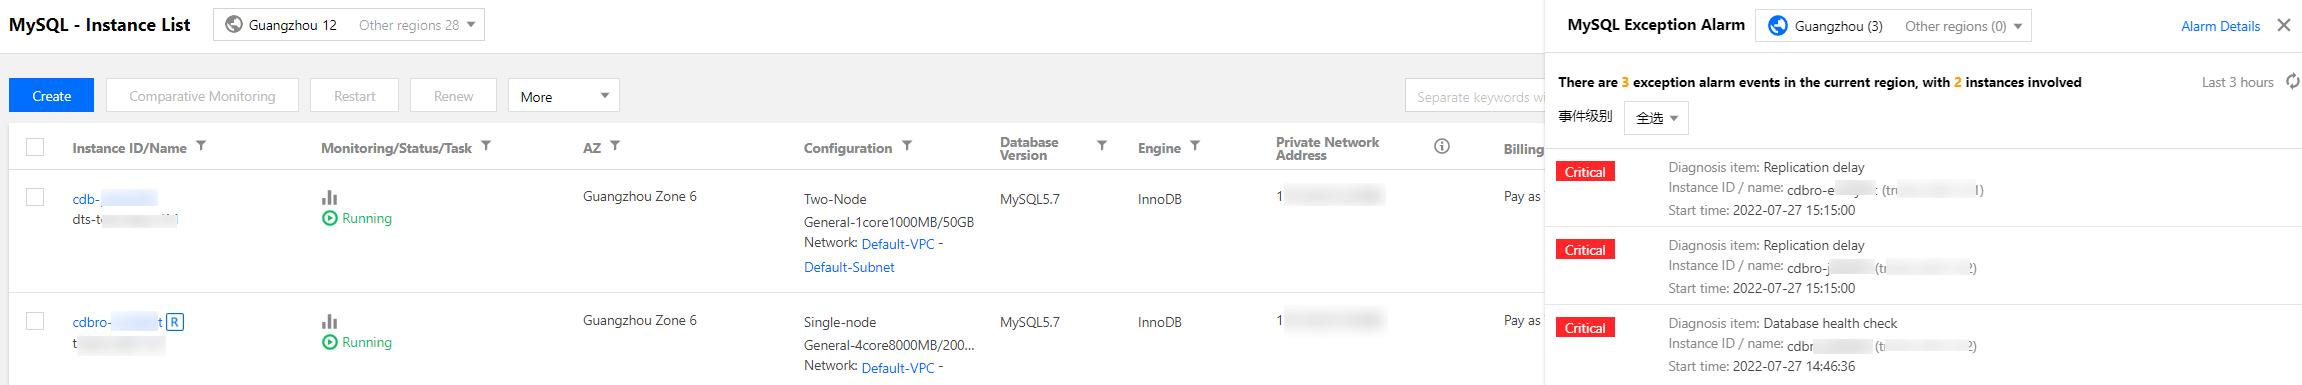
2. In the left sidebar, choose Instance List , Task List , Parameter Templates , Recycle Bin , or Placement Group. The number of exception alarms is displayed in the top right corner. Click Exception Alarms to expand the list of historical exception alarm messages.
In the unfolded list of historical exception alarm messages, you can view all pushed historical exception alarm messages. You can view them by region, and filter them by alarm level. You can also click a message to view the diagnostic details of the exception alarm event.