Tencent Cloud Distributed Cache's slow log analysis is different from MySQL and TDSQL-C. Tencent Cloud Distributed Cache slow logs are recorded separately for the instance and Proxy dimensions.
In the instance dimension, you can view detailed information such as CPU utilization, the number of slow queries, segmented time consumption statistics of logs, and a comprehensive list of slow logs.
In the Proxy (middleware cluster node) dimension, you can view the Proxy's slow log statistics, segmented time consumption statistics, and detailed slow log lists.
2. In the left sidebar, choose Performance Optimization.
3. At the top of the page, select Database Type as Distributed Cache, specify instance ID, and select Slow Log Analysis tab.
4. Select to view instance-level or Proxy node slow logs.
Click Instance to view the instance dimension's slow log statistics trend chart.
Click Proxy Node, and select the Proxy ID to analyze from the dropdown list. You can select the Proxy ID to analyze based on the trend chart of CPU utilization or slow log quantity change.
5. At the top of the page, select the time period. Options include today, last 5 minutes, last 10 minutes, last 1 hour, last 3 hours, last 24 hours, last 3 days, and custom time periods.
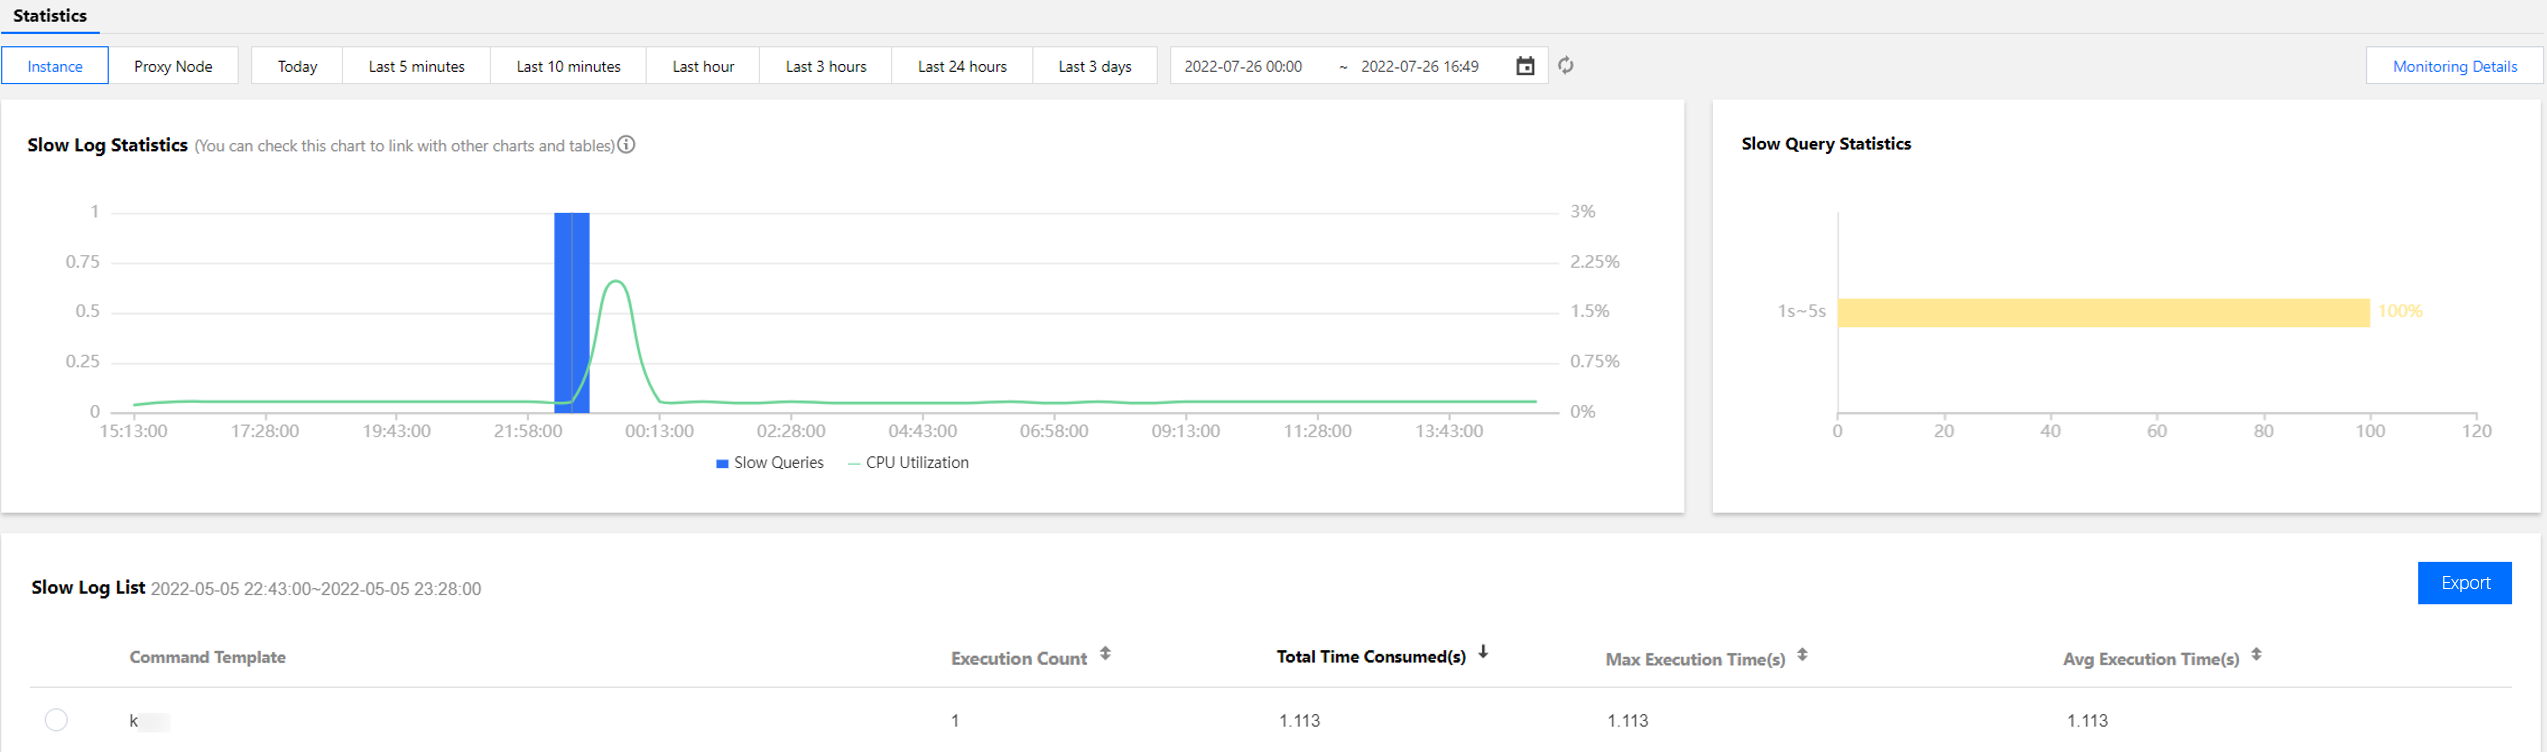
6. View the statistical trend chart of slow logs, segmented time consumption of slow logs, and slow log list data.
Slow Log Statistics: Click a single time range or drag to select multiple time ranges in the slow log statistics chart to view the slow log statistics in the corresponding time ranges.
Slow Query Statistics: This section displays the distribution of the overall time consumption within the selected period. The horizontal axis represents the percentage of slow logs, and the vertical axis shows the statistical period. Hover over a specific period to view the percentage of slow logs for that time.
Slow Log List: Click to view the analysis and statistics details.
If this instance has slow SQL in the selected time range, the slow log statistics will display the time points and the number of slow SQL statements in blue bar charts. Click the bar chart to view all corresponding slow SQL information (aggregated by templates) in the slow log list below. On the right, the segmented time consumption statistics will display the time consumption distribution of SQL statements in the corresponding period.
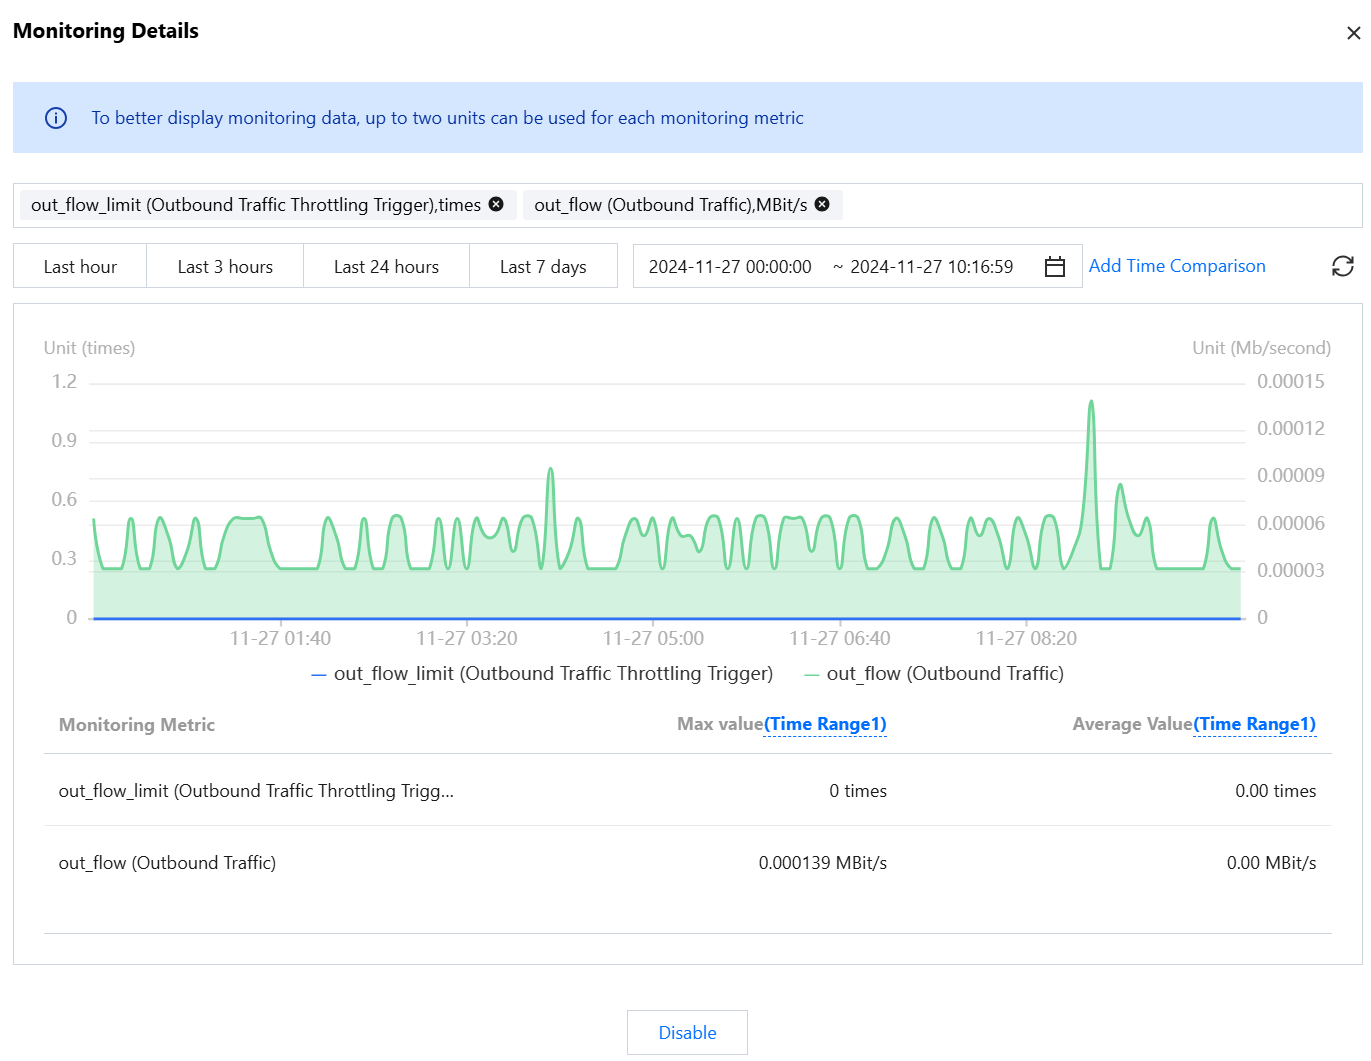
7. (Optional) In the upper right corner of the page, click Monitoring Details to view detailed monitoring metrics.
7.1 Select monitoring metrics. For better visualization, limit the selected metric units to two or fewer. For a description of the optional metrics, see Supported Monitoring Metrics.
7.2 Select a time range, with options including the last 1 hour, last 3 hours, last 24 hours, last 7 days, and custom time periods.
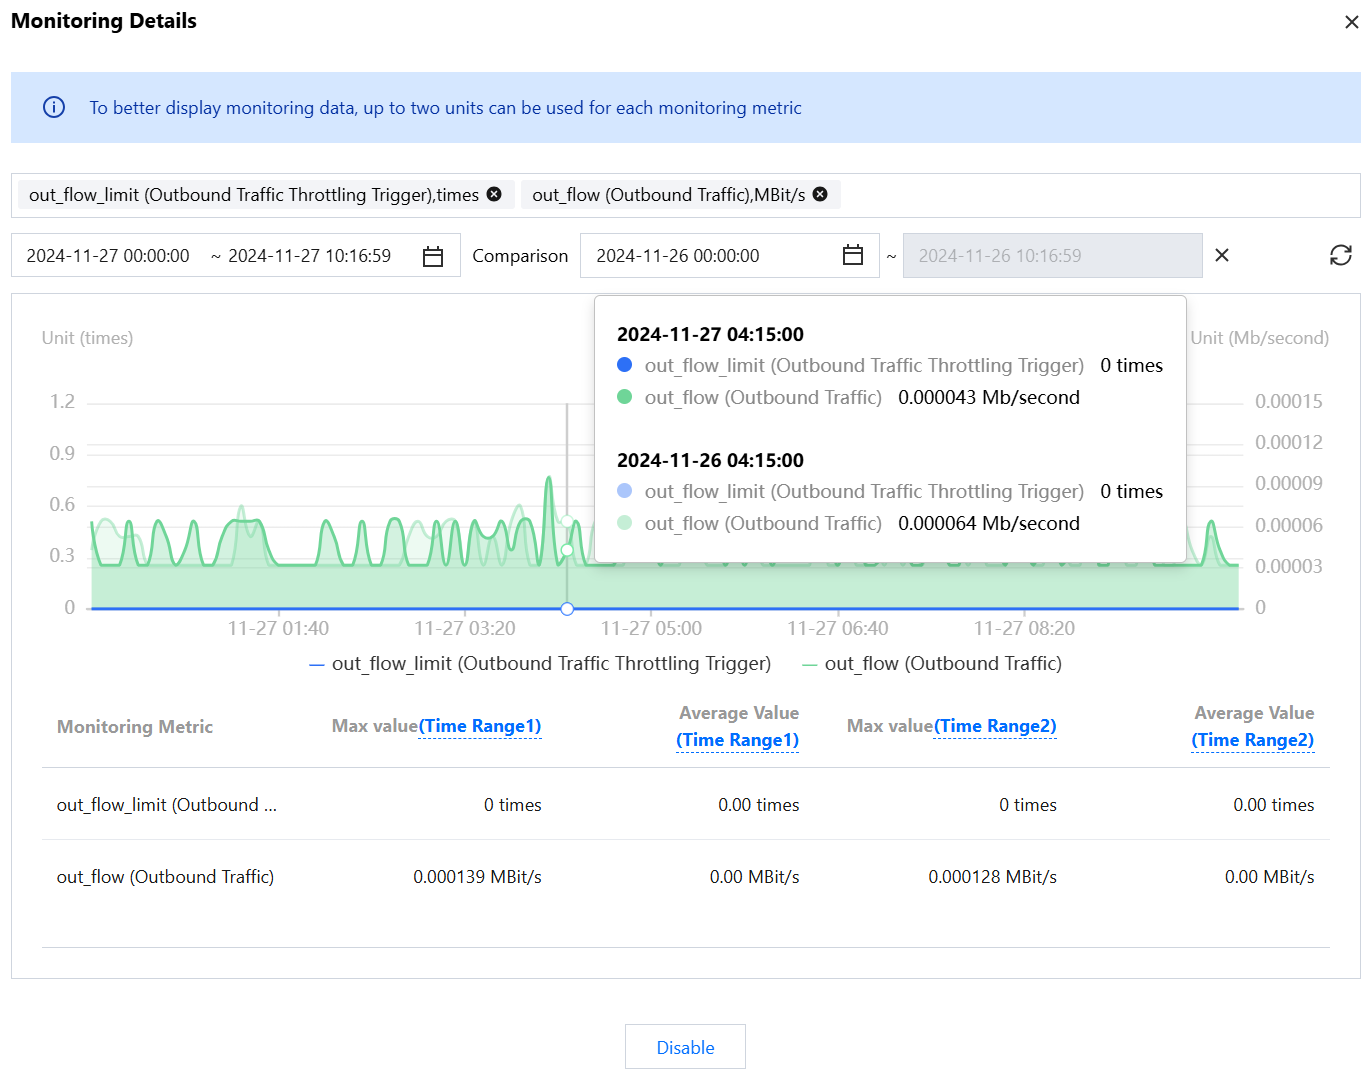
Click Add Time Comparison, enter the comparison period, and compare the monitoring metrics between two different time periods.
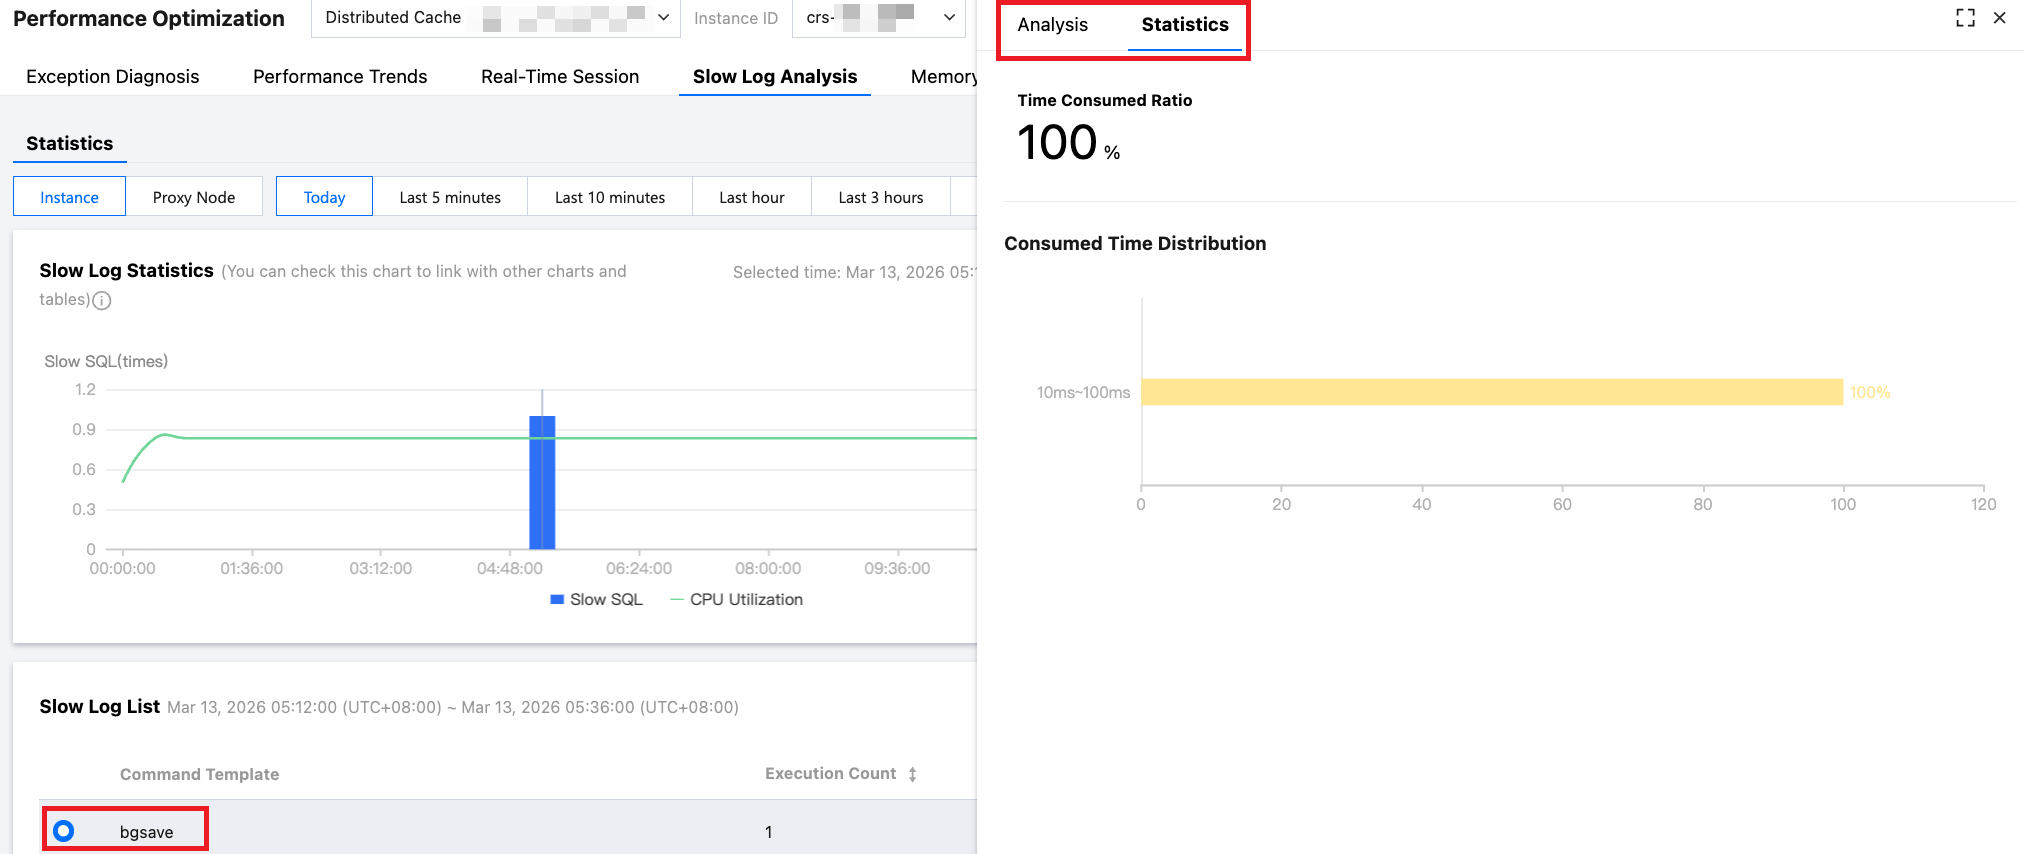
8. In the slow log list, click the aggregated command template, or click View in the row where the command template resides. A popup on the right displays the specific analysis and statistical data of the SQL.
On the Analysis page, you can view command templates, sample commands, optimization suggestions, and descriptions.
On the Statistics page, you can conduct a horizontal analysis of the specific reasons for the slow SQL using metrics such as total time consumption percentage, time distribution, and the access percentage of source IP addresses (only shown for proxy nodes), and make corresponding optimizations.
9. Export slow log analysis data.
On the right side of the slow log list, click
to export the slow log analysis data in .csv format to your local system for easy review.