Exception Diagnosis
Download
Focus Mode
Font Size
DBbrain's exception diagnosis feature performs 7×24 automatic inspections on database operation metrics, identifies performance exceptions, resource bottlenecks, slow queries, and other issues in real time, and displays them categorized by severity. This helps DBAs quickly perceive and handle database health problems.
Feature Overview
The exception diagnosis feature provides real-time and historical exception events monitoring for database instances, mainly including the following capabilities:
Feature Module | Description |
Overview | Displays the overall operational status trend chart within the selected time range. |
Real-time/Historical SQL | Displays SQL execution trends such as number of write requests, number of read requests, and number of requests. |
Real-time/Historical Slow SQL | Displays the correlation trend between the number of slow SQLs and CPU utilization to facilitate analyzing the impact of slow queries on resources. |
Diagnosis Prompt - Risk Distribution | Statistics of exception events distribution by severity level (Critical/Serious/Alarm/Note) in the last three hours. |
Diagnosis Details - Diagnosis Details | Displays the specific diagnosis event list, including level, start time, diagnosis item, last occurrence time, and so on. |
Diagnosis Level Description:
Level | Color | Description |
Critical | Red | Severely impacts business and requires immediate action. |
Serious | Orange | Poses significant risks. It is recommended to address it promptly. |
Alarm | Yellow | Potential risks exist and require attention. |
Note | blue | General note. Optimize as needed. |
Prerequisites
The current account has view permissions for the target instance.
The instance is running normally.
Operation Steps
View Diagnostic Information
1. Log in to the DBbrain console.
2. In the left sidebar, select Performance Optimization.
3. Select the PostgreSQL database type and instance ID at the top, then choose the Exception Diagnosis tab.
4. At the top of the page, select to view real-time or historical diagnosis information.
5. View the health score trend chart, diagnosed exception events, and SQL trend chart within the time frame.
Viewing the health score trend chart
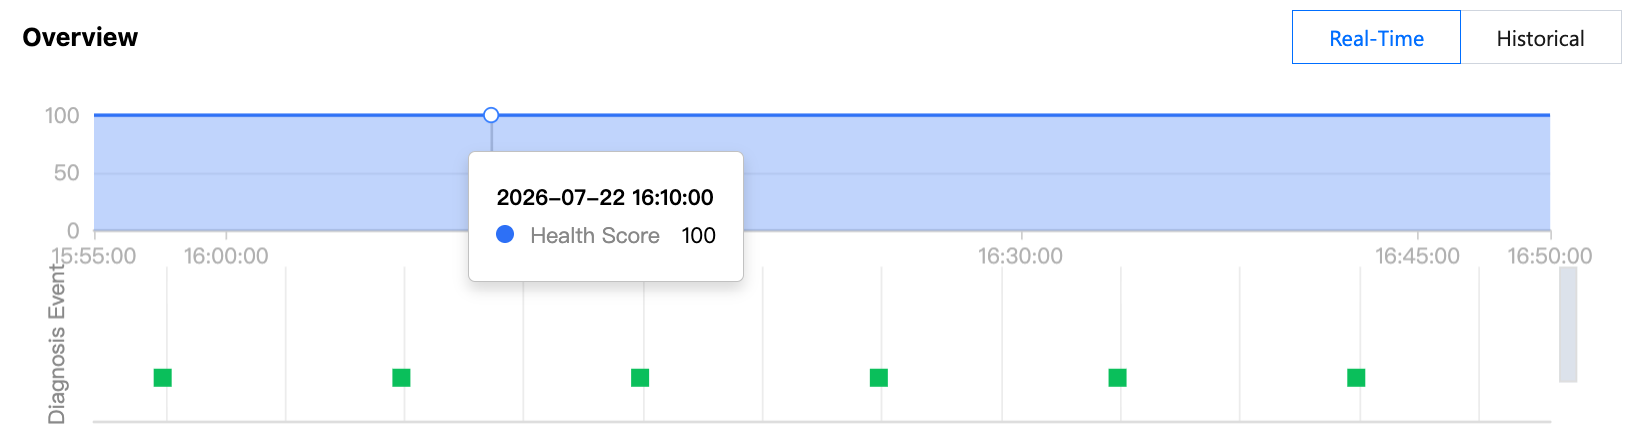
Click any time point on the trend chart to display the health score at that time point.
Viewing the diagnosis event bar chart
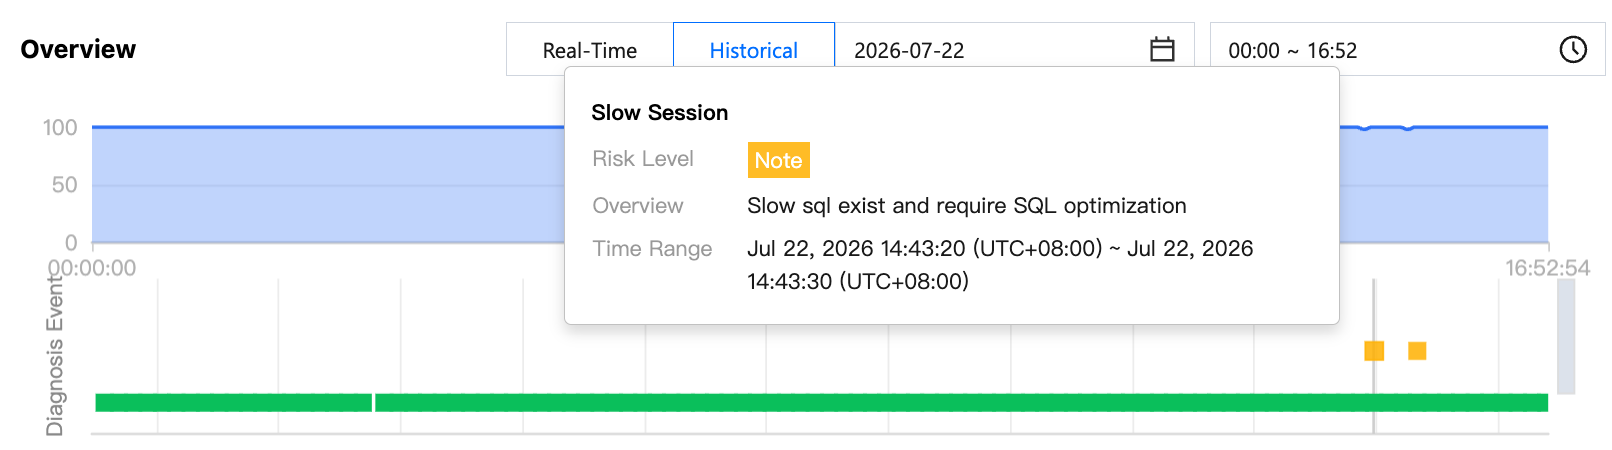
Hover the cursor over the diagnosis event bar chart to display information such as risk level, overview, and start/end time. Click the bar chart to go to the event details page to view information such as event details, description, intelligent analysis, and optimization suggestions. For more information about how to view event details, see Exception Alarms.
Hover the cursor over the diagnosis event timeline and scroll the mouse wheel up/down to zoom in/out on the timeline range.
Viewreal-time/historical SQL trend charts and real-time/historical slow SQL trend charts
Real-time/Historical SQL: View trends of write requests, read requests, and total requests.
Real-time/Historical Slow SQL: View the correlation curve between the number of slow SQL and CPU utilization.
If slow SQL and the CPU curve rise simultaneously, it indicates that slow queries may be the primary cause of consumption of CPU resources.
Viewing the Diagnostic Prompts
Diagnosis events are categorized into Healthy, Note, Alarm, Serious, and Critical levels. DBbrain performs regular health inspections on instances every 10 minutes.
1. Log in to the DBbrain console.
2. In the left sidebar, select Performance Optimization.
3. Select the PostgreSQL database type and instance ID at the top, then choose the Exception Diagnosis tab.
4. On the right side of the page, select to view real-time or historical diagnosis information.
Real-time: Select Real-time to display the risk distribution and diagnosis details for the last three hours.
Historical: Select Historical to display the risk distribution and diagnosis details for the selected time period.
5. View the diagnostic prompts for the selected time range.
View Risk Distribution
View the proportion of events at each level: Critical, Serious, Alarm, and Note.
Viewing the diagnosis event details
In the Diagnosis Details section, click the row of a specific event alarm, or hover the cursor over the event alarm and click View to go to the event details page and view the event details.
Event details mainly include event details, description, intelligent analysis, and optimization suggestions. The event details displayed vary depending on the diagnosis type. The details actually displayed shall prevail.
Event details: includes information such as diagnosis item, start/end time, risk level, and overview.
AI Insights: Display insights results for each node.
Description: includes information such as problem snapshots and performance trends of the exception or health inspection event.
Optimization suggestion: providing optimization suggestions for exception diagnosis events.
Ignoring or unignoring an alarm
Note:
This feature is only applicable to exception alarms for diagnostic items that are not Health Inspections.
In the Diagnosis Details section, hover the cursor over an event alarm, click Ignore, and select Ignore This Item or Ignore This Type, and then click OK.
Ignore This Item: ignores only this specific alarm.
Ignore This Type: ignores exception alarms caused by the same root cause.
Ignored diagnosis events will be displayed in gray.
To unignore, click Unignore and then click OK.
To display ignored alarms, select Show Ignored item.
Click Manage to view ignored content and ignored types.
You can go to the event details page and click Ignore or Unignore in the upper-right corner.
Detailed Description of Diagnosis Items
Diagnosis items are the objects for intelligent diagnosis. Their types include performance, availability, reliability, and maintainability. Each diagnosis item belongs to only one type.
Diagnosis Item Name | Diagnosis Item Type | Description | Risk level classification |
Slow Session | Performance | There are slow sessions that are still running and have not completed. | Note |
Dead lock | Reliability | Database deadlocks | Critical |
Disk space utilization | Reliability | Excessively high disk utilization | Critical: 95 < Disk utilization Severe: 90 < Disk utilization ≤ 95% Warning: 85% < Disk utilization ≤ 90% Notice: 60% < Disk utilization ≤ 85% |
Memory utilization | Performance | Excessively high memory utilization | Critical: 100 < Memory utilization Severe: 95% < Memory utilization ≤ 100% Warning: 90% < Memory utilization ≤ 95% |
CPU utilization | Performance | Excessively high CPU utilization | Critical: 80% < CPU utilization Severe: 60% < CPU utilization ≤ 80% Warning: 40% < CPU utilization ≤ 60% |
Transaction not committed | Performance | Existence of uncommitted transactions for an excessively long time | Critical: 60s < transaction uncommitted time Severe: 30s < transaction uncommitted time ≤ 60s Alarm: transaction uncommitted time ≤ 30s |
Long transactions | Performance | Presence of long-running transactions | Critical: 60s < transaction duration Severe: 30s < transaction duration ≤ 60s |
Replication delay | Availability | Primary-secondary replication delay | Severe: 600s < delay time Alarm: delay time ≤ 600s |
Help and Support
Was this page helpful?
You can also Contact sales or Submit a Ticket for help.
Help us improve! Rate your documentation experience in 5 mins.
Feedback