Query Performance Test
Download
Focus Mode
Font Size
Test Objective
This document aims to evaluate the query throughput (QPS) and response latency performance of the database by adjusting concurrent pressure.
Performance Metrics
Metric Name | Description | Calculation Formula/Unit |
QPS | Number of completed queries per second | Total queries/Total time (s) |
Average Latency | Average response time of all query requests | Total time (ms)/Total queries |
Minimum Latency | Shortest response time among all query requests | Millisecond (ms) |
Maximum Latency | Longest response time among all query requests | Millisecond (ms) |
Test Query Types
Query Type | Query Scope |
single-groupby-1-1-1 | For a single metric on one host, perform a MAX aggregation every 5 minutes over a period of 1 hour. |
single-groupby-1-8-1 | For a single metric on 8 hosts, perform a MAX aggregation every 5 minutes over a period of 1 hour. |
single-groupby-5-1-1 | For one host, collect 5 metrics and perform a MAX aggregation every 5 minutes over a period of 1 hour. |
cpu-max-all-1 | Perform a MAX aggregation on all CPU metrics of a single host within 1 hour. |
Test Procedure
1. Use the tsbs_generate_queries command to specify the query type and generate query packages. The following example uses the single-groupby-1-1-1 query type:
./tsbs_generate_queries --use-case="cpu-only" --seed=123 --scale=10000 \\--timestamp-start="2025-01-01T00:00:00Z" \\--timestamp-end="2025-01-01T1:00:01Z" \\ # Query data for a 1-hour period.--queries=100000 \\ # Generate 100,000 queries.--query-type="single-groupby-1-1-1" \\ # The query type.--format="influx" \\| gzip > query/influx-100000queries-single-groupby-1-1-1-12h.gz
2. Based on the query request (influx-100000queries-single-groupby-1-1-1-12h.gz) generated in the previous step, use tsbs_run_queries_influx to query the time series database. The following example uses a concurrency of 320:
cat query/influx-100000queries-single-groupby-1-1-1-12h.gz | gunzip | ./tsbs_run_queries_influx \\--urls=http://XX.XX.XX.XX:8086 \\ # The CTSDB 3.0 cluster address.--workers=320 \\ # Set the number of concurrent workers to 320.--db-name=tsbs_test \\ # The database to query.--print-interval 10000 # Print the progress every 10,000 queries.
Test Results
Query Performance of single-groupby-1-1-1
For a single metric on one host, perform a MAX aggregation every 5 minutes over a period of 1 hour.
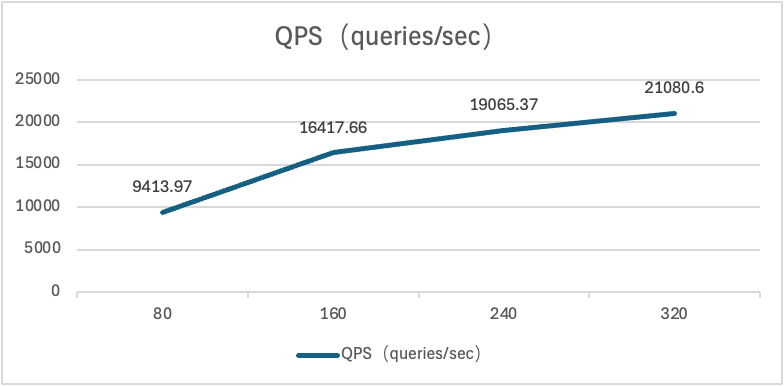
Test Concurrency | QPS | Minimum Latency (ms) | Average Latency (ms) | Maximum Latency (ms) |
80 | 9413.97 | 6.56 | 8.48 | 61.98 |
160 | 16417.66 | 6.62 | 9.70 | 58.04 |
240 | 19065.37 | 7.71 | 12.52 | 84.77 |
320 | 21080.60 | 7.08 | 15.09 | 82.44 |
Query Performance of single-groupby-1-8-1
For a single metric on 8 hosts, perform a MAX aggregation every 5 minutes over a period of 1 hour.
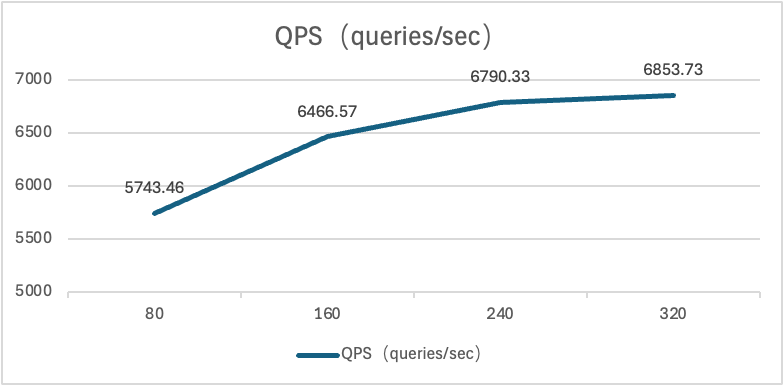
Test Concurrency | QPS | Minimum Latency (ms) | Average Latency (ms) | Maximum Latency (ms) |
80 | 5743.46 | 7.71 | 13.86 | 41.36 |
160 | 6466.57 | 9.58 | 24.58 | 101.25 |
240 | 6790.33 | 10.09 | 35.11 | 97.95 |
320 | 6853.73 | 11.96 | 46.37 | 140.94 |
Query Performance of single-groupby-5-1-1
For one host, collect 5 metrics and perform a MAX aggregation every 5 minutes over a period of 1 hour.
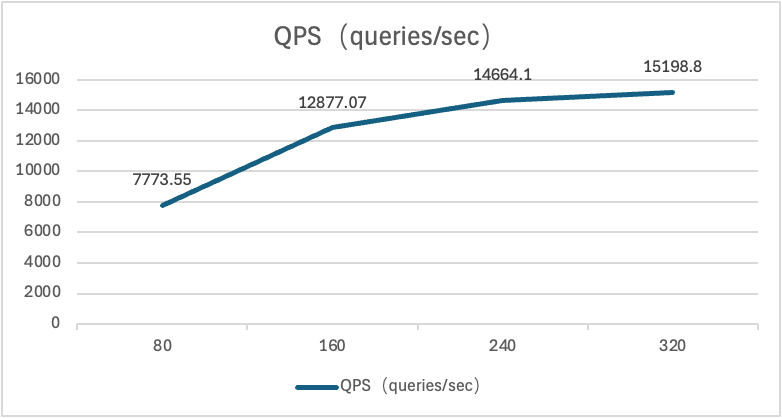
Test Concurrency | QPS | Minimum Latency (ms) | Average Latency (ms) | Maximum Latency (ms) |
80 | 7773.55 | 7.47 | 10.21 | 63.98 |
160 | 12877.07 | 8.34 | 12.29 | 47.08 |
240 | 14664.10 | 8.89 | 16.15 | 77.00 |
320 | 15198.80 | 8.91 | 20.77 | 71.86 |
Query Performance of cpu-max-all-1
Perform a MAX aggregation on all CPU metrics of a single host within 1 hour.
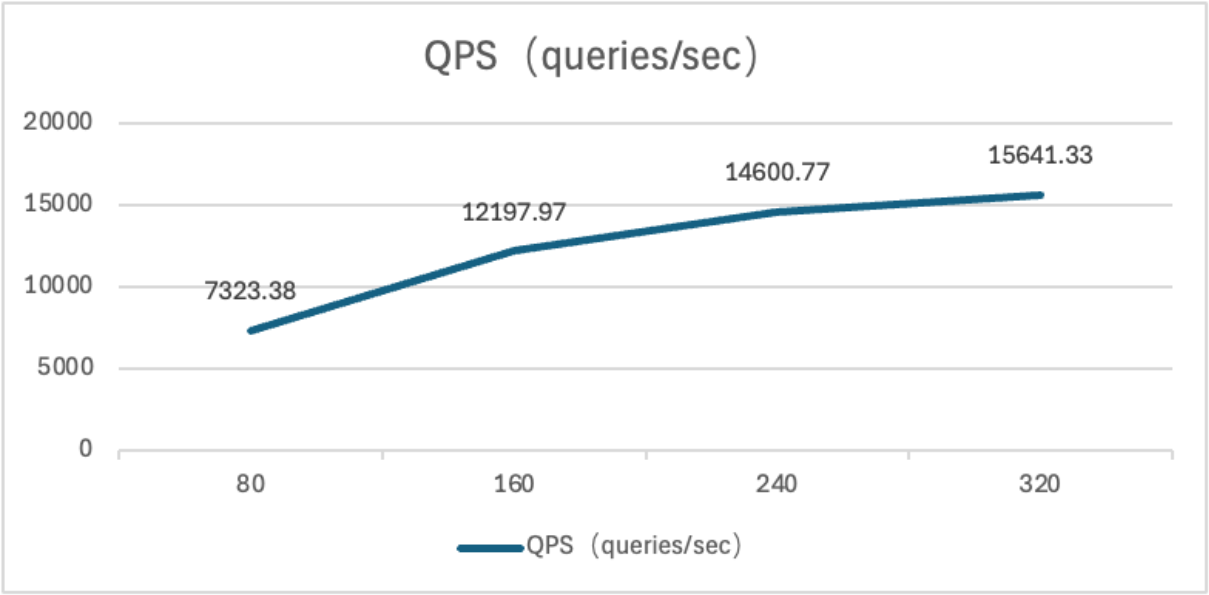
Test Concurrency | QPS | Minimum Latency (ms) | Average Latency (ms) | Maximum Latency (ms) |
80 | 7323.38 | 8.31 | 10.86 | 39.25 |
160 | 12197.97 | 9.48 | 12.98 | 56.18 |
240 | 14600.77 | 10.11 | 16.23 | 105.48 |
320 | 15641.33 | 10.62 | 20.16 | 99.38 |
Help and Support
Was this page helpful?
You can also Contact sales or Submit a Ticket for help.
Help us improve! Rate your documentation experience in 5 mins.
Feedback