Query Messages
Download
Focus Mode
Font Size
Scenarios
If message sending and receiving are abnormal or messages are missing, you can use the message query feature in the TDMQ for RabbitMQ console to view the message content and message trace of specified vhosts and queues, facilitating analysis and issue localization.
Use Instructions
Depending on the cluster type, the restrictions and query methods for the message query feature may vary. You can click the tabs below to view the corresponding instructions.
Prerequisites
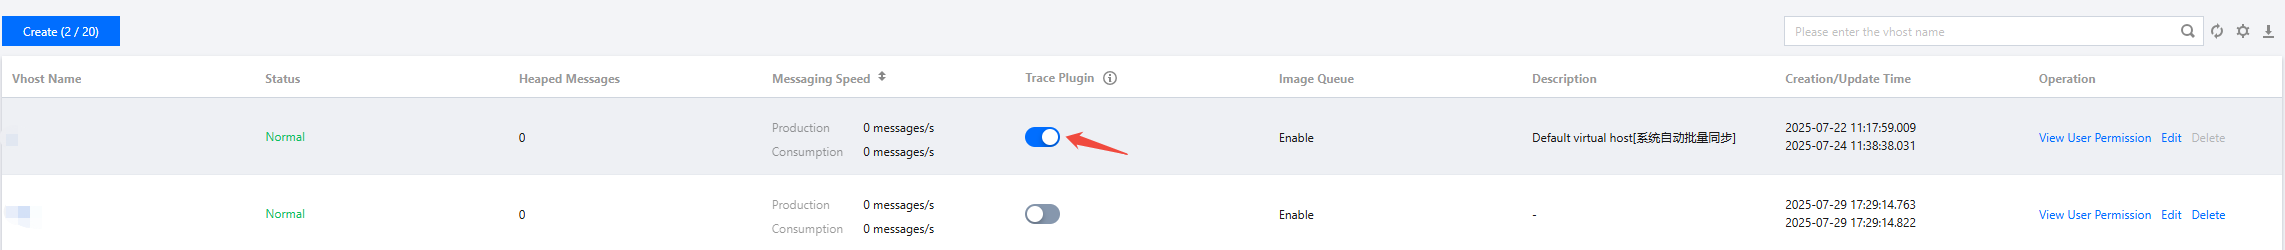
The Trace plugin has been enabled for the vhost that requires querying messages.
Overview of How It Works
After the Trace plugin is enabled for a vhost, the service component will consume trace messages from the corresponding RabbitMQ cluster. After the messages are processed, the message trace query feature can be achieved in the console.
Use Limits
Message trace relies on the service component to consume trace messages. Since the service component is an underlying public service, it cannot guarantee that trace messages from high-traffic RabbitMQ clusters will be consumed promptly. If a backlog of trace messages occurs, issues such as high memory load in the cluster may arise, thus affecting the stability of the RabbitMQ cluster.
Therefore, it is recommended not to enable the Trace plugin in production environments, especially in scenarios where the entire cluster (including all vhosts) has a TPS exceeding 10000. The Trace plugin is recommended for low-traffic verification/troubleshooting scenarios.
Note:
Message query only supports querying messages below 512 KB in size.
Different query methods and limitations are shown in the table below. It is recommended to use the recommended query method to obtain more accurate results.
Query Method | Example | Limitation |
Query only by time range + queue | 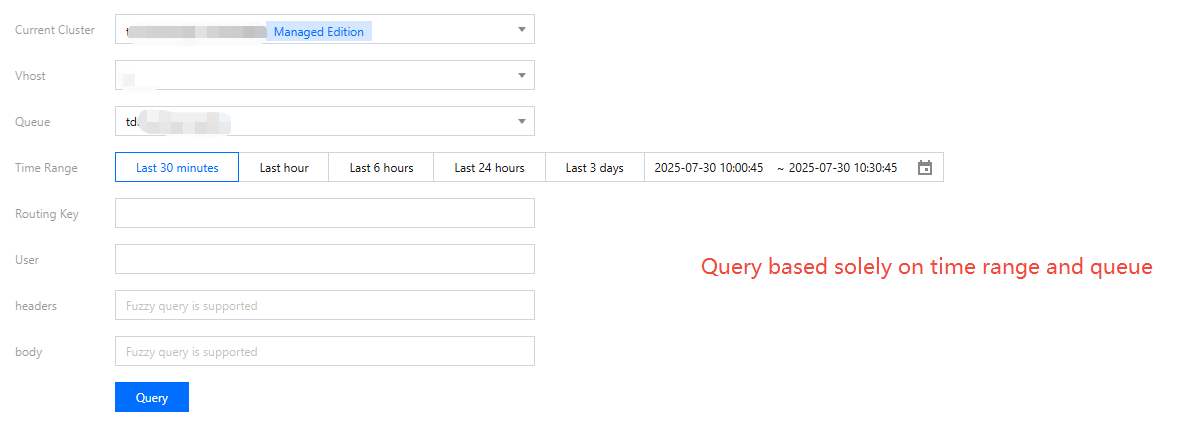 | Within the selected queue and time range, up to 1000 messages can be queried in the order they entered the queue. |
Query by Routing Key (recommended) | 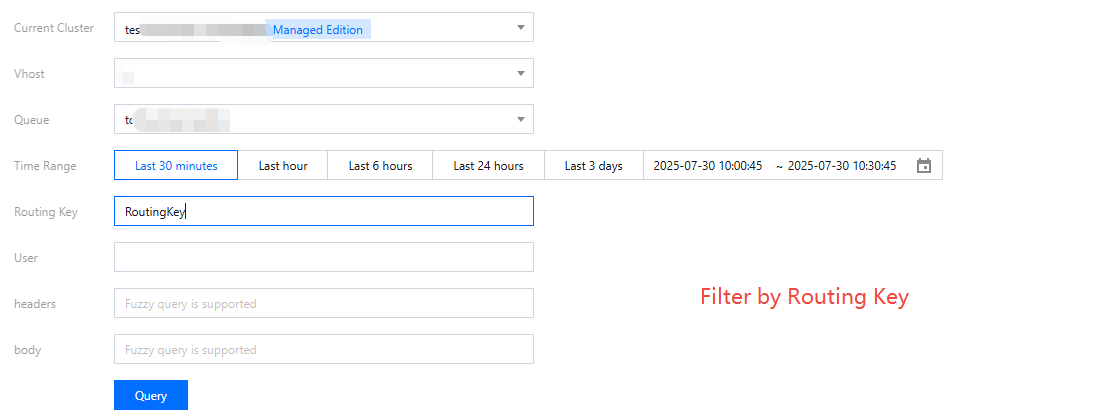 | Within the selected queue and time range, up to 1000 messages can be queried by Routing Key. |
Query by Routing Key and user/headers/body | 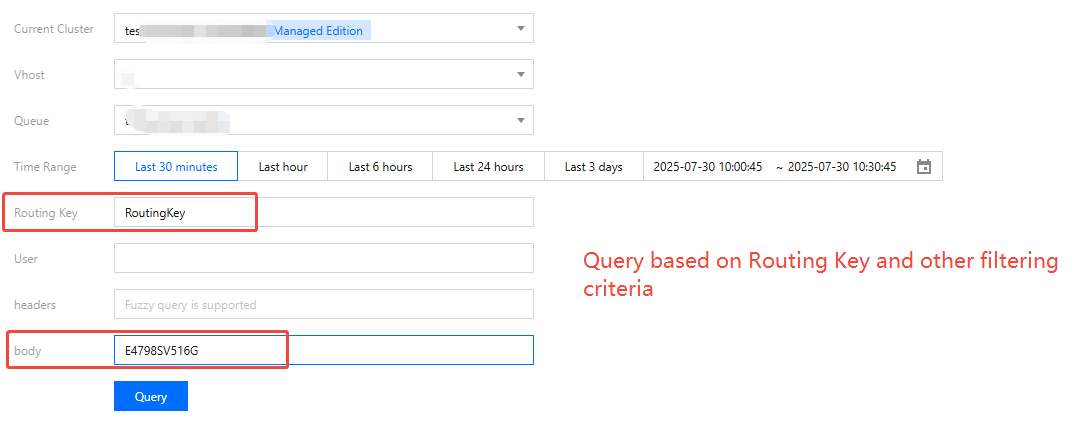 | Within the selected queue and time range, up to 1000 messages can be queried by Routing Key. After they are filtered by user/headers/body, the total number of messages finally obtained will be less than or equal to 1000. |
Query only by time range + queue, with Routing Key left empty and with messages filtered by user/headers/body (not recommended) | 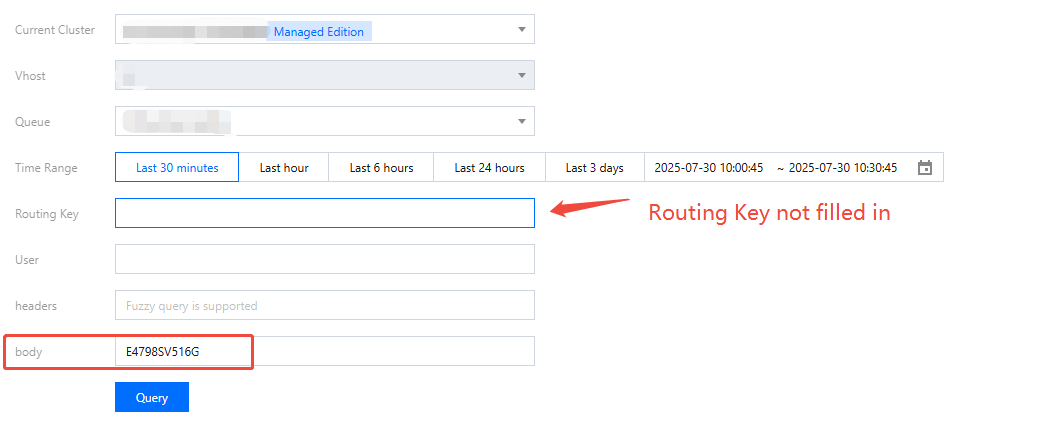 | Within the selected queue and time range, up to 1000 messages can be queried in the order they entered the queue. After they are filtered by user/headers/body, the total number of messages finally obtained will be less than or equal to 1000. |
Operation Steps
1. Log in to the TDMQ for RabbitMQ console.
2. In the left sidebar, select Querying Messages. Then, select a region and time range to query messages.
3. Select the cluster, vhost, queue, and time range for the query. You can enter the Routing Key, user, message headers, and body to further narrow down the query scope.
4. Click Query, and the query results are displayed in the list below.
5. Find the message whose content or detailed information you want to view, and click View Message Details in the Operation column to view the detailed information and content (message body) of the message.
Use Limits
The default message retention period for Serverless Edition is 3 days. Therefore, only messages from the last 3 days can be queried.
Operation Steps
1. Log in to the TDMQ for RabbitMQ console.
2. In the left sidebar, select Querying Messages. Select a region and set a cluster, vhost, queue, and time range for the query. You can also enter the message ID to further narrow down the query scope.
3. Click Query, and the query results are displayed in the list below.
4. Find the message whose content or detailed information you want to view, and click View Message Details in the Operation column to view the detailed information and content (message body) of the message.
Help and Support
Was this page helpful?
You can also Contact sales or Submit a Ticket for help.
Help us improve! Rate your documentation experience in 5 mins.
Feedback