- Product Introduction
- Purchase Guide
- Getting Started
- Operation Guide
- Best Practice
- Integration Guide
- Scrape Configuration Description
- Custom Monitoring
- EMR Integration
- Java Application Integration
- Go Application Integration
- Exporter Integration
- Elasticsearch Exporter Integration
- Kafka Exporter Integration
- MongoDB Exporter Integration
- PostgreSQL Exporter Integration
- NGINX Exporter Integration
- Redis Exporter Integration
- MySQL Exporter Integration
- Consul Exporter Integration
- Memcached Exporter Integration
- Integration with Other Exporters
- CVM Node Exporter
- Health Check
- Cloud Monitoring
- Read Cloud-Hosted Prometheus Instance Data via Remote Read
- FAQs
- Service Agreement
- TMP Policy
Scrape Task Status
Last updated: 2021-12-15 18:00:52
This document is currently invalid. Please refer to the documentation page of the product.
You can easily view the running status of Prometheus scrape tasks to check whether the monitoring data is normally scraped by the Prometheus agent in real time.
Preparations
- The Prometheus agent has been installed in the TKE cluster. For more information, please see Agent Management.
- Click a Cluster ID in the TKE cluster list to enter the Integrate with TKE page.
Description
- If the status of a scrape task is not found, the Prometheus agent has not correctly obtained the configuration of the corresponding scrape task. Please check whether the configuration is correct.
- The red value indicates the number of scrape tasks that failed under this task. You can expand them to view the specific failure causes.
Directions
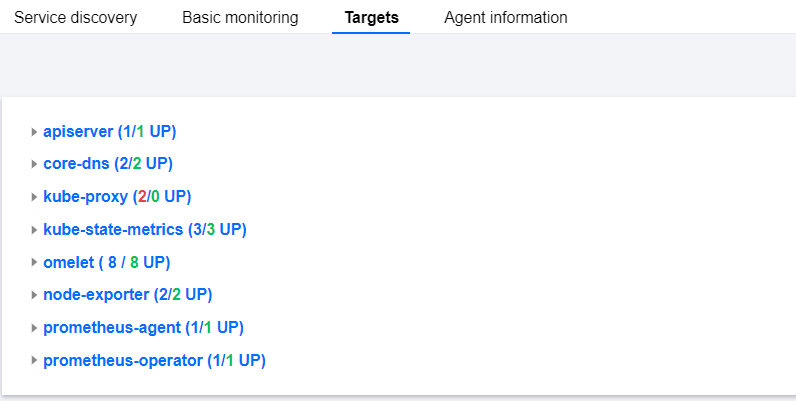
- Click Targets on the Integrate with TKE page to view all scrape tasks of the current Prometheus agent and the failure causes as shown below:

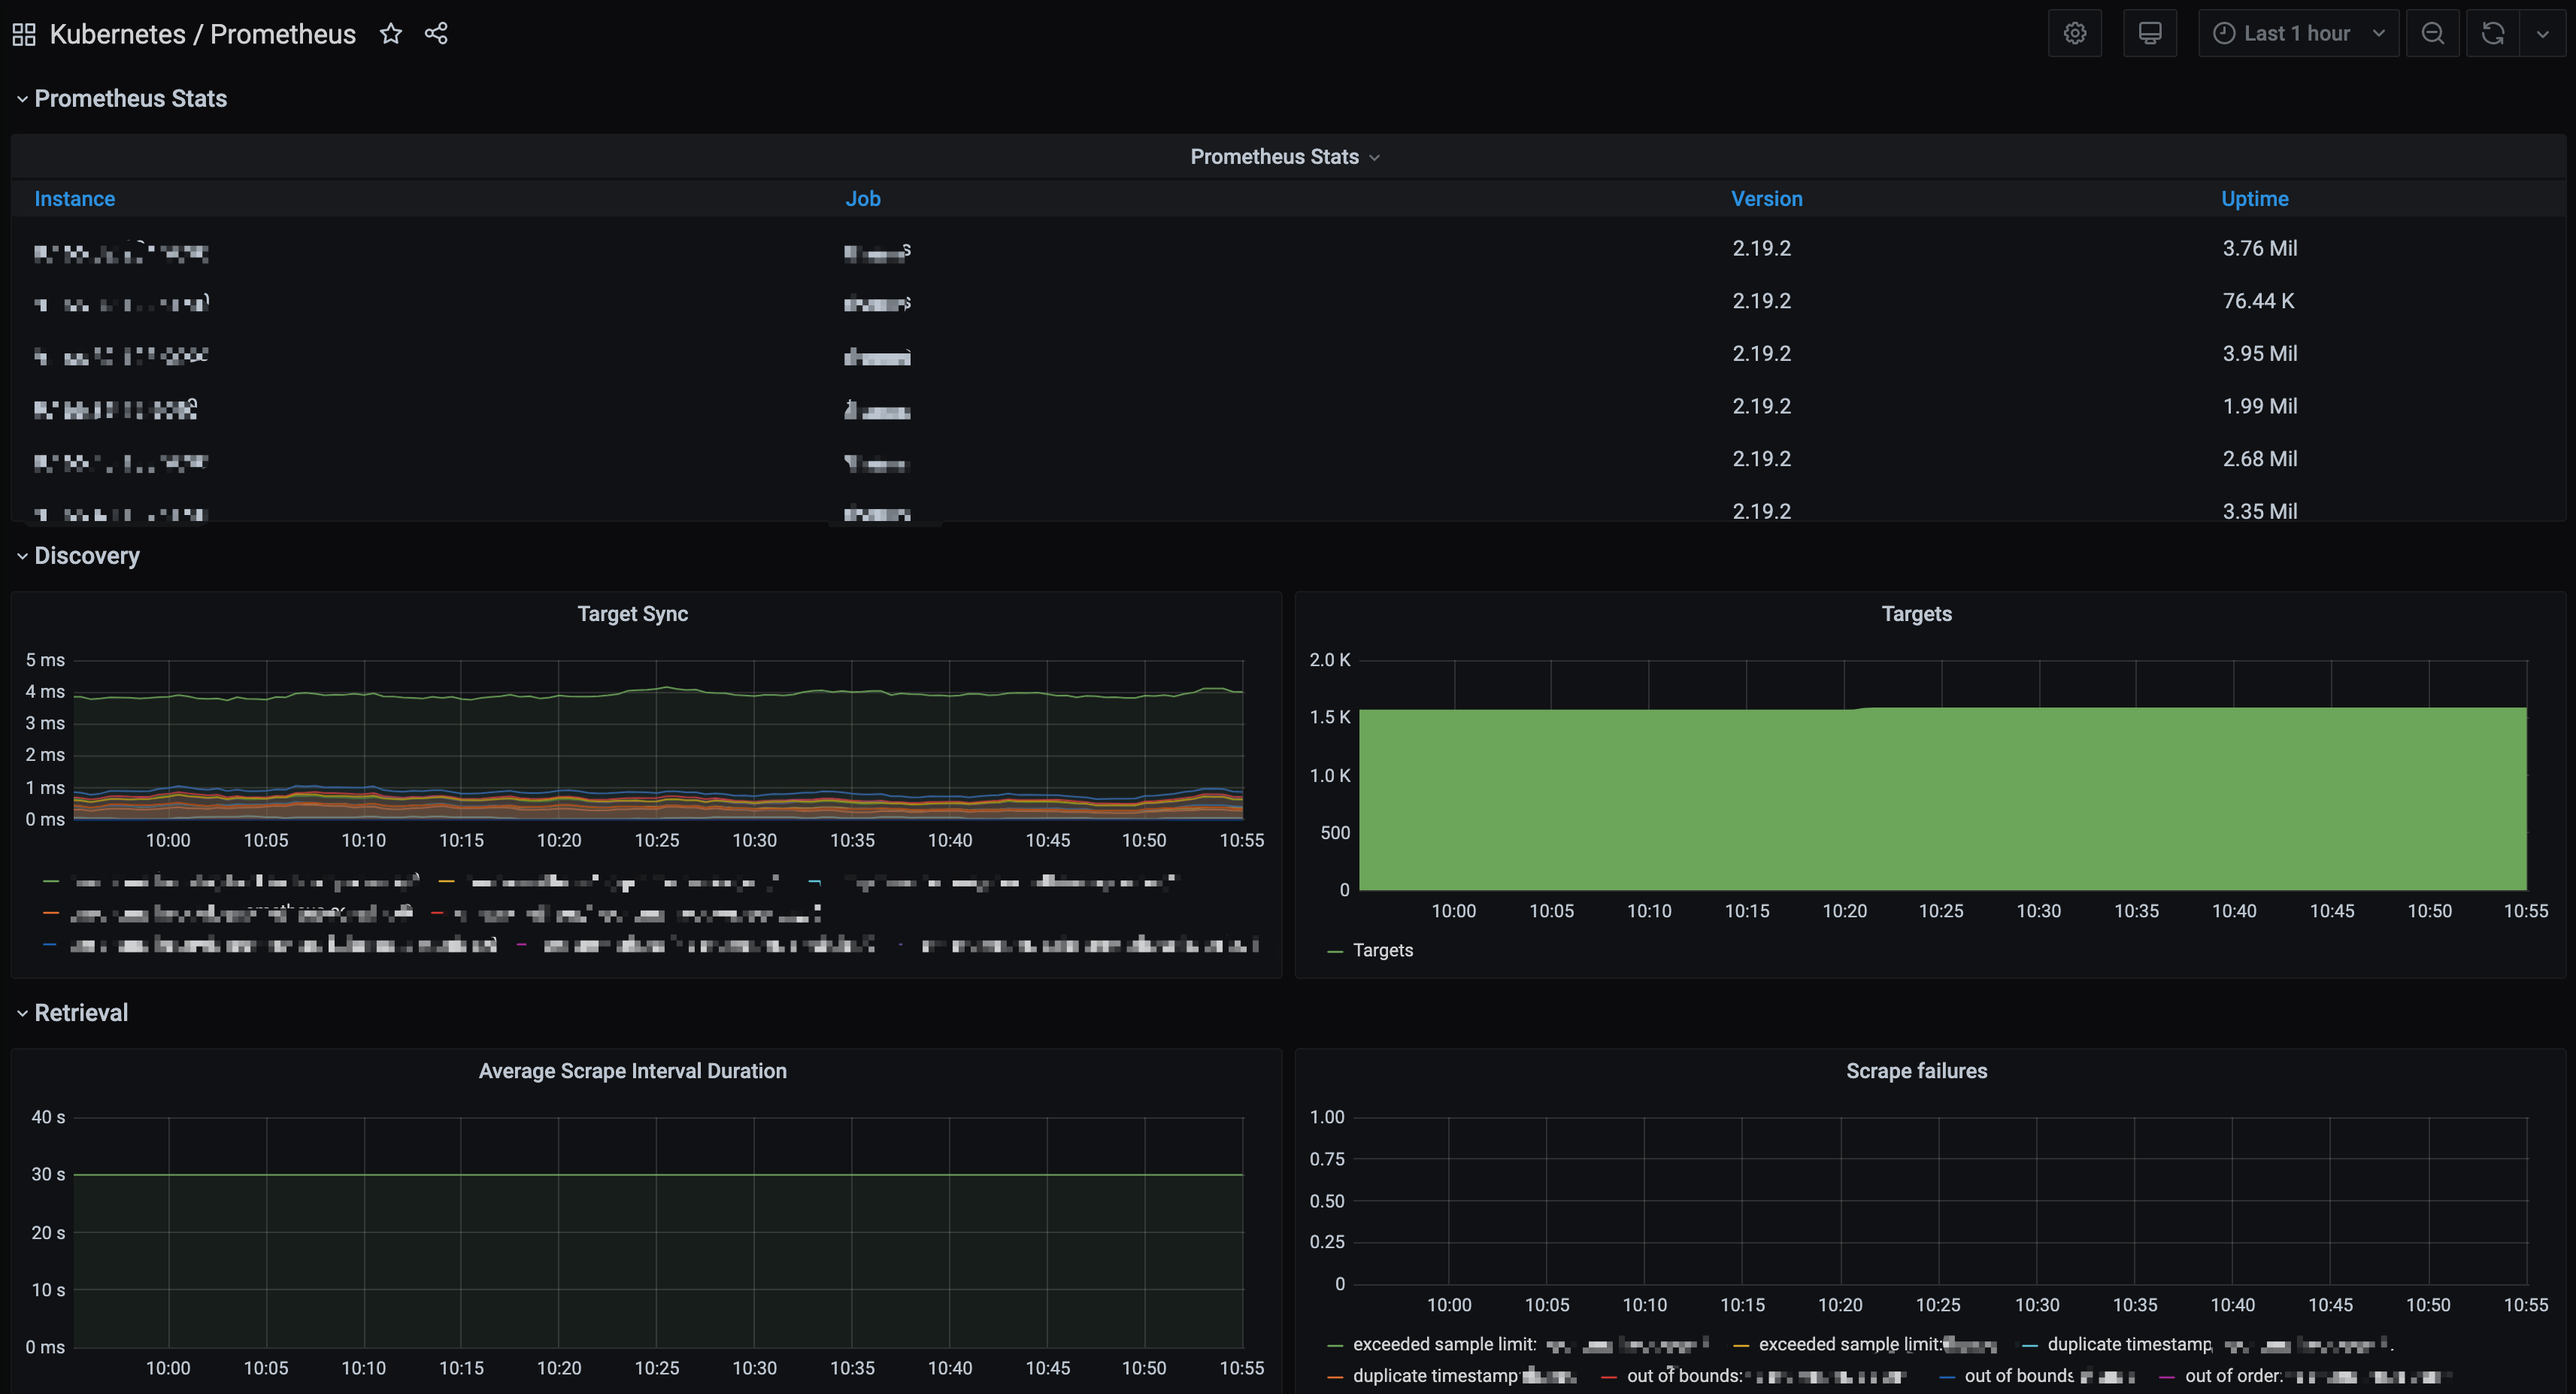
- You can also view the more detailed monitoring status of scrape tasks through the Grafana service provided by TMP. To do so, open Grafana to view the preset Prometheus dashboard as shown below:

 Yes
Yes
 No
No
Was this page helpful?