When using Elasticsearch, you need to monitor its running status, such as cluster and index status. TMP provides an exporter to monitor Elasticsearch and offers an out-of-the-box Grafana monitoring dashboard for it. This document describes how to deploy the Elasticsearch exporter and integrate it with the alert feature.
Note:
If the ElasticSearch to be monitored is Tencent Cloud ElasticSearch Service, Cloud Monitor Integration in the integration center is recommended for use, supporting one-click collection of cloud product metrics.
Access Method
Method One: One-Click Installation (Recommended)
Prerequisites
The Prometheus instance resides in a VPC that is connected to the ElasticSearch network.
2. Select and enter the corresponding Prometheus instance from the instance list.
3. On the instance details page, select Data Collection > Integration Center.
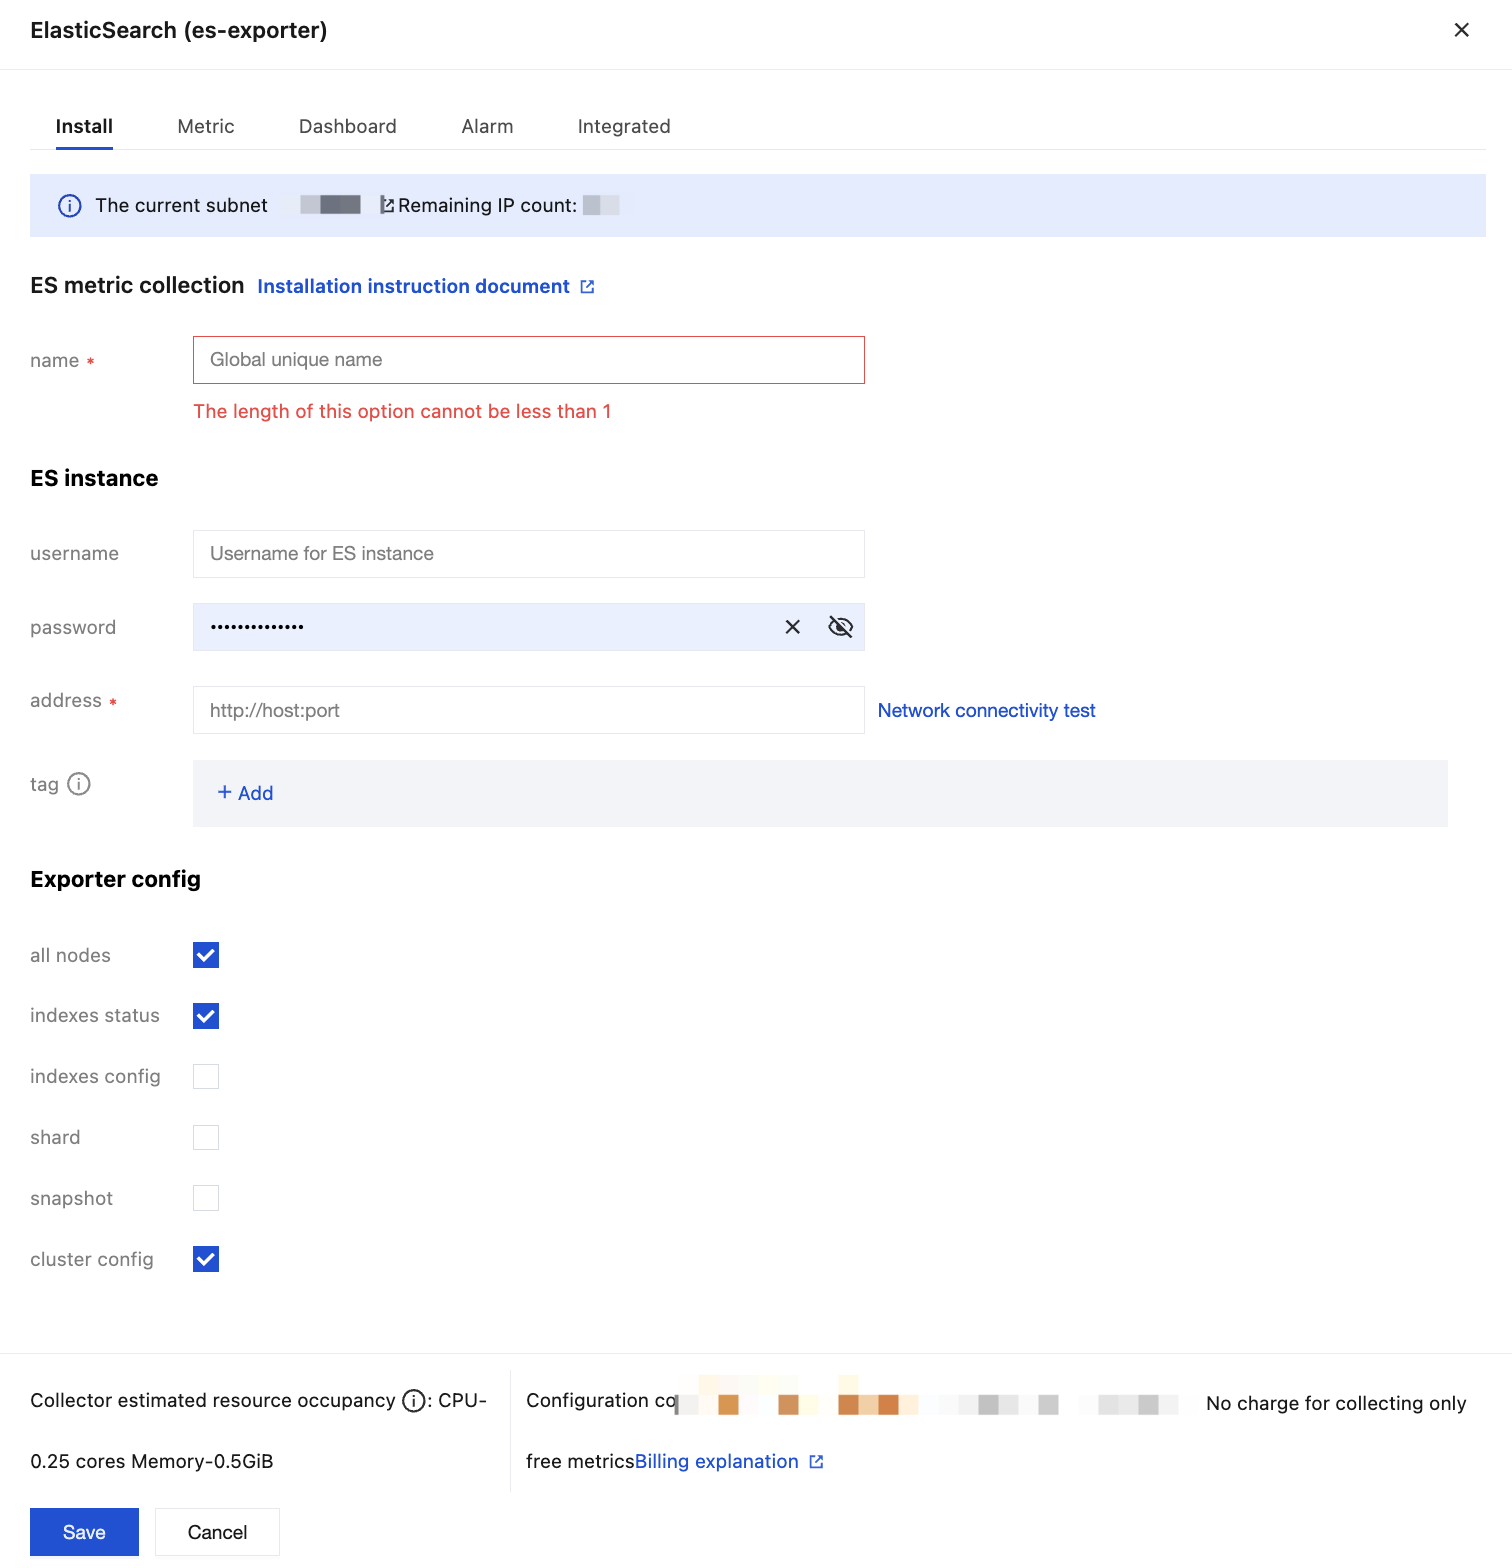
4. In the Integration Center, locate and click ElasticSearch to pop up an installation window. On the installation page, enter details such as the metric collection name and address, then click save.
Configuration Description
Parameter
Description
name
Exporter name, which should meet the following requirements:
The name should be unique.
The name should conform to the following regular expression: '^[a-z0-9]([-a-z0-9]*[a-z0-9])?(\\.[a-z0-9]([-a-z0-9]*[a-z0-9])?)*$'.
username
Username for ElasticSearch.
password
Password for ElasticSearch.
address
Connection address for ElasticSearch.
tag
Custom labels for metrics.
Exporter config
all nodes: Check to query statistical information of all nodes in a cluster. Uncheck to query only connected nodes.
indexes status: Check to query index statistics of all in a cluster.
indexes config: Check to query statistical information of all index configurations in a cluster.
shard: Check to query index statistics of all in a cluster, including shard level statistics (equivalent to checking index status).
snapshot: Check to query cluster snapshot statistics.
cluster config: Check to query cluster configuration statistics.
Method 2: Custom Installation
Note:
TKE is recommended for convenient installation and management of the Exporter.
Prerequisites
Before performing the operation, confirm that the following conditions are met:
In the TMP console, select and enter the corresponding Prometheus instance, then choose Data Collection > Integrate with TKE to locate the corresponding container cluster and complete the cluster association. For more details, see the guide Associating Clusters.
3. Click the ID/name of the cluster whose access credential you want to get to enter the cluster management page.
4. Use Secret management for ElasticSearch connection strings.
Note:
The Elasticsearch connection string is in the format of <proto>://<user>:<password>@<host>:<port>, such as http://admin:pass@localhost:9200.
4.1 Select Workload > Deployment to enter the Deployment page.
4.2 In the top-right corner of the page, click Create via YAML to create a YAML configuration as detailed below.
You can use Kubernetes Secrets to manage and encrypt passwords. When starting the Elasticsearch exporter, you can directly use the Secret key but need to adjust the corresponding URI. Below is a sample YAML configuration:
apiVersion: v1
kind: Secret
metadata:
name: es-secret-test
namespace: es-demo
type: Opaque
stringData:
esURI: you-guess # Corresponding Elasticsearch URI
5. Deploy ElasticSearch Exporter.
On the Deployment management page, click Create and select the target namespace to deploy the service. You can create in the console. Here, YAML is used to deploy the exporter. Below is a sample YAML configuration:
apiVersion: apps/v1
kind: Deployment
metadata:
labels:
k8s-app: es-exporter # Adjust to the corresponding name based on business requirements
name: es-exporter # Adjust to the corresponding name based on business requirements
namespace: es-demo
spec:
replicas:1
selector:
matchLabels:
k8s-app: es-exporter # Adjust to the corresponding name based on business requirements
template:
metadata:
labels:
k8s-app: es-exporter # Adjust to the corresponding name based on business requirements
spec:
containers:
-env:
-name: ES_URI
valueFrom:
secretKeyRef:
name: es-secret-test # Corresponds to the name of the Secret in the previous step
key: esURI # Corresponds to the Secret Key in the previous step
The above sample uses ES_ALL to collect all monitoring metrics of Elasticsearch, which can be adjusted through the corresponding parameters. For detailed exporter parameters, please refer to elasticsearch_exporter.
6. Verify.
6.1 Click the Deployment created in the previous step on the Deployment page to go to the Deployment management page.
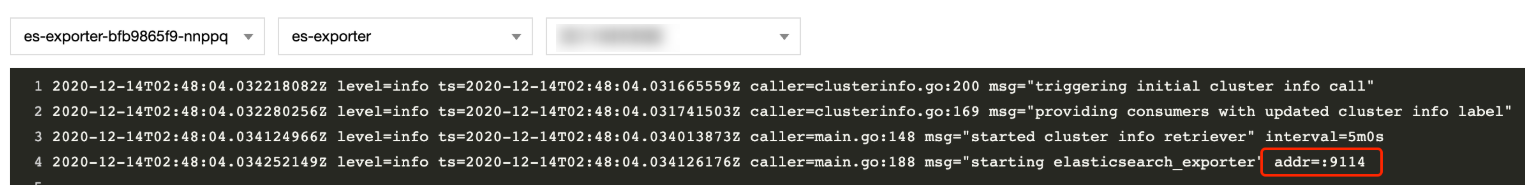
6.2 Click the Log tab, and you can see that the exporter is successfully started and its address is exposed as shown below:
6.3 Click the Pod Management tab to enter the Pod page.
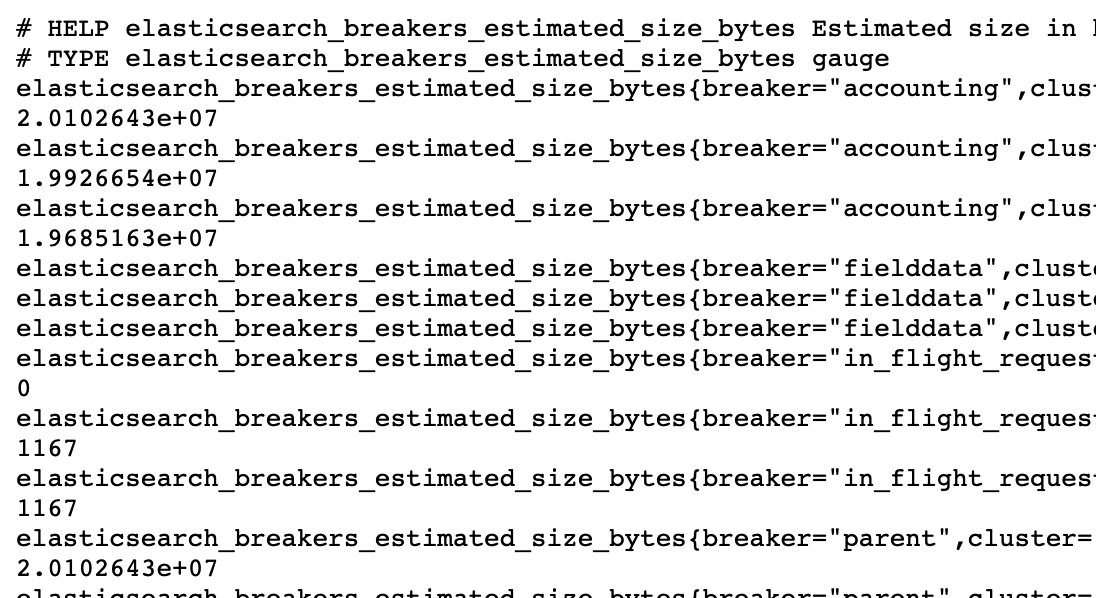
6.4 In the Operations column on the right, click Remote Login to log in to the Pod. Run the following curl command with the address exposed by the exporter in the command line window, and you can get the corresponding Elasticsearch metrics normally. If no corresponding data is returned, please check whether the connection string is correct as shown below:
curl localhost:9114/metrics
The execution result is as follows:
Step 2: Adding a Collection Task
1. Log in to the TMP console and select the corresponding Prometheus instance to go to the management page.
2. In Data Collection > Integrate with TKE, select the associated cluster, and choose Data Collection Configuration > Customize Monitoring Configuration > Via YAML to add a collection task.
3. Add a PodMonitor via service discovery to define the collection task. The YAML example is as follows:
apiVersion: monitoring.coreos.com/v1
kind: PodMonitor
metadata:
name: es-exporter # Enter a unique name
namespace: cm-prometheus # Pay-as-you-go instance: namespace of the cluster; Annual and monthly subscription instances (no longer available): namespace is fixed, do not change
spec:
namespaceSelector:
matchNames:
- es-demo
podMetricsEndpoints:
-interval: 30s
path: /metrics
port: metric-port
selector:
matchLabels:
k8s-app: es-exporter
Viewing Monitoring Data
Prerequisites
The Prometheus instance has been bound to a Grafana instance.
Operation Steps
1. Log in to the TMP console and select the corresponding Prometheus instance to go to the management page.
2. Select Data Collection > Integration Center to enter the Integration Center page. Find ElasticSearch Monitor, select Dashboard > Dashboard Operation > Install/Upgrade Dashboard, then click Install/Upgrade to install the corresponding Grafana Dashboard.
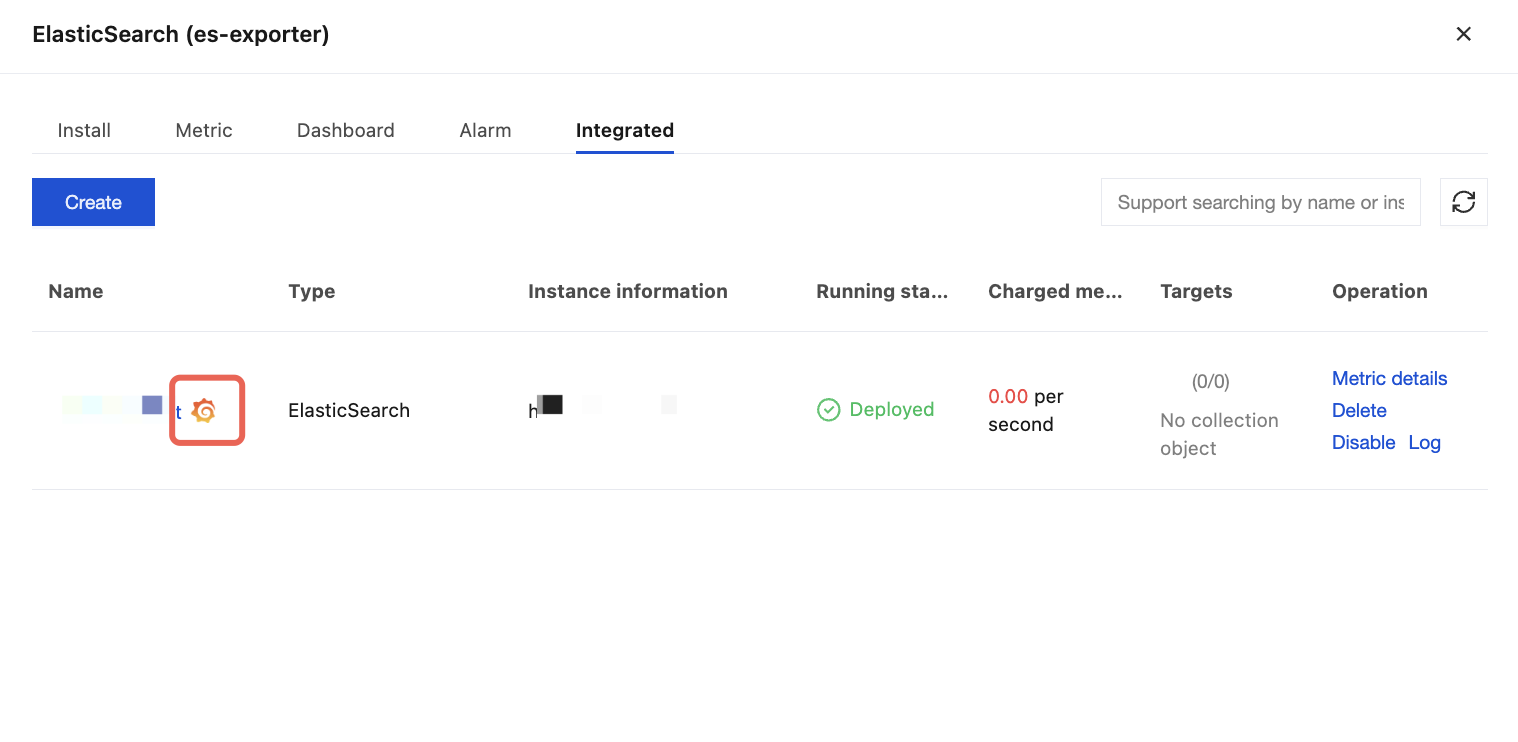
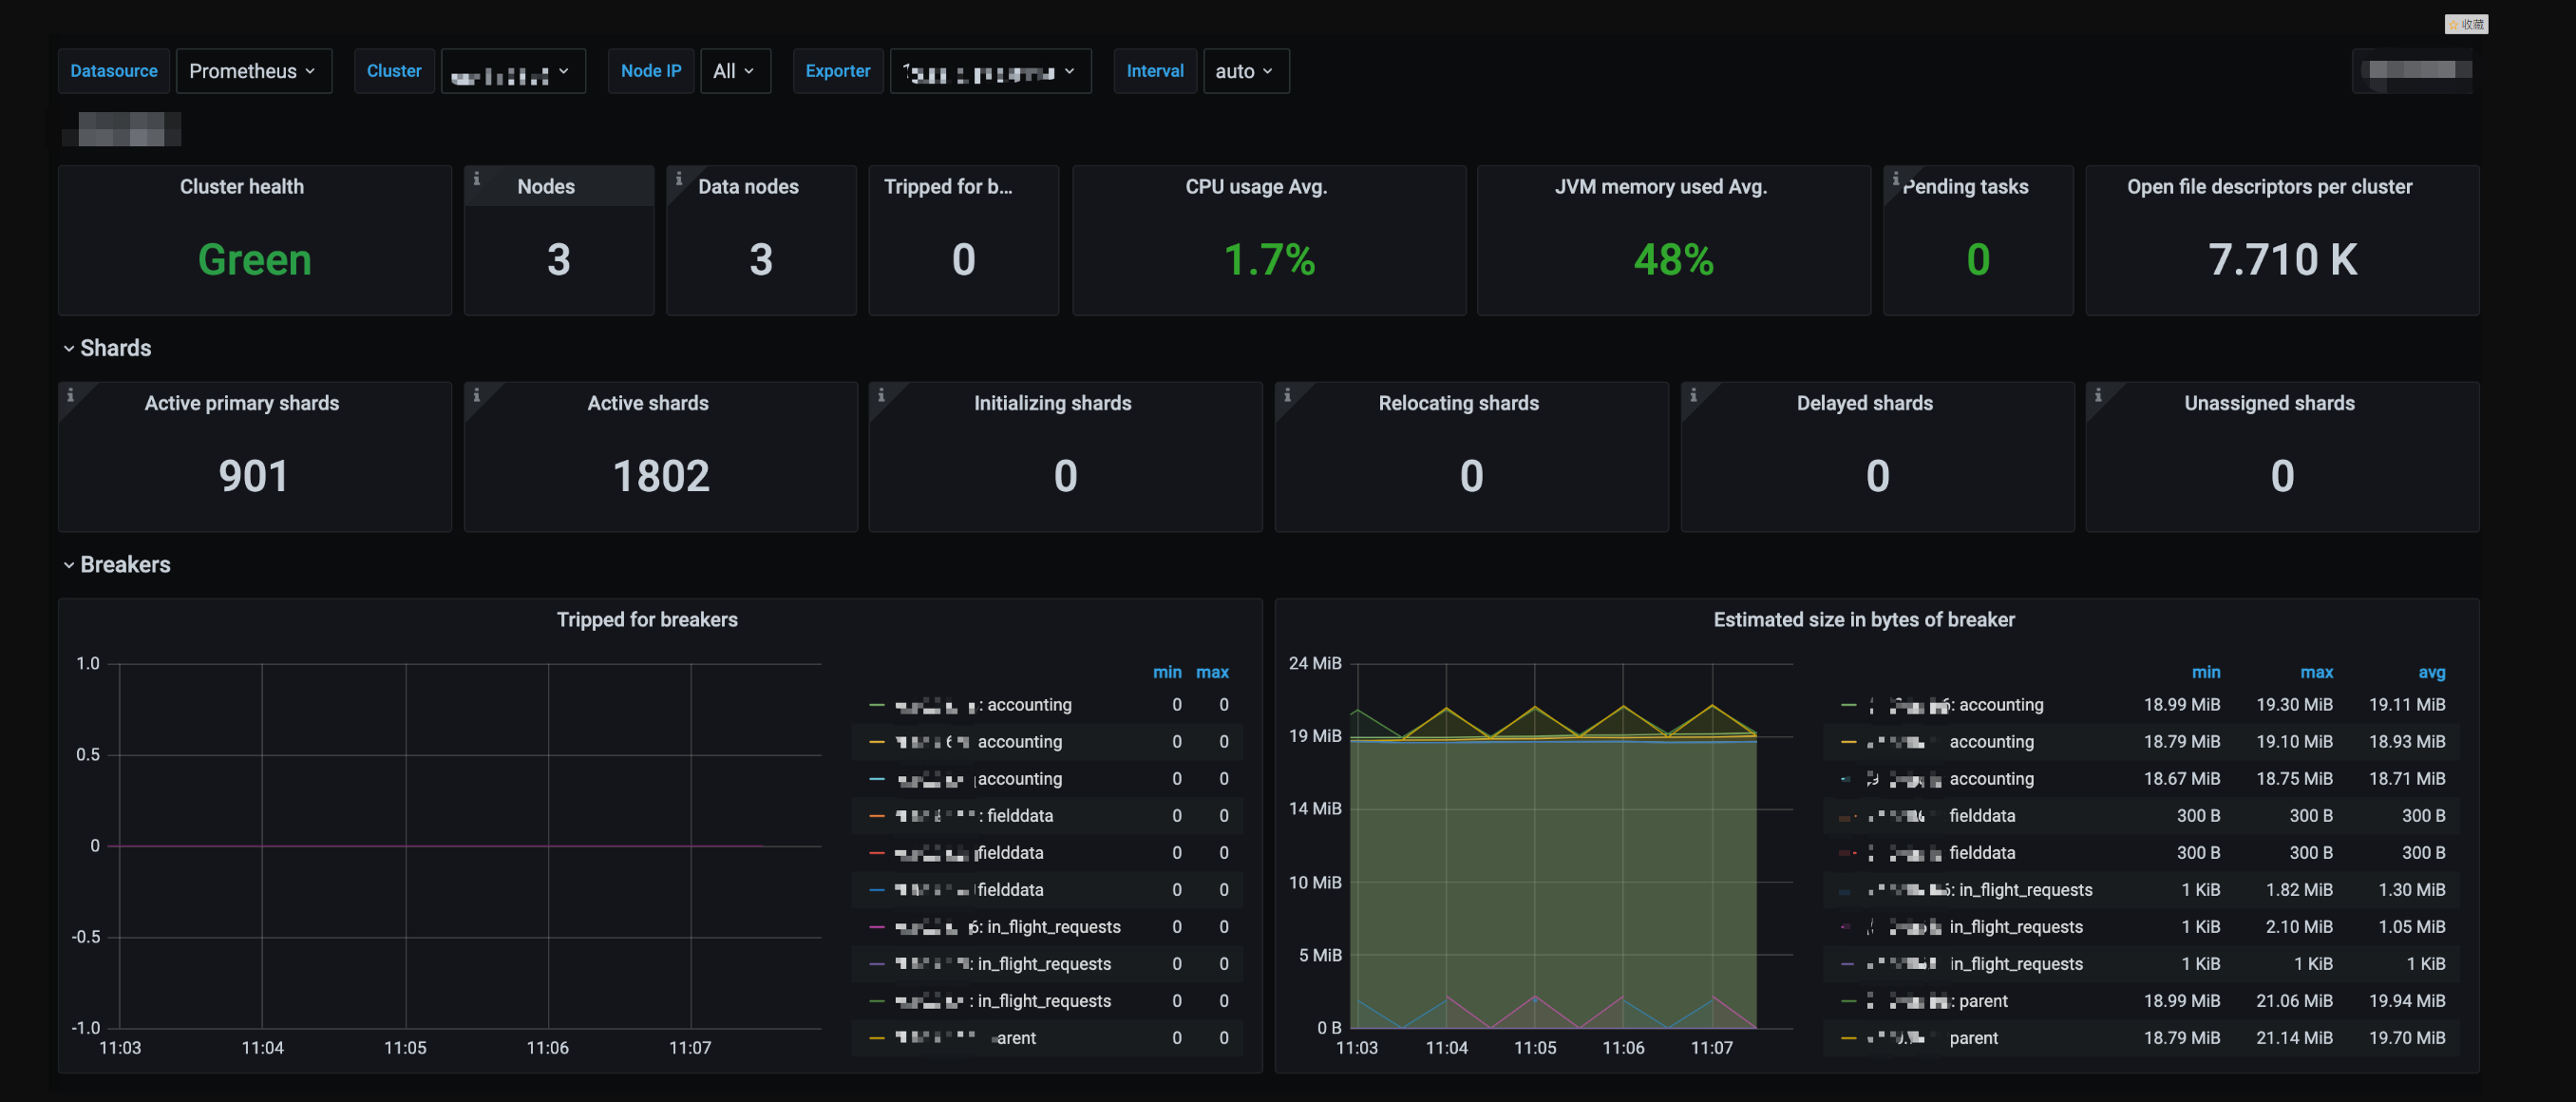
3. Select View Integrated. From the integrated list, click the Grafana icon to automatically open the Elasticsearch Monitoring Dashboard and view monitoring data related to the instance, as shown below:
Configuring Alarm
1. Log in to the TMP console and select the corresponding Prometheus instance to go to the management page.
2. Select Alarm Management > Alerting Rule, click Create Alerting Rule to add corresponding alarm policies. For details, see Creating Alarm Policy.