When using Redis, you need to monitor its running status to know whether it runs normally and troubleshoot its faults. TMP provides an exporter to monitor Redis and offers an out-of-the-box Grafana monitoring dashboard for it. This document describes how to use TMP to monitor Redis.
Note:
If the Redis to be monitored is Tencent Cloud TencentDB for Redis, it is recommended to use Cloud Monitor Integration in the Integration Center, which supports one-click collection of cloud product metrics.
2. Select the corresponding Prometheus instance from the instance list.
3. Go to the instance details page, and select Data Collection > Integration Center.
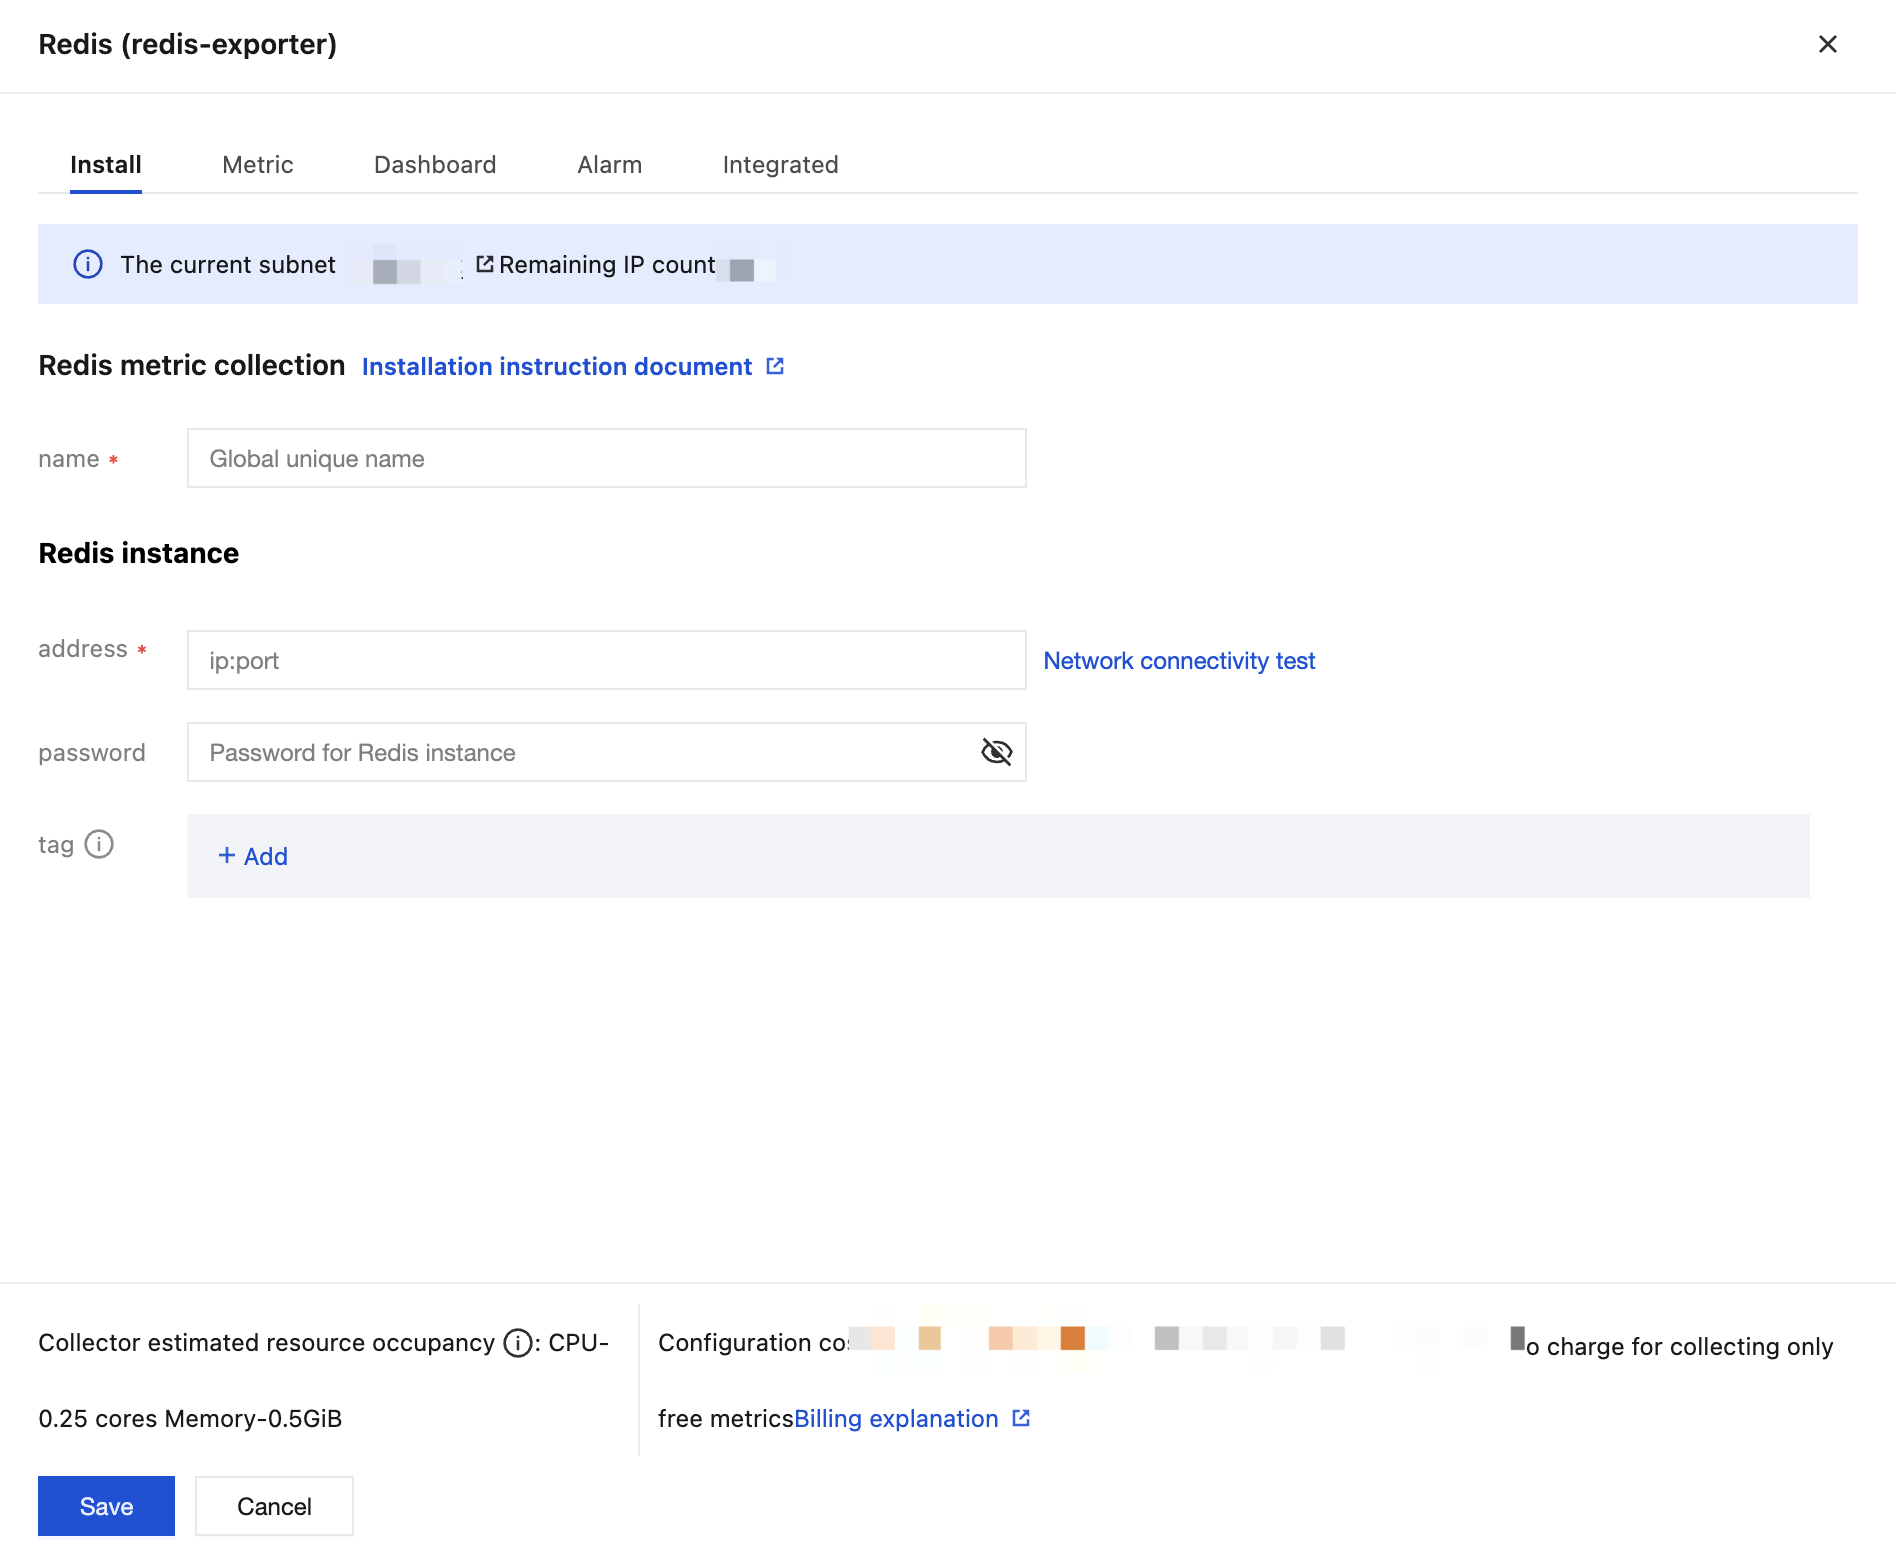
4. Locate and click Redis in the Integration Center, then an installation window will pop up. Fill in the metric collection name and address on the installation page, and click Save.
Configuration Description
Parameter
Description
name
Exporter name, which should meet the following requirements:
The name should be unique.
The name should conform to the following regular expression: '^[a-z0-9]([-a-z0-9]*[a-z0-9])?(\\.[a-z0-9]([-a-z0-9]*[a-z0-9])?)*$'.
address
Redis connection address.
password
Redis password.
tag
Custom labels for metrics.
Method 2: Custom Installation
Note:
For easier exporter installation and management, we recommend you use TKE for unified management.
In the TMP console, select the corresponding Prometheus instance, then go to Data Collection > Integration with TKE, locate the corresponding container cluster to complete the cluster association. For details, see the guide on Associated Cluster.
1. On the left sidebar, select Workload > Deployment to enter the Deployment page.
2. In the top-right corner of the page, click Create via YAML to create a YAML configuration as detailed below:
You can use Kubernetes Secrets to manage and encrypt passwords. When starting the Redis exporter, you can directly use the Secret key but need to adjust the corresponding password. Below is a sample YAML configuration:
apiVersion: v1
kind: Secret
metadata:
name: redis-secret-test
namespace: redis-test
type: Opaque
stringData:
password: you-guess #Redis password
Deploying Redis Exporter
On the Deployment management page, click Create and select the target namespace to deploy the service. You can create in the console. Here, YAML is used to deploy the exporter. Below is a sample YAML configuration:
Note:
For more detailed parameters of the Exporter, see redis_exporter.
apiVersion: apps/v1
kind: Deployment
metadata:
labels:
k8s-app: redis-exporter # Adjust to the corresponding name based on business requirements. It is recommended to include information about the Redis instance, such as crs-66e112fp-redis-exporter
name: redis-exporter # Adjust to the corresponding name based on business requirements. It is recommended to include information about the Redis instance, such as crs-66e112fp-redis-exporter
namespace: redis-test # Select a suitable namespace to deploy the exporter, if there is no namespace, need to create one
spec:
replicas: 1
selector:
matchLabels:
k8s-app: redis-exporter # Adjust to the corresponding name based on business requirements. It is recommended to include information about the Redis instance, such as crs-66e112fp-redis-exporter
template:
metadata:
labels:
k8s-app: redis-exporter # Adjust to the corresponding name based on business requirements. It is recommended to include information about the Redis instance, such as crs-66e112fp-redis-exporter
name: metric-port # This name is required when configuring scraping task
securityContext:
privileged: false
terminationMessagePath: /dev/termination-log
terminationMessagePolicy: File
dnsPolicy: ClusterFirst
imagePullSecrets:
- name: qcloudregistrykey
restartPolicy: Always
schedulerName: default-scheduler
securityContext: {}
terminationGracePeriodSeconds: 30
Verification
1. Click the newly created Deployment on the Deployment page to enter the Deployment management page.
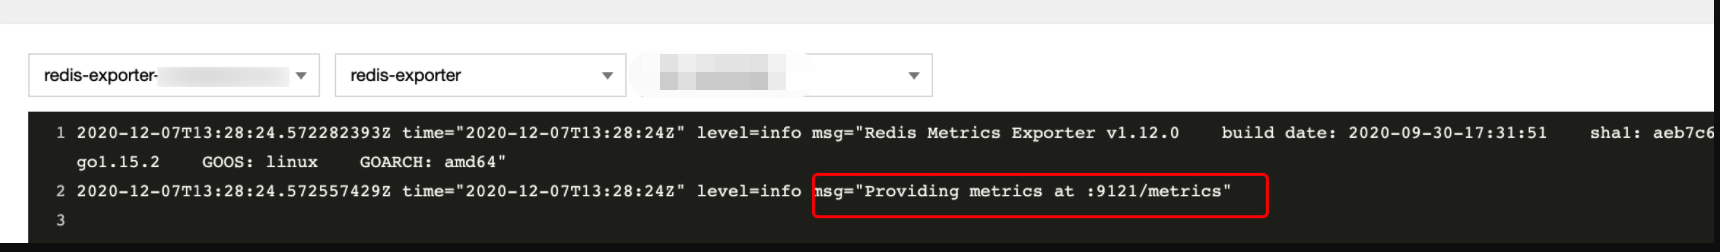
2. Click the Log tab, and you can see that the exporter is successfully started and its address is exposed as shown below:
3. Click the Pod Management tab to enter the Pod page.
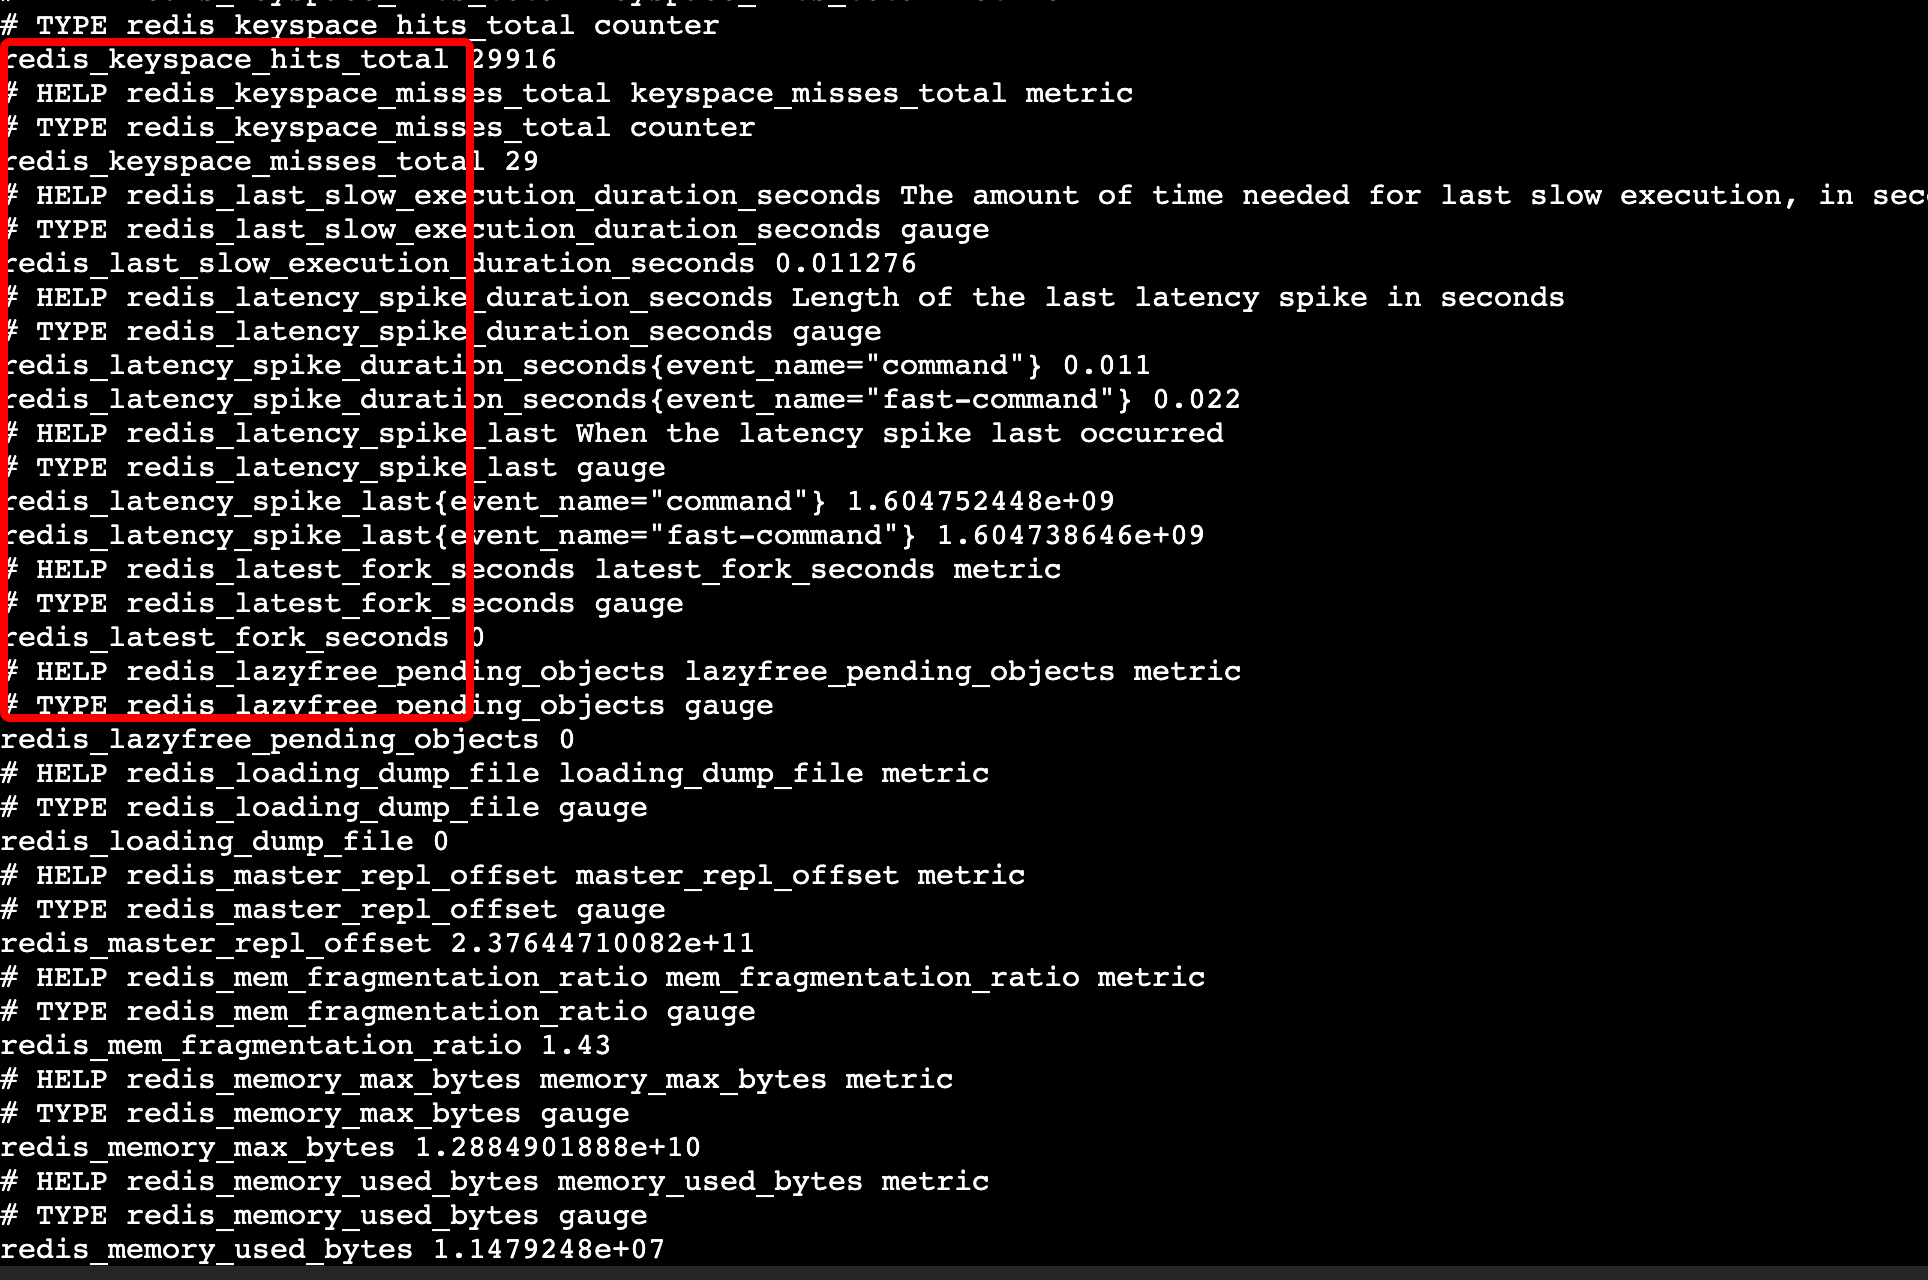
4. In the Operations column on the right, click Remote Login to log in to the Pod. Run the following curl command with the address exposed by the exporter in the command line window, and you can get the corresponding Redis metrics normally. If no corresponding data is returned, please check whether REDIS_ADDR and REDIS_PASSWORD are correct as shown below:
curl http://localhost:9121/metrics
The command execution result is shown below:
Step Two: Add Collection Task
1. Log in to the TMP console and select the corresponding Prometheus instance to go to the management page.
2. In Data Collection > Integrate with TKE, select the associated cluster, and choose Data Collection Configuration > Customize Monitoring Configuration > Via YAML to add a collection task.
3. Add a PodMonitor via service discovery to define the collection task. The YAML example is as follows:
apiVersion: monitoring.coreos.com/v1
kind: PodMonitor
metadata:
name: redis-exporter # Enter a unique name
namespace: cm-prometheus # Pay-as-you-go instance: cluster namespace; Annual and monthly subscription instances (no longer available): namespace is fixed, do not change
spec:
podMetricsEndpoints:
- interval: 30s
port: metric-port # enter the port Name of the Prometheus Exporter in the pod yaml file
path: /metrics # Enter the path of the Prometheus Exporter. Default value: /metrics.
relabelings:
- action: replace
sourceLabels:
- instance
regex: (.*)
targetLabel: instance
replacement: 'crs-xxxxxx'# Replace with the corresponding Redis instance ID
- action: replace
sourceLabels:
- instance
regex: (.*)
targetLabel: ip
replacement: '1.x.x.x'# Replace with the corresponding Redis instance IP
namespaceSelector: # Select the namespace where the Pod to be monitored is located.
matchNames:
- redis-test
selector: # enter the labels of the pod to be monitored to locate target pod
matchLabels:
k8s-app: redis-exporter
Note:
As the Exporter and Redis are deployed on different servers, we recommend you use the Prometheus relabeling mechanism to add the Redis instance information to the monitoring metrics so as to locate problems more easily.
Viewing Monitoring Data
Prerequisites
The Prometheus instance has been bound to a Grafana instance.
Operation Steps
1. Log in to the TMP console and select the corresponding Prometheus instance to go to the management page.
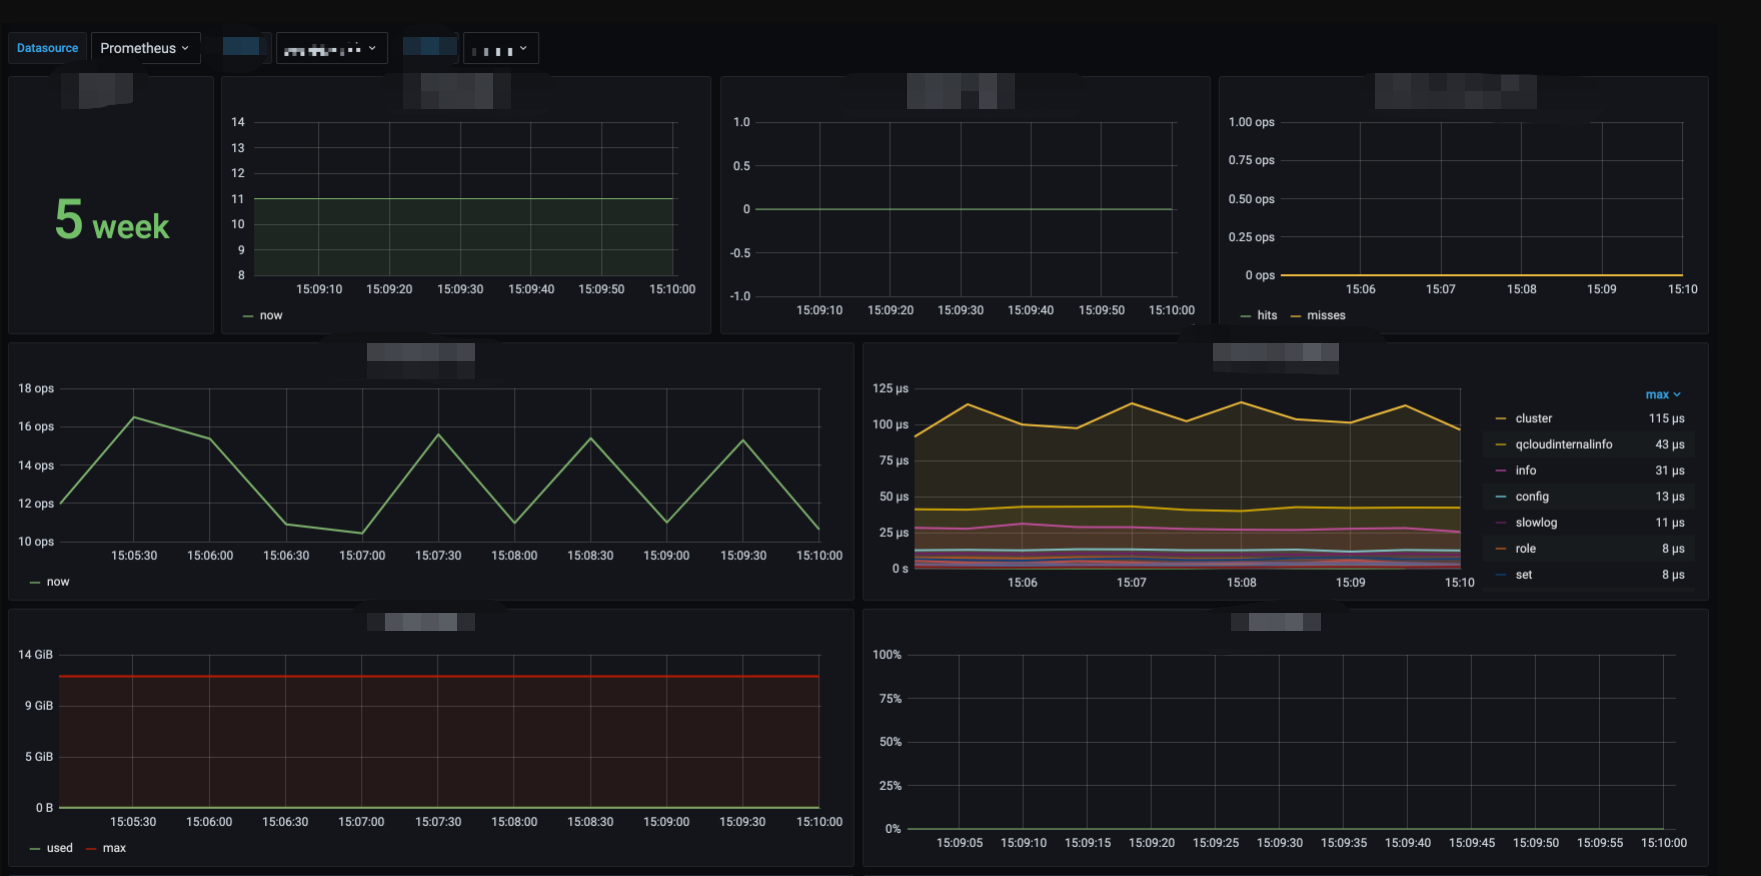
2. Click Data Acquisition > Integration Center to enter the Integration Center page. Find Redis monitoring, install the corresponding Grafana Dashboard to enable the Redis monitoring Dashboard and view monitoring data related to the instance, as shown below:
Configuring Alarm
1. Log in to the TMP console and select the corresponding Prometheus instance to go to the management page.
2. Click Alarm Management > Alarm Policy to add corresponding alarm policies. For details, see Creating Alarm Policy.