The MySQL exporter is specially designed and developed by the Prometheus community to collect MySQL/MariaDB database monitoring metrics. The exporter reports core database metrics, which can be used for exception alerting and displayed on the monitoring dashboard. TMP supports integration with the MySQL exporter and provides an out-of-the-box Grafana monitoring dashboard.
Currently, the exporter supports MySQL 5.6 or above and MariaDB 10.1 or above. If MySQL or MariaDB is below 5.6 or 10.1 respectively, some monitoring metrics may fail to be collected.
Note:
For easier export installation and management, we recommend you use TKE for unified management.
Prerequisites
You have created a TKE cluster in the region and VPC of your TMP instance and created a namespace for the cluster.
You have located and integrated the target TKE cluster in the Integrate with TKE section of the target TMP instance in the TMP console. For more information, please see Agent Management.
Directions
Authorizing in database
As the MySQL exporter monitors a database by querying its status data, you need to grant the exporter access to the corresponding database instance. The account and password should be set based on the actual conditions. The authorization steps are as follows:
2. On the instance list page, click the name of the database for which to authorize the exporter to enter the database details page.
3. Select Database Management > Account Management to enter the account management page and create an account for monitoring based on the actual business needs.
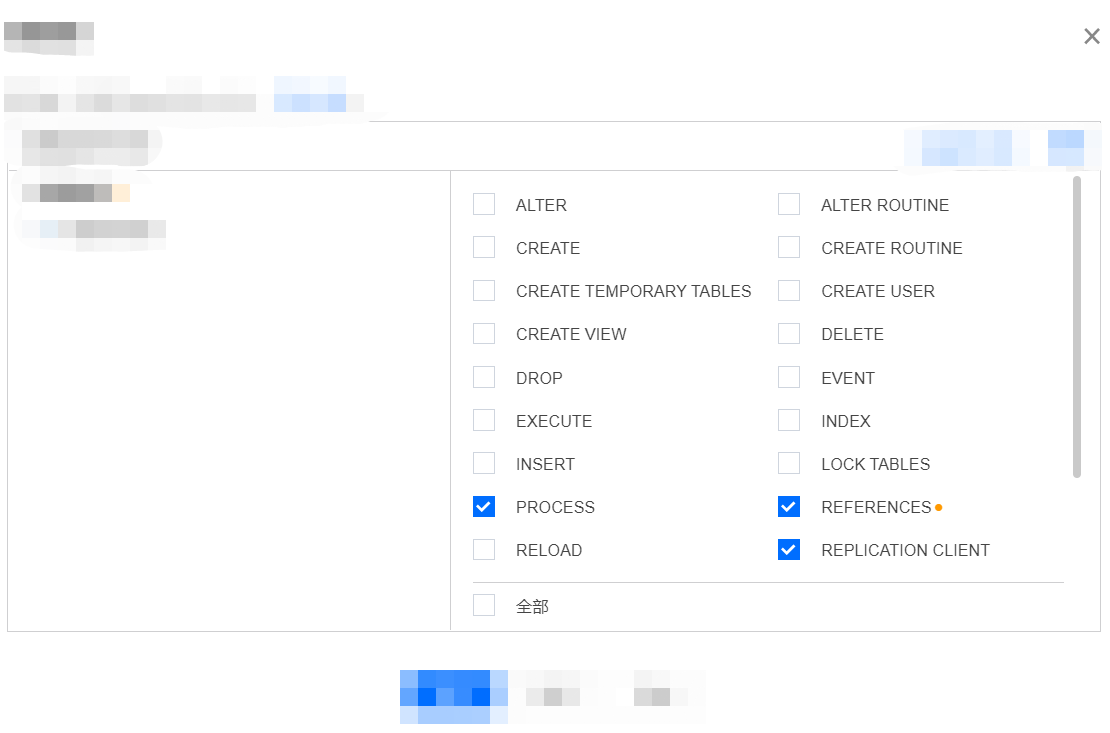
4. Click Modify Permissions in the Operation column on the right of the account to modify the corresponding permissions as shown below:
You can run the following command for authorization:
CREATE USER'exporter'@'ip' IDENTIFIED BY 'XXXXXXXX' WITH MAX_USER_CONNECTIONS 3;
GRANT PROCESS, REPLICATION CLIENT, SELECT ON *.* TO 'exporter'@'ip';
Note:
We recommend you set the allowed maximum number of connections for the account to avoid any impact on the database due to monitoring data collection. However, not all database versions support this configuration, for example, MariaDB 10.1. For more information, please see Resource Limit Options.
1. On the left sidebar, select Workload > Deployment to enter the Deployment page.
2. In the top-right corner of the page, click Create via YAML to create a YAML configuration as detailed below:
You can use Kubernetes Secrets to manage and encrypt connection strings. When starting the MySQL exporter, you can directly use the Secret key but need to adjust the corresponding connection string. Below is a sample YAML configuration:
apiVersion: v1
kind: Secret
metadata:
name: mysql-secret-test
namespace: mysql-demo
type: Opaque
stringData:
datasource:"user:password@tcp(ip:port)/"# Corresponding MySQL connection string information
Deploying MySQL exporter
On the Deployment management page, select the target namespace to deploy the service. You can create in the console. Here, YAML is used to deploy the exporter. Below is a sample configuration:
apiVersion: apps/v1
kind: Deployment
metadata:
labels:
k8s-app: mysql-exporter # Rename the exporter based on the business needs. We recommend you add the MySQL instance information
name: mysql-exporter # Rename the exporter based on the business needs. We recommend you add the MySQL instance information
namespace: mysql-demo
spec:
replicas:1
selector:
matchLabels:
k8s-app: mysql-exporter # Rename the exporter based on the business needs. We recommend you add the MySQL instance information
template:
metadata:
labels:
k8s-app: mysql-exporter # Rename the exporter based on the business needs. We recommend you add the MySQL instance information
1. Click the newly created Deployment on the Deployment page to enter the Deployment management page.
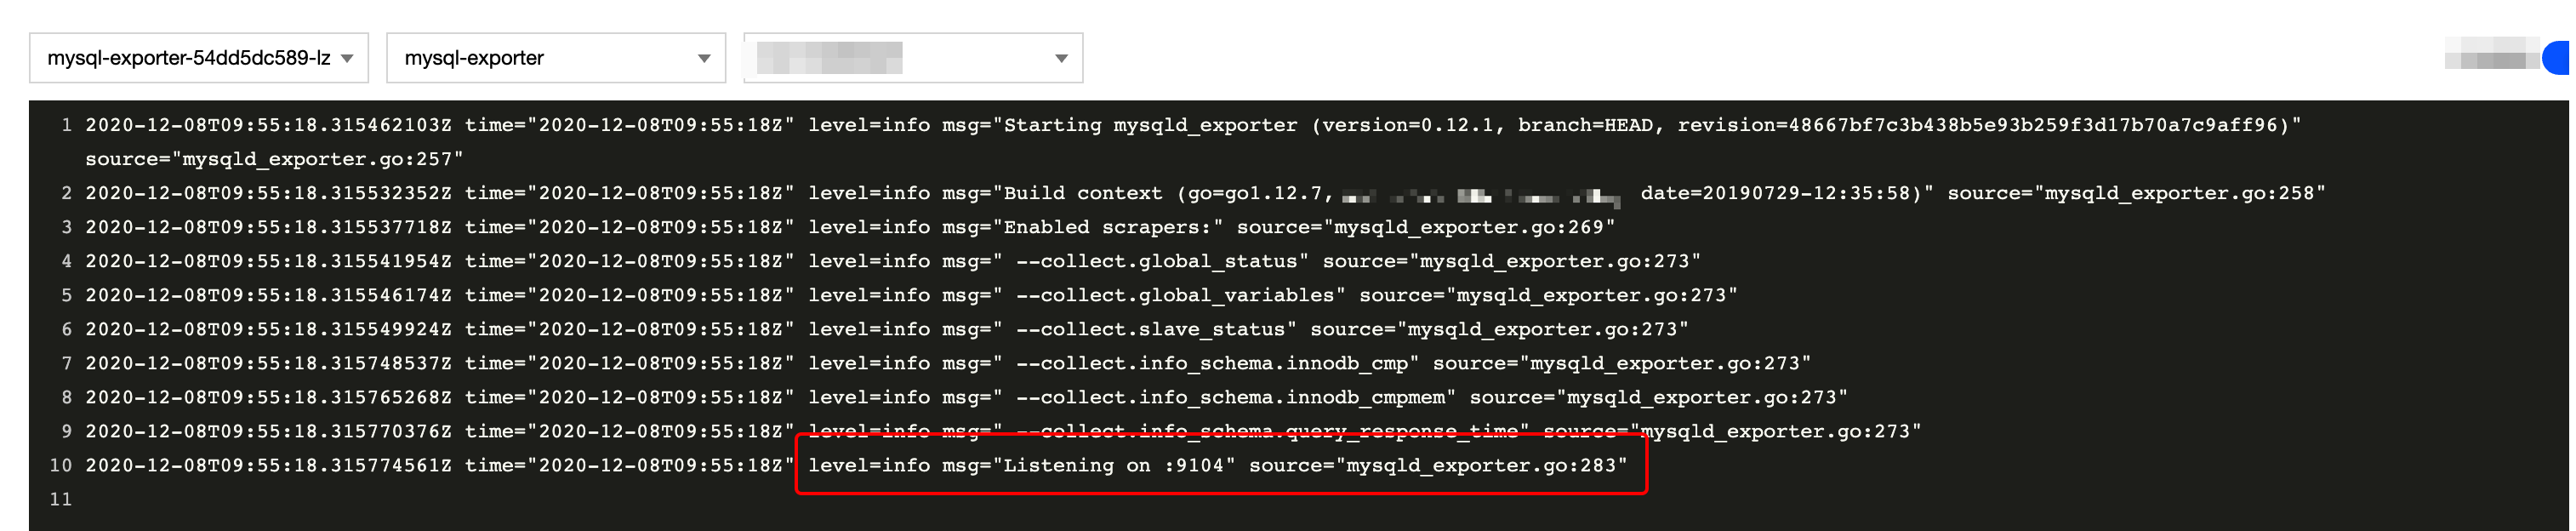
2. Click the Log tab, and you can see that the exporter is successfully started and its address is exposed as shown below:
3. Click the Pod Management tab to enter the Pod page.
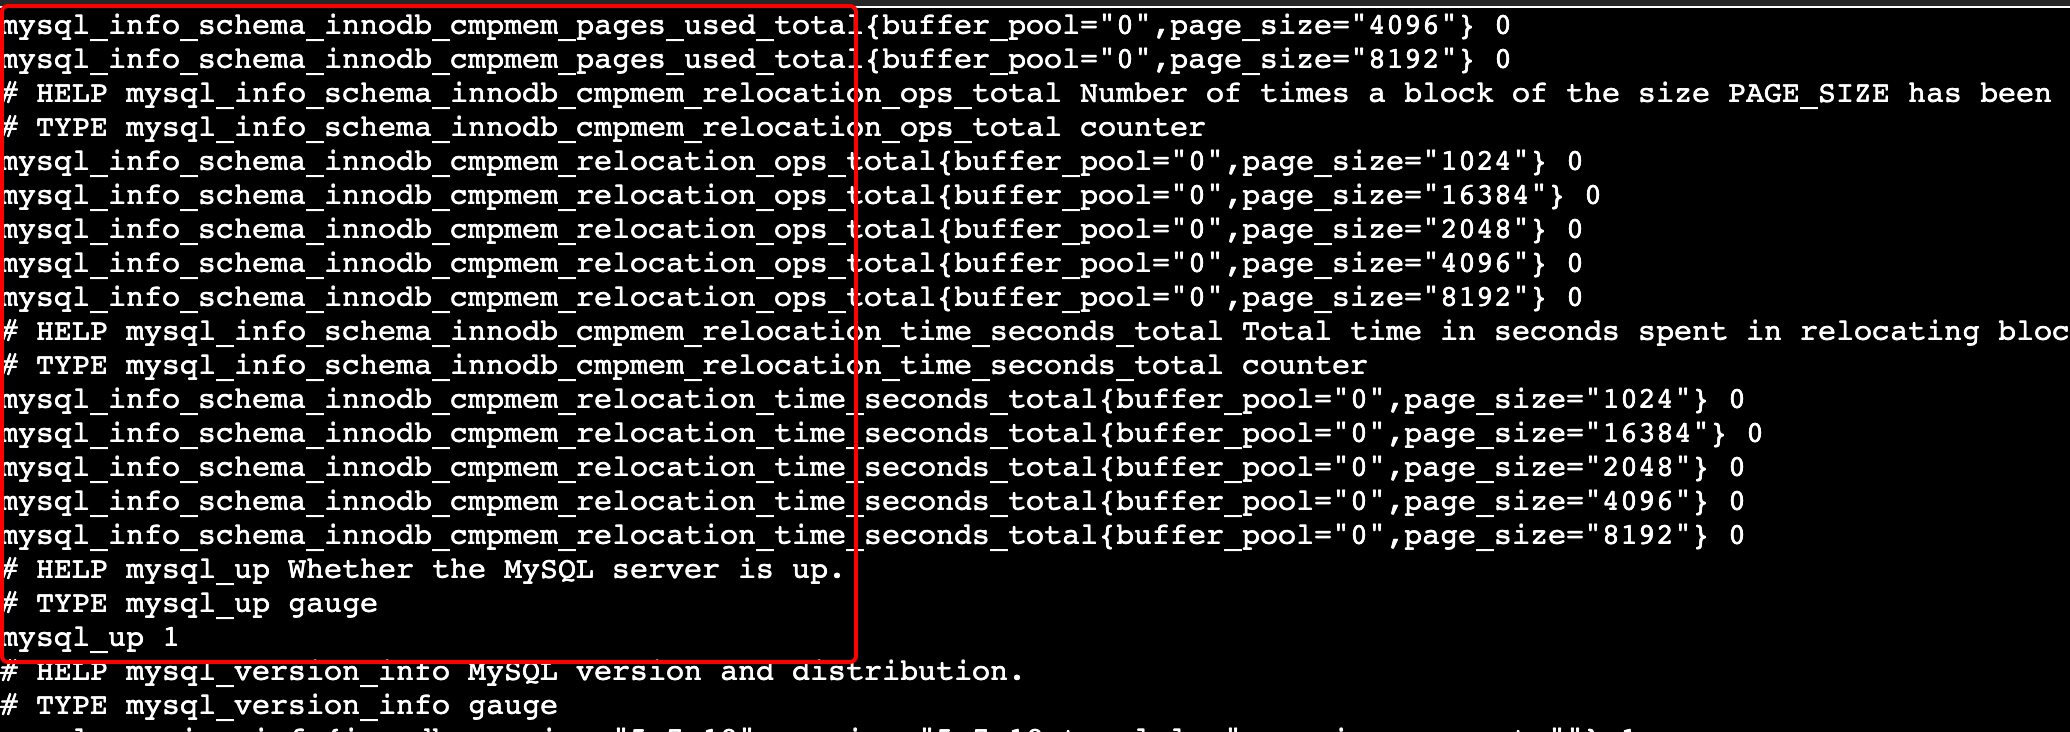
4. In the Operations column on the right, click Remote Login to log in to the Pod. Run the following curl command with the address exposed by the exporter in the command line window, and you can get the corresponding MySQL metrics normally. If no corresponding data is returned, please check whether the connection string is correct as shown below:
curl localhost:9104/metrics
The execution result is as shown below:
Adding scrape task
1. Log in to the TMP console and select the target TMP instance to enter the management page.
2. Click a cluster ID in the TKE cluster list to enter the Integrate with TKE page.
3. In Scrape Configuration, add Pod Monitor to define a Prometheus scrape task. Below is a sample YAML configuration:
apiVersion: monitoring.coreos.com/v1
kind: PodMonitor
metadata:
name: mysql-exporter # Enter a unique name
namespace: cm-prometheus # The namespace is fixed. Do not change it
spec:
podMetricsEndpoints:
-interval: 30s
port: metric-port # Enter the name of the corresponding port of the Prometheus exporter in the Pod YAML configuration file
path: /metrics # Enter the value of the corresponding path of the Prometheus exporter. If it is not specified, it will be `/metrics` by default
relabelings:
-action: replace
sourceLabels:
- instance
regex: (.*)
targetLabel: instance
replacement:'crs-xxxxxx'# Change it to the corresponding MySQL instance ID
-action: replace
sourceLabels:
- instance
regex: (.*)
targetLabel: ip
replacement:'1.x.x.x'# Change it to the corresponding MySQL instance IP
namespaceSelector:# Select the namespace where the Pod to be monitored resides
matchNames:
- mysql-demo
selector:# Enter the label value of the Pod to be monitored to locate the target Pod
matchLabels:
k8s-app: mysql-exporter
Viewing monitoring information
1. Log in to the TMP console and select the target TMP instance to enter the management page.
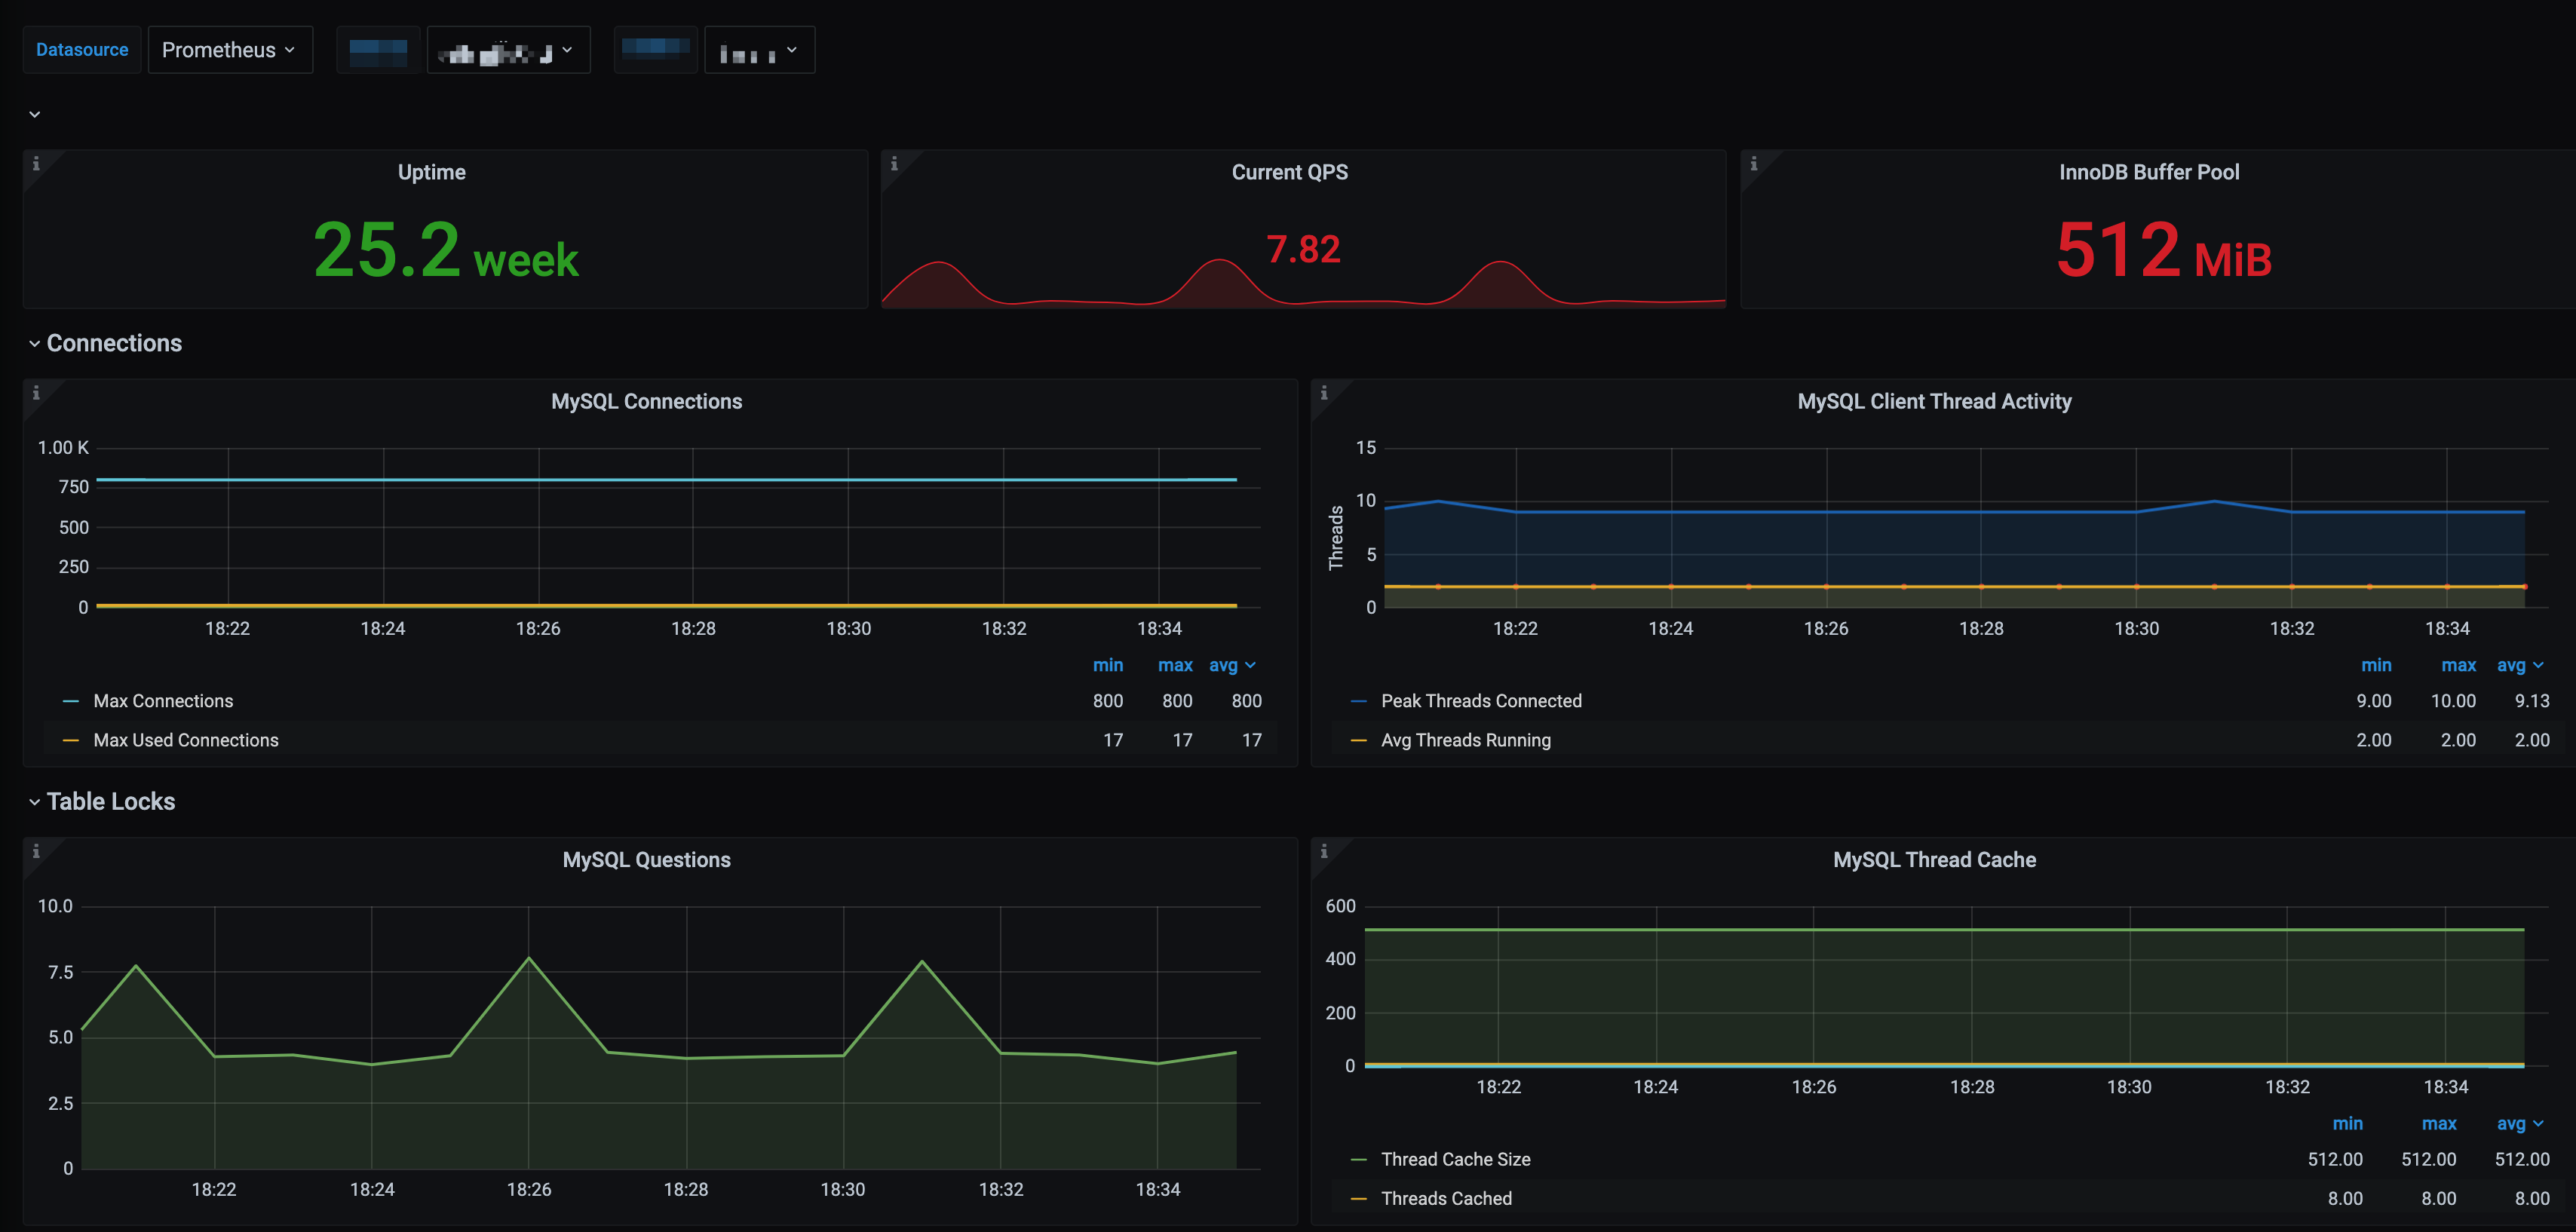
2. Click Integration Center to enter the Integration Center page. Find MySQL monitoring, install the corresponding Grafana dashboard, and then you can enable the MySQL monitoring dashboard to view instance monitoring data as shown below:
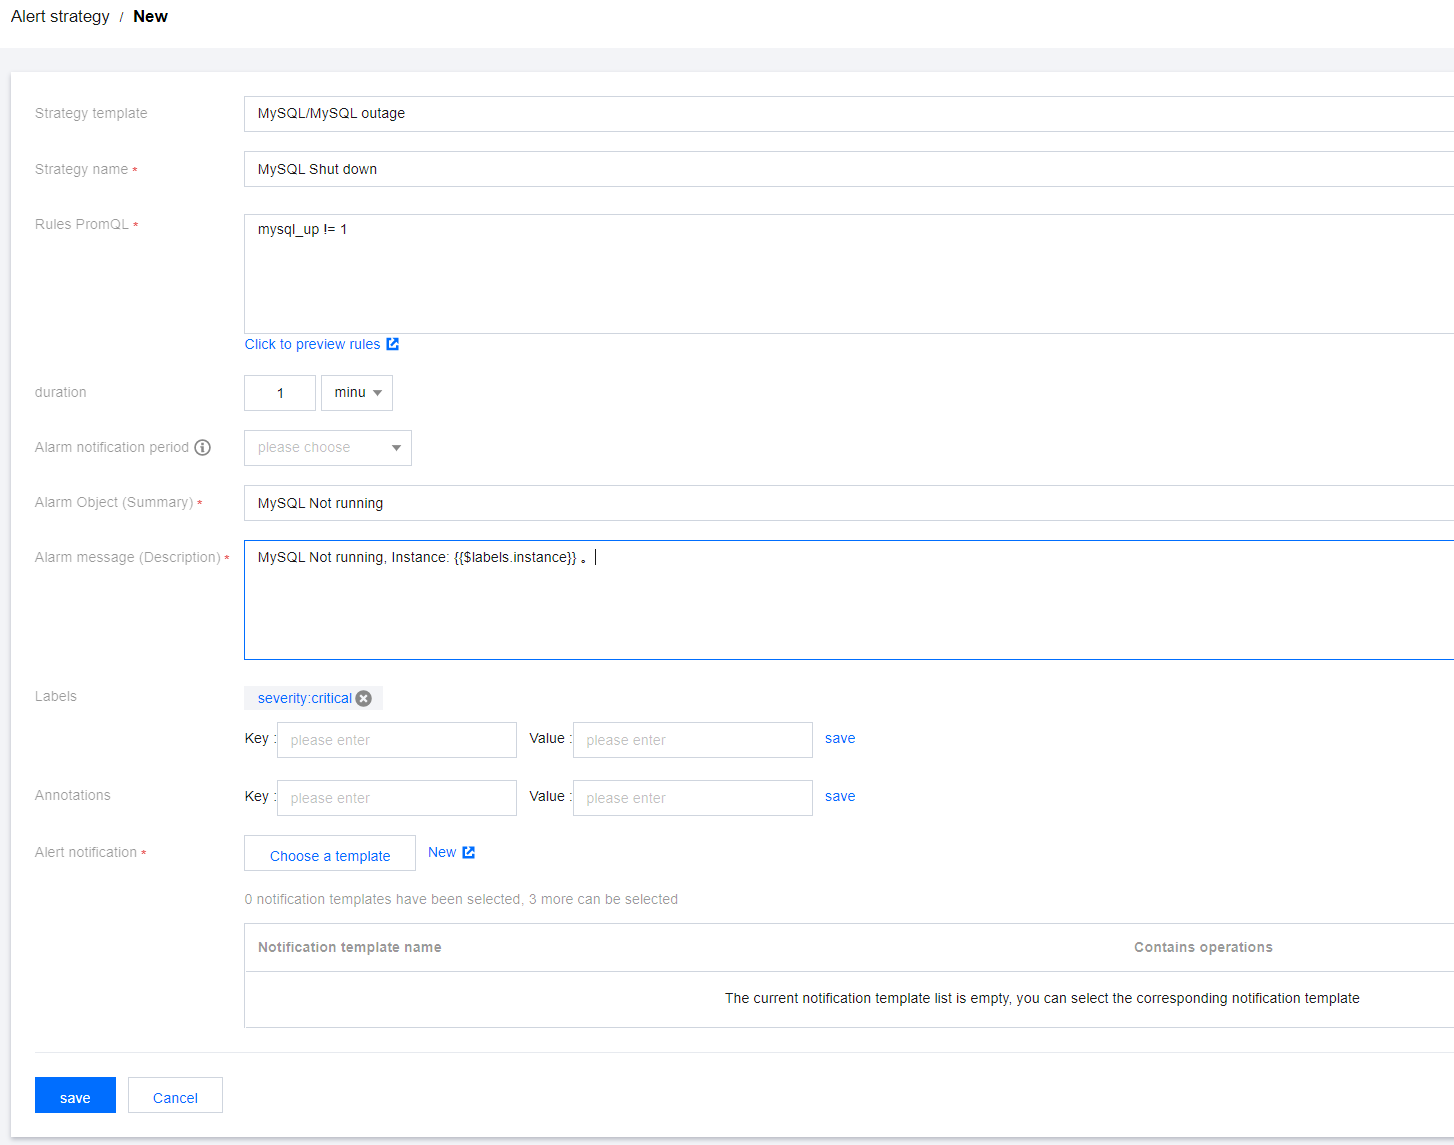
Integrating with alert feature
TMP has some built-in MySQL alerting rule templates. You can adjust the corresponding thresholds to add alerting rules based on your actual business conditions. For more information, please see Creating Alerting Rule.
MySQL Exporter Collection Parameter Description
The MySQL exporter uses various collectors to enable/disable data collection. The specific parameters are as listed below:
Parameter
MySQL Version
Description
collect.auto_increment.columns
5.1
Collects auto_increment columns and max values from information_schema.
collect.binlog_size
5.1
Collects the current size of all registered binlog files.
collect.engine_innodb_status
5.1
Collects the status data from SHOW ENGINE INNODB STATUS.
collect.engine_tokudb_status
5.6
Collects the status data from SHOW ENGINE TOKUDB STATUS.
collect.global_status
5.1
Collects the status data from SHOW GLOBAL STATUS (enabled by default).
collect.global_variables
5.1
Collects the status data from SHOW GLOBAL VARIABLES (enabled by default).
collect.info_schema.clientstats
5.5
If userstat=1 is set, this parameter can be set to true to enable client data collection.
collect.info_schema.innodb_metrics
5.6
Collects the monitoring data from information_schema.innodb_metrics.
collect.info_schema.innodb_tablespaces
5.7
Collects the monitoring data from information_schema.innodb_sys_tablespaces.
collect.info_schema.innodb_cmp
5.5
Collects the monitoring data of compressed InnoDB tables from information_schema.innodb_cmp.
collect.info_schema.innodb_cmpmem
5.5
Collects the monitoring data of InnoDB buffer pool compression from information_schema.innodb_cmpmem.
collect.info_schema.processlist
5.1
Collects the monitoring data of the thread status count from information_schema.processlist.
collect.info_schema.processlist.min_time
5.1
Minimum time a thread must be in each status to be counted. Default value: 0
collect.info_schema.query_response_time
5.5
Collects query response time distribution if query_response_time_stats is set to ON.
collect.info_schema.replica_host
5.6
Collects the status data from information_schema.replica_host_status.
collect.info_schema.tables
5.1
Collects the status data from information_schema.tables.
collect.info_schema.tables.databases
5.1
Sets the list of databases to collect table statistics for, or '*' for all.
collect.info_schema.tablestats
5.1
If userstat=1 is set, this parameter can be set to true to collect table statistics.
collect.info_schema.schemastats
5.1
If userstat=1 is set, this parameter can be set to true to collect schema statistics.
collect.info_schema.userstats
5.1
If userstat=1 is set, this parameter can be set to true to collect user statistics.
collect.perf_schema.eventsstatements
5.6
Collects the monitoring data from performance_schema.events_statements_summary_by_digest.

 Yes
Yes
 No
No
Was this page helpful?