Common Exporter
Download
Focus Mode
Font Size
As a mainstream monitoring system, Prometheus can monitor a wide range of components, including databases, middleware, and cloud services. Many of these services natively support exposing Prometheus-format metrics through specific ports and paths (for example, 8080/metrics), eliminating the need to develop additional adapter plugins. To integrate these services into the monitoring system, you only need to configure collection rules. These services share a common characteristic in collection configurations. That is, both static collection configurations and service discovery configurations can meet the needs of most deployment scenarios. Based on this characteristic, TencentCloud Managed Service for Prometheus (TMP), part of Tencent Cloud Observability Platform (TCOP), offers Common Exporter, enabling quick integration for all services (such as JVM and Spring MVC) with built-in Prometheus metric exposure capabilities. This document will guide you on how to use the Prometheus Common Exporter feature of TCOP.
Typical Scenarios
TMP provides documentation for custom integration in certain scenarios. The integration steps can be summarized as deploying services, enabling metric reporting, and adding collection tasks. Although service types and deployment methods may vary, Common Exporter can eliminate the need to manually write collection configuration steps. This feature is generally applicable for monitoring services that expose Prometheus-format metrics through specific ports and paths. Applicable scenarios include, but are not limited to the following:
Docker
ETCD
Kong
Prerequisites
The service to be monitored has been deployed successfully and exposes Prometheus-format metrics through specific ports and paths.
The current Prometheus instance is located in a Virtual Private Cloud (VPC) that is connected to the network where the service to be monitored resides.
If the component to be monitored is deployed in a container environment, ensure that the current Prometheus instance has been successfully associated with the cluster where the component service to be monitored resides. For detailed steps, refer to Integration with TKE.
Operation Steps
1. Log in to the TMP console.
2. Select the corresponding Prometheus instance from the instance list.
3. Go to the instance details page, and choose Data Collection > Integration Center.
4. Find and click Common Exporter in the Integration Center. An installation window will pop up. On the installation page, fill in the integration name and select the deployment method. The configuration methods are as follows.
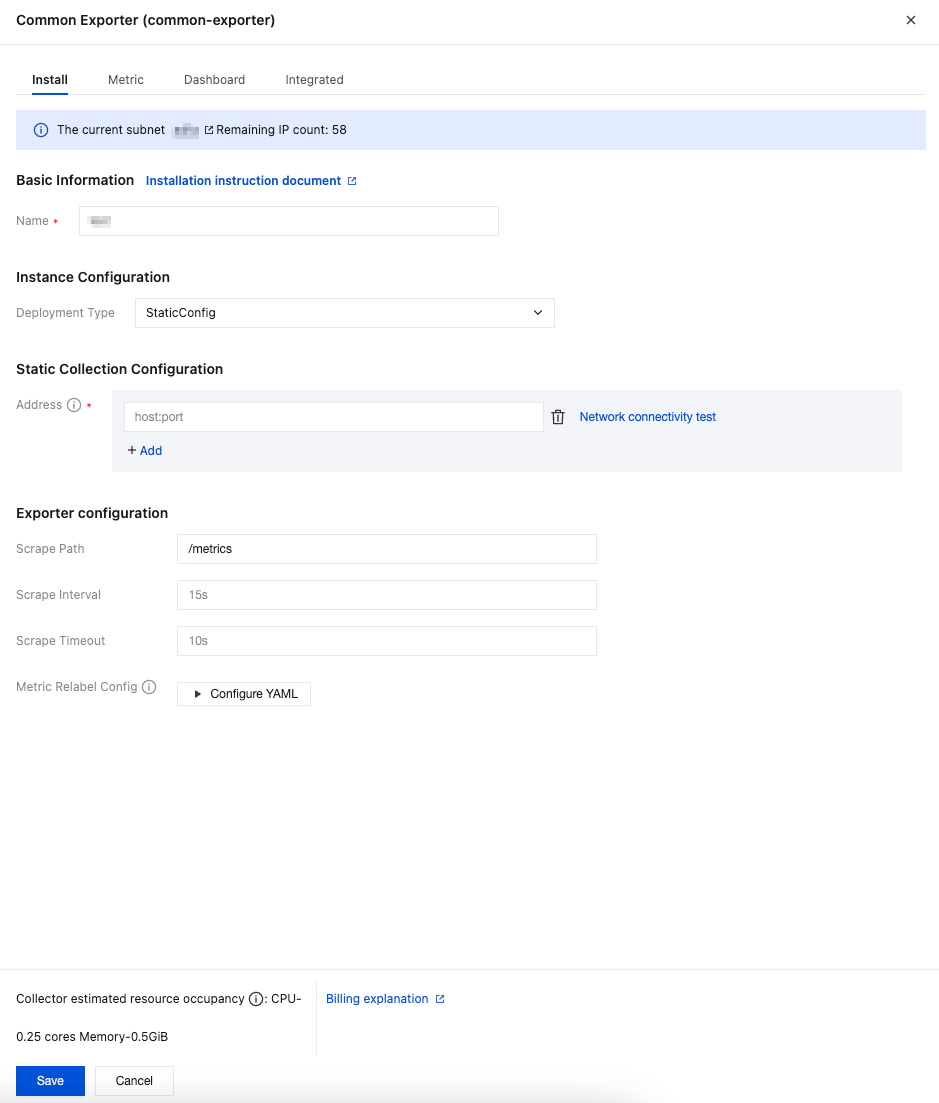
If the component to be monitored is deployed in a non-container environment, you can use the StaticConfig deployment type to deploy the collection configurations for monitoring. The configuration steps are as follows:
1. In the pop-up installation window, find Deployment Type under Instance Configuration, then select StaticConfig from the drop-down list.
2. In Static Collection Configuration > Address, fill in the host:port of the component to be monitored. Multiple addresses can be added. Network interconnectivity with the Prometheus instance should be ensured.
3. Confirm whether the path specified in Exporter Configuration > Scrape Path is consistent with the configurations of the component to be monitored.
4. Fill in other Exporter configurations as needed, then click Save.
Parameter | Description |
Name | Integration name, which should comply with the following naming conventions: The name should be unique. The name should fully match the regular expression '^[a-z0-9]([-a-z0-9]*[a-z0-9])?(\\.[a-z0-9]([-a-z0-9]*[a-z0-9])?)*$'. |
Deployment Type | Deployment type for monitoring. StaticConfig represents static collection configurations. |
Address | Enter the collection target address in the format host:port. Multiple addresses can be added. Network interconnectivity with the Prometheus instance should be ensured. To enable access over the public network, refer to Enabling Public Network Access for TKE Serverless Cluster. |
Scrape Path | Path where the component to be monitored exposes metrics. Default: /metrics. |
Scrape Interval | Default: 15s. Example values: 60s, 1m30s, 5m. |
Scrape Timeout | Default: 10s. The scrape timeout should be less than or equal to the scrape interval. Specify the value in the same format as the scrape interval. |
Metric Relabel Config | Optional. Prometheus native metric_relabel_configs and Prometheus Operator native metricRelabelings configurations are compatible, but cannot be used simultaneously. |
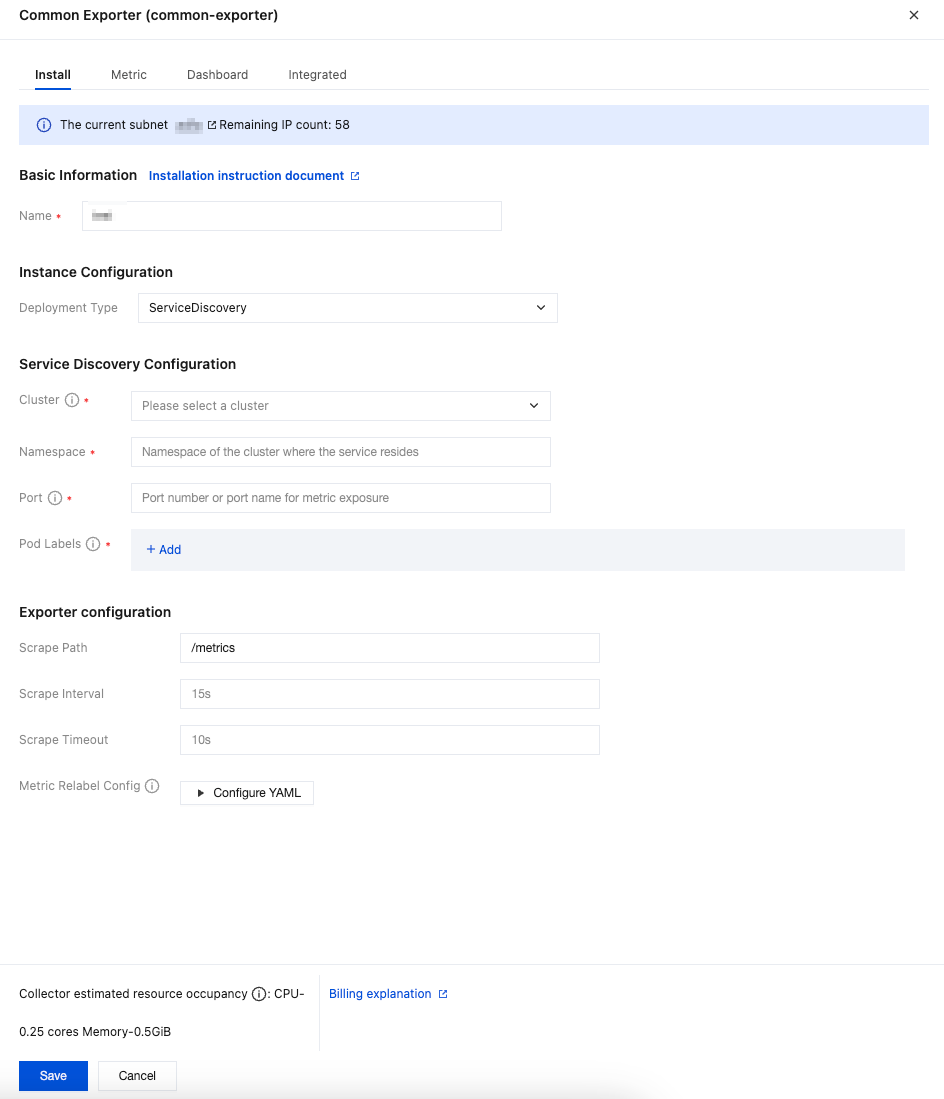
If the component to be monitored is deployed in a container environment, you can use the ServiceDiscovery deployment type to deploy the collection configurations for monitoring. The configuration steps are as follows:
1. In the pop-up installation window, find Deployment Type under Instance Configuration, then select ServiceDiscovery from the drop-down list.
2. Under Service Discovery Configuration, select the cluster where the component service to be monitored is located, then fill in the namespace of the component to be monitored, the metric exposure port number or port name, and the pod labels of the component service to be monitored.
3. Confirm whether the path specified in Exporter Configuration > Scrape Path is consistent with the configurations of the component to be monitored.
4. Fill in other Exporter configurations as needed, then click Save.
Parameter | Description |
Name | Integration name, which should comply with the following naming conventions: The name should be unique. The name should fully match the regular expression '^[a-z0-9]([-a-z0-9]*[a-z0-9])?(\\.[a-z0-9]([-a-z0-9]*[a-z0-9])?)*$'. |
Deployment Type | Deployment type for monitoring. ServiceDiscovery represents service discovery configurations. |
Cluster | Cluster where the component service to be monitored is located. Ensure that the cluster has been successfully associated with the current Prometheus instance. For detailed steps, refer to Integration with TKE. |
Namespace | Namespace of the cluster where the component service to be monitored is located. |
Port | Metric exposure port number or port name of the component service to be monitored. Port configurations should be added in the workload spec.template.spec.containers.ports. |
Pod Labels | Tag that the Pod of the component service to be monitored explicitly configures in metadata.labels. When a Pod is created through a workload, the Pod tag is the tag configured in the workload spec.template.metadata.labels. |
Scrape Path | Path where the component service to be monitored exposes metrics. Default: /metrics. |
Scrape Interval | Default: 15s. Example values: 60s, 1m30s, 5m. |
Scrape Timeout | Default: 10s. The scrape timeout should be less than or equal to the scrape interval. Specify the value in the same format as the scrape interval. |
Metric Relabel Config | Optional. Prometheus native metric_relabel_configs and Prometheus Operator native metricRelabelings configurations are compatible, but cannot be used simultaneously. |
Viewing Monitoring Data
Prerequisites
The Prometheus instance has been bound to a Grafana instance.
Operation Steps
1. Log in to the TMP console, and select the corresponding Prometheus instance to go to the management page.
2. Choose Data Collection > Integration Center. On the Integration Center page, find and click the Common Exporter card to open the integration page. Select Dashboard > Dashboard Install/Upgrade to install the corresponding Grafana Dashboard.
3. Open the Grafana address corresponding to the Prometheus instance, and view the monitoring panels for different applications based on the path specified in Panel Descriptions under Dashboards.
Panel Descriptions
JVM: Located in the
java folder. Go to the folder and search for JVM.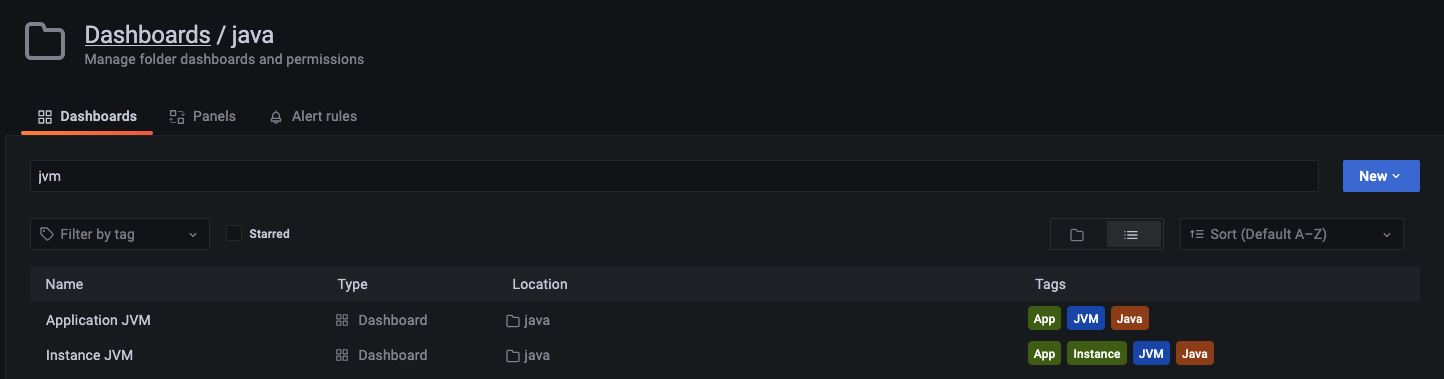
Panel details are as follows:
Application JVM: Provides an application-level view of all instances under an application to detect exceptions. If an exception is detected in an instance, you can drill down to monitor the corresponding instance.
Instance JVM: Displays detailed monitoring data for a single JVM instance.
Spring Boot: Located in the
java folder. Filter by the Spring tag.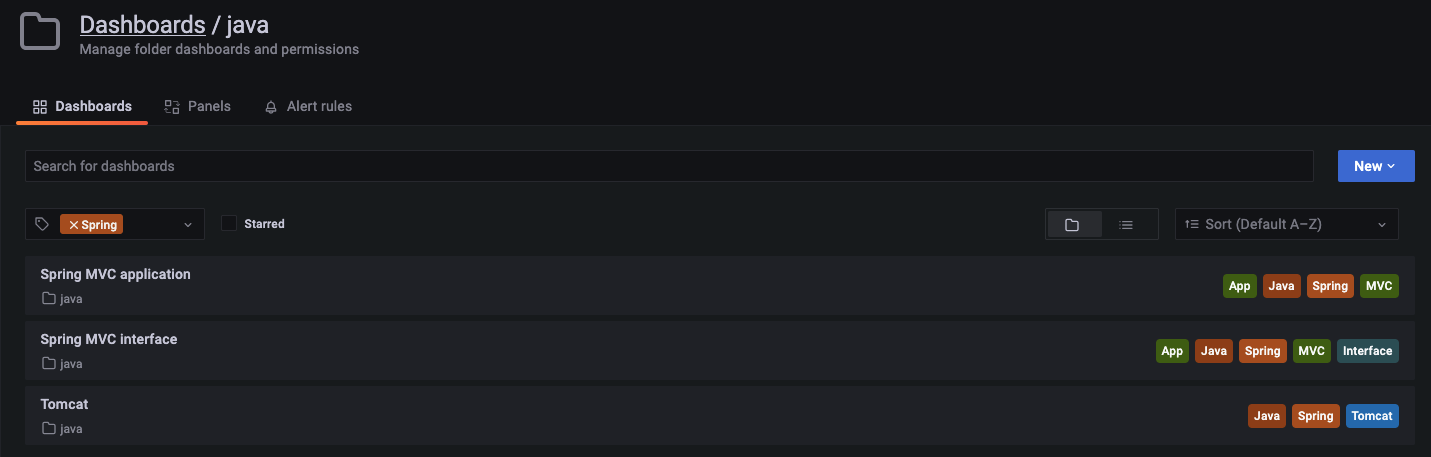
Panel details are as follows:
Spring MVC application: Monitors MVC status, including request duration, request volume, success rate, and exception distribution.
Spring MVC API: Provides API-level monitoring. Multiple APIs can be monitored, helping pinpoint the problematic API.
Tomcat: Displays the monitoring dashboard for Tomcat internal status, including thread usage.
Golang: Located in the
go folder.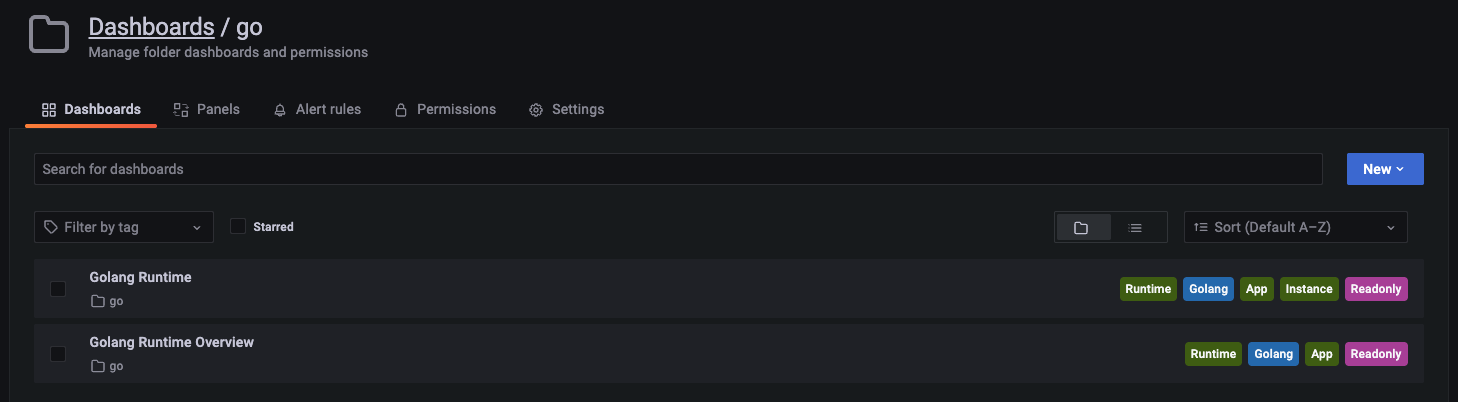
Panel details are as follows:
Golang Runtime: Displays the instance-level monitoring dashboard.
Golang Runtime Overview: Displays the application-level monitoring overview.
Help and Support
Was this page helpful?
You can also Contact sales or Submit a Ticket for help.
Help us improve! Rate your documentation experience in 5 mins.
Feedback