The Aegis SDK failed to capture throw new Error in the code. What should I do?
In Vue framework, Vue.config.errorHandler actively captures errors. You can use it to capture errors and call aegis.error() for reporting.
How do I fix the error 403 of API request?
API error 403 is generally caused by a page domain verification failure. You can check whether the domain set during project creation is the same as the actual reporting domain. If the project doesn't require verification, you can enter * for the domain.
Note:
If you are not sure what the reporting domain is, you can enter location.host in the browser to view it. For non-web projects, * is entered by default, indicating that no verification is required.
After creating a project in RUM, you will get a string containing 18 characters, which is the reporting ID and will be passed in when you run new Aegis. If the ID is incorrect, the error 403 will also be reported.
Aegis initialization
new` `Aegis({`` ``id: ``'pGUVFTCZyewhxxxxxx'``})
Note:
After the project is created, RUM data sync will take about 1–2 minutes.
How do I fix image, JavaScript, or CSS loading failures in logs?
1. Access the resource to check whether it is exceptional.
2. If the access is normal but logs still contain many exceptions, proceed to the next step.
3. Check whether the exceptions occurred just on a specific region or ISP, for example.
4. If this is not the case, the exceptions are most likely caused by user network problems. You can try including a PWA or offline package into your project to reduce such problems. Essentially, such problems on the frontend cannot be completely avoided.
After I connect my project to the SDK, why the aegis.qq.com/speed/webvitals API is canceled during page refresh?
The value of CLS in Web Vitals must be calculated when the page visibility is changed. When the user refreshes a page, if Preserve log is selected, a request will be processed and sent, but if it is canceled by the page refresh, this error will occur, which has no impact on the user and data and can be ignored.
Many error logs show "Script error. @ (:0:0) No specific information". Are they caused by a third-party JavaScript exception? Can I filter them out through configuration?
A script error is also called a CORS error. When a website requests and executes a script that isn't under its own domain, if an error occurs in the cross-origin script, this error may be reported. As scripts in projects are stored in CDN, this type of error is most common.
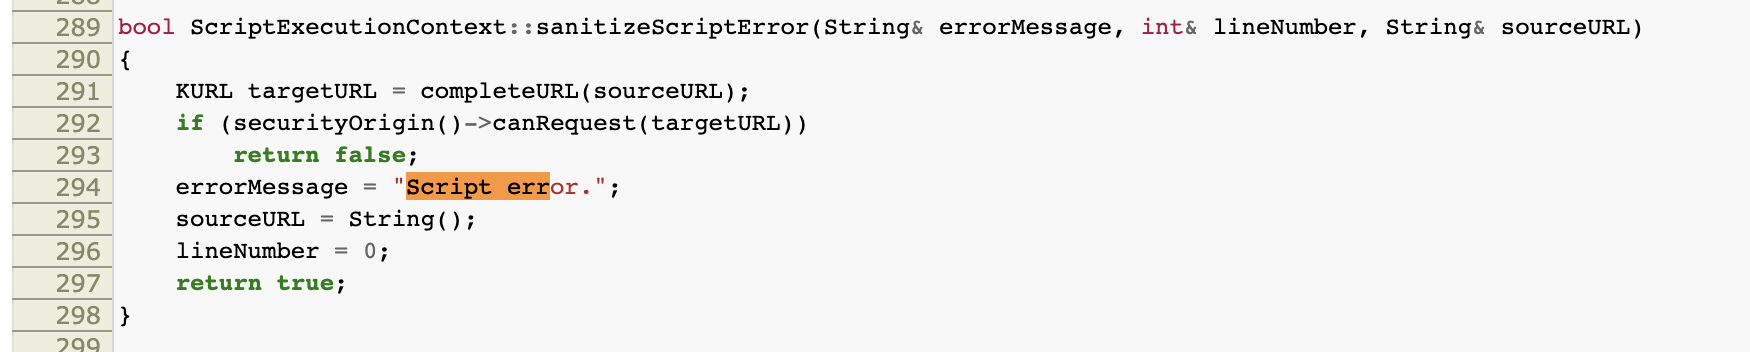
Actually, this is not a JavaScript bug; however, for security considerations, the browser will purposely hide the specific error messages reported by JavaScript files in other origins. Doing so can effectively prevent sensitive information from being unintentionally captured by uncontrolled third-party scripts. Therefore, the browser only allows scripts in the same origin to capture specific error messages, while scripts in other origins only know that an error occurs but cannot know the specific error information. For more information, see ScriptExecutionContext.cpp.
Solutions:
Solution 1: CORS
Step 1. Add the crossorigin attribute to the resource.
window.onerror = function (message, url, line, column, error) {
console.log(message, url, line, column, error);
}
try {
foo(); // Call the `foo` method defined in `app.js`
} catch (e) {
console.log(e);
throw e; // The captured error that is actively reported is not `Script error`
}
</script>
</body>
</html>
If you just want to directly block this problem without solving it, you can choose to not report special logs as detailed in the next question.
I don't want to report certain special logs to RUM. What should I do?
The SDK provides a hook to help you manipulate and restrict a log before reporting it. You can use beforeReport to return false or null, so that the log will not be reported.
How does the SDK get the network type? Why is my network type incorrect?
If UA has NetType, UA is obtained from NetType. If it has no such value and you use navigator.connection.effectiveType || navigator.connection.type, effectiveType will be a type calculated based on your network connection speed, which isn't the actual type.
Why is the API request duration reported by the SDK different from that in network?
The SDK hijacks fetch and xhr and sets breakpoints before and after the API request to test the request speed. As the execution of the JavaScript time difference calculation logic depends on the main JavaScript thread, if a thread is blocked at the end time, the actually calculated time will be longer than the time in network in the browser.
Why is the reported network type different from the actual type? For example, why is 4G reported when the current user actually uses Wi-Fi?
RUM gets the network type through NetType and navigator.connection.effectiveType in UA. The former depends on the network information injected to UA by the browser, while the latter is an "equivalent network type" provided by the browser, which doesn't represent the actual network type. As the navigator.connection.effectiveType API still has compatibility issues and currently doesn't support iOS, the network type will be identified as unknown.
I have enabled the SPA parameter, but why isn't the page performance data reported during page redirect?
Redirect between SPA pages is essentially the execution of a snippet of JavaScript code. The firstScreenTime time is the time between the initiation of the request by the user browser and the completion of visible page element rendering; therefore, the firstScreenTime cannot be calculated.
Many Ajax exceptions with status code 0 are reported in logs. What could be the cause?
Status code 0 of the HTTP API may be caused by the following issues: timeout, abort, cancel, and CORS.
An error is not found during local debugging but frequently occurs on the user side. What could be the cause?
This is because the user may leave the page at any time or an HTTP request may be interrupted due to network problems. In this case, the status code will be 0.
Although there are many reasons why the status code is 0, the logs can always provide some useful information; for example, the error durations in the above screenshot are very short, and the errors occur frequently for a particular user. Based on this, it can be judged that the API is blocked by a browser extension. This problem usually happens for some data reporting APIs.
If the duration is long, there is a high possibility of timeout. You can also view the timeout period of your API for comparison. As for CORS, you can check whether the backend business logic is normal. The problem of cancel is very likely to be caused by the frontend business, and you can also check the specific business logic.