This document describes iteration statistics in Scrum agile management.
Open Project
1. Log in to the CODING Console and click Use Now to go to CODING.
2. Click
in the upper-right corner to open the project list page and click a project icon to open the project.
3. In the menu on the left, click Project Collaboration.
Function Overview
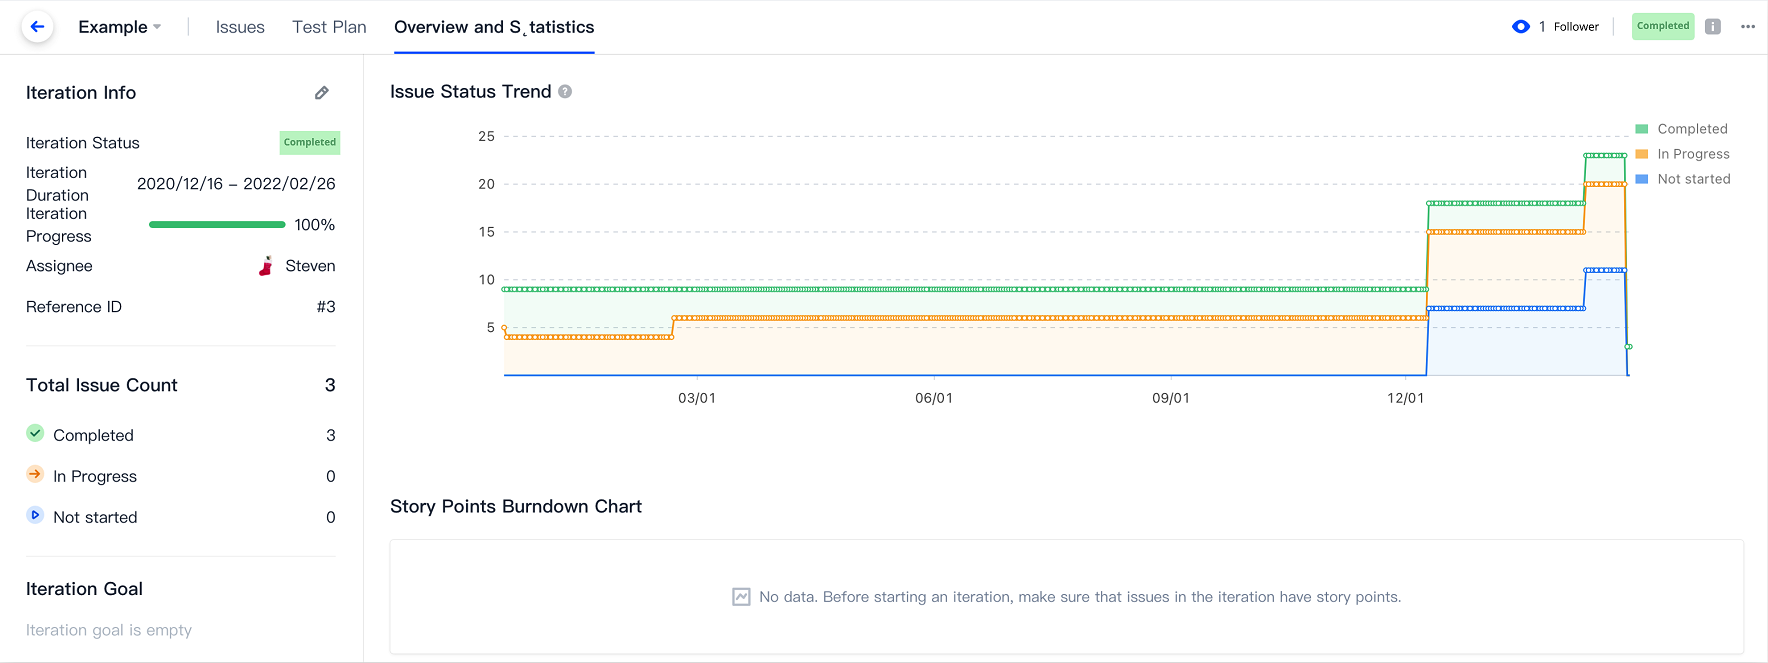
When the various iteration plans are in progress or have been completed, you can go to a specific iteration in the Iterations module to view the iteration information, issue statistics, issue status trend chart, story points burndown chart, and issue distribution diagram in Overview and Statistics, to stay on top of your team's progress for the iteration.
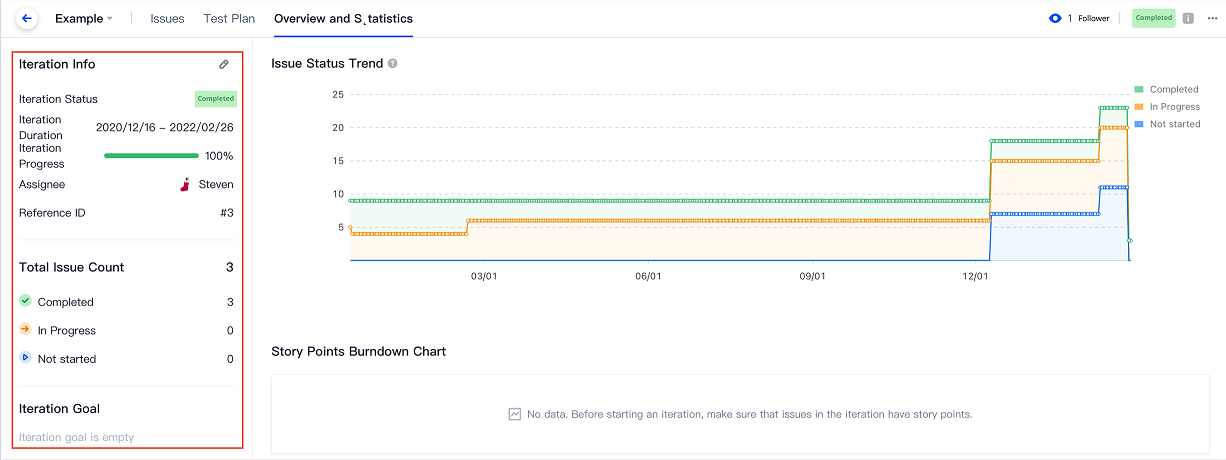
The iteration details on the left of Overview and Statistics show all information of the iteration. The Iteration Info includes the current iteration phase, iteration duration, progress, completed story points, and other information. In Issue Statistics, the total number of issues and number of completed issues in the iteration are shown.
The issue status trend chart in the upper-right corner of Overview and Statistics is a stacked area chart showing the change in issue status versus time, highlighting aggregate trends in issues for the development team. You can switch between issues in the dropdown menu. The different area colors indicate different issue statuses, helping teams manage issue progress and make the necessary adjustments to lagging issues.
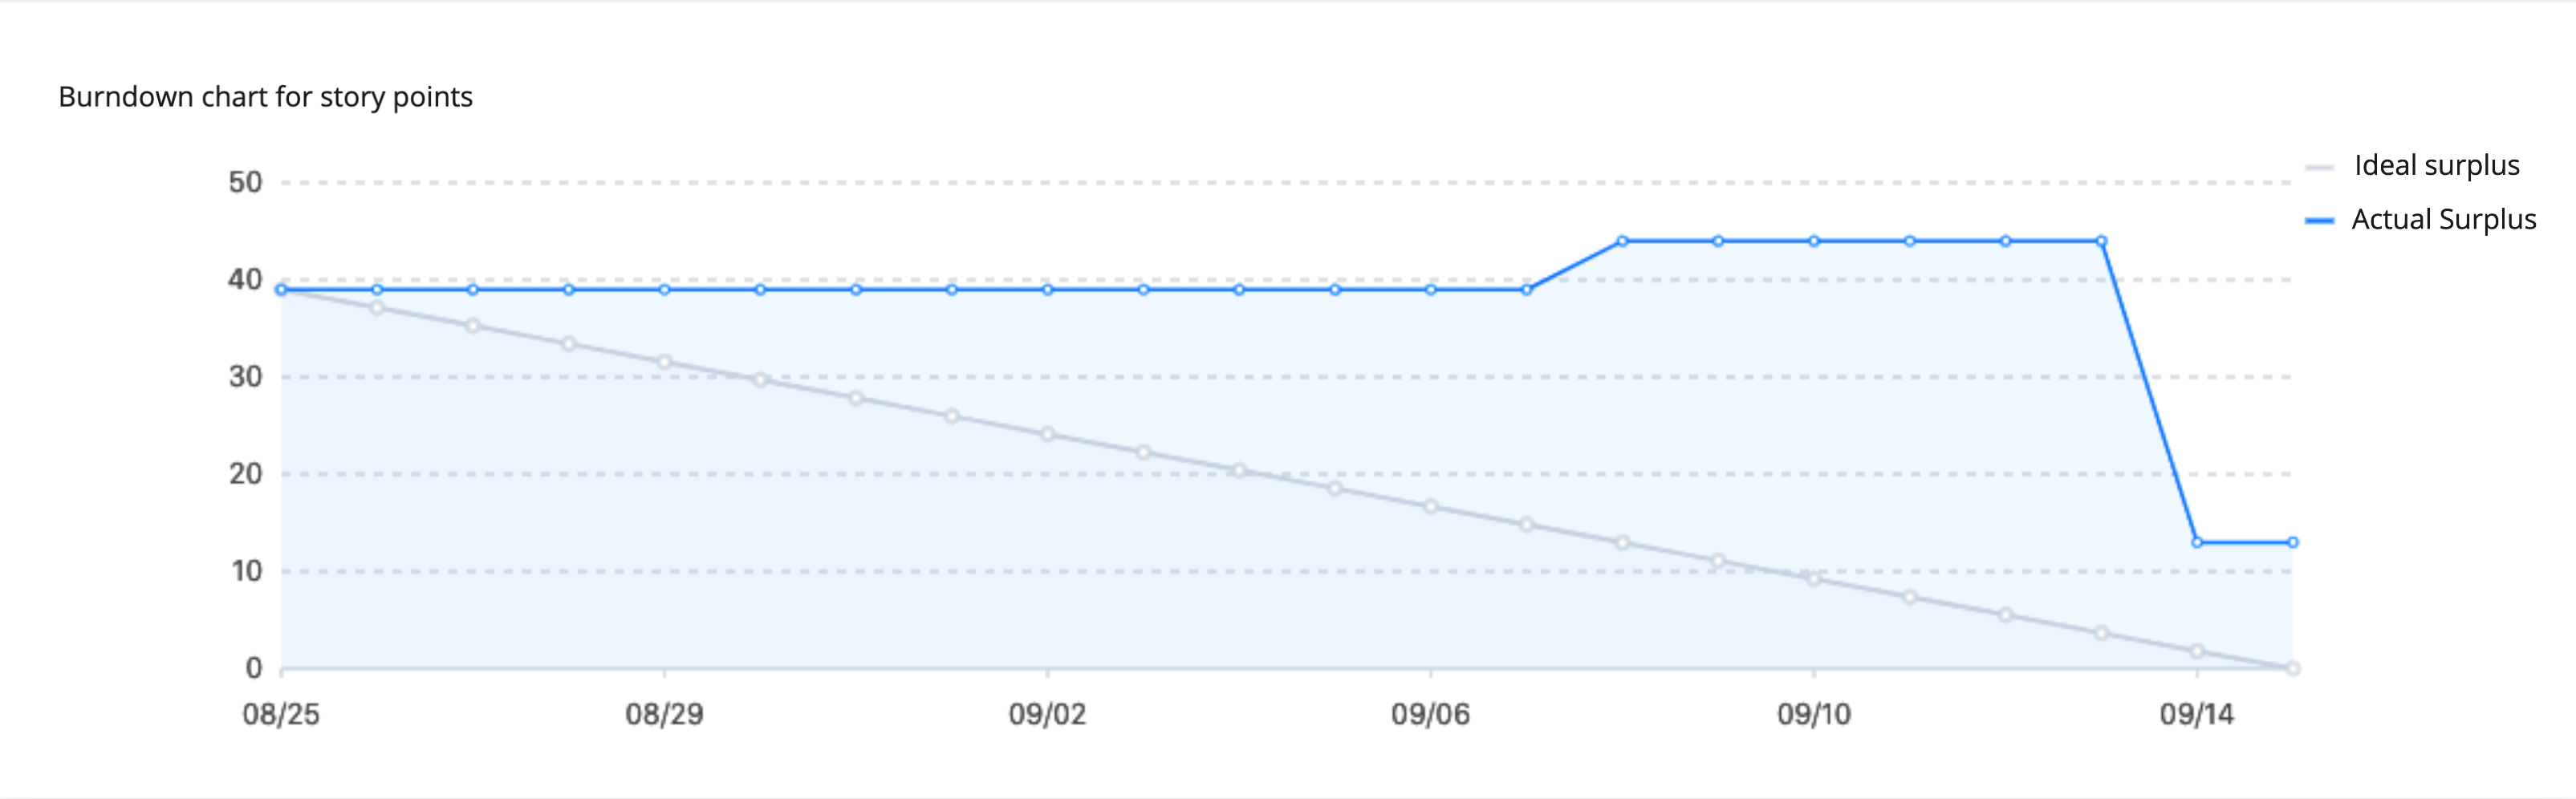
If the story point field was specified when an issue was created and the statuses of completed issues have been transitioned appropriately, the Story Points Burndown Chart in Overview and Statistics will show the remaining story points versus time. For more information, see Story Points.
The story points burndown chart starts a day before the iteration start time. The horizontal axis indicates time and the vertical axis indicates the remaining story points. The gray (ideal) line is the expected progress, and the blue (actual) line is the actual progress, and the remaining story points are computed every day. If you modify the iteration start time on the iteration details page, the start time of the story points burndown chart will be updated at the same time.
If the actual progress fluctuates, but remains below the expected progress in the mid to late stage, the issues are progressing smoothly and will likely be delivered on time.
If the actual progress remains above the expected progress constantly, the issues are behind schedule and are at risk of delay. You need to adjust the story points and iteration plan in time.
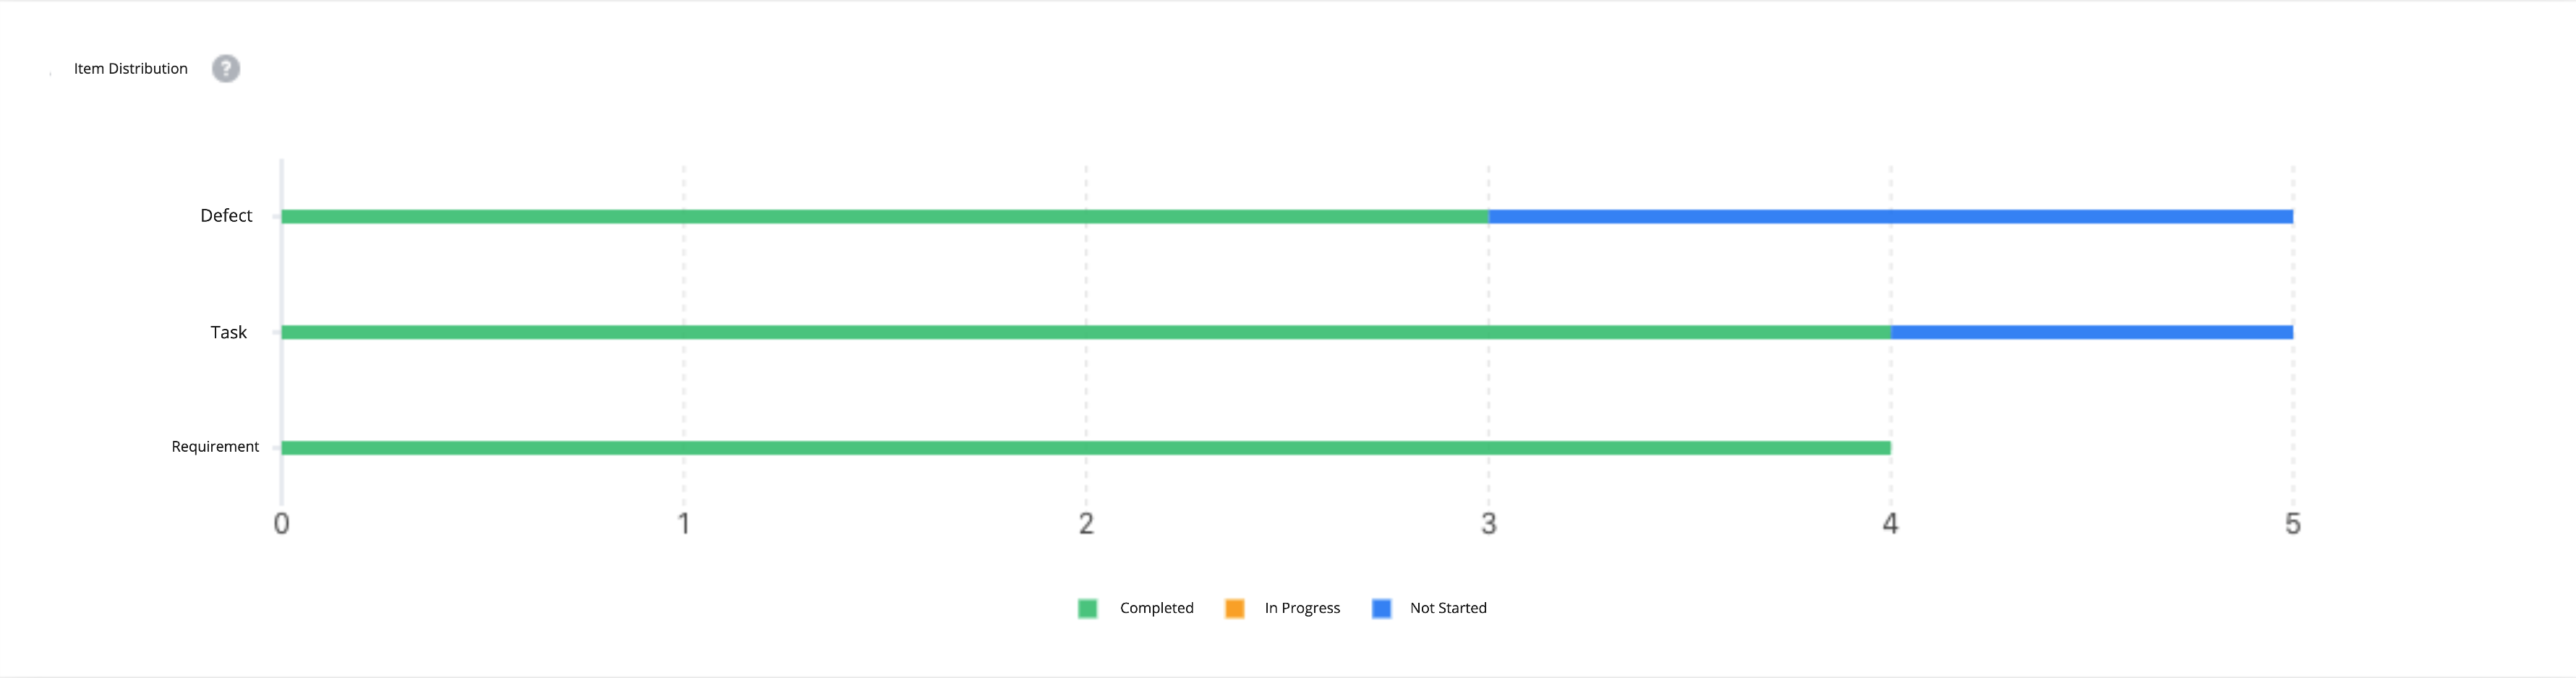
The issue distribution diagram is a horizontal histogram that displays the number of requirements, tasks, and bugs that are Completed, In progress, and Not started in the current iteration, so that teams can quickly get up to speed on the global project progress.


 Yes
Yes
 No
No
Was this page helpful?