Spark cost optimization practice
Download
Focus Mode
Font Size
Cost optimization is a continuous process. Due to the dynamic and ever-changing characteristics of big data, enterprise users should continuously perform cost optimization activities. This topic introduces related practices on how to perform cost optimization in Data Lake Compute (DLC) based on Spark computing resources. You can refer to the provided usage scenarios and apply optimization as needed.
How to Choose a Suitable Payment Method for Computing Resources?
DLC supports purchasing engines in pay-as-you-go and monthly subscription billing modes.
Resource Description | Pay-as-You-Go Computing Resources | Monthly Subscription Computing Resources | Elastic Computing Resources |
Fee Standard | 0.35 USD/CU x Hour Using 1 CU of resources for 1 hour is charged at 0.35 USD. Charges are calculated based on the actual CU usage. | 150 USD/CU x Month Using 1 CU of resources for 1 month is charged at 150 USD. | 0.35 USD/CU x Hour Using 1 CU of resources for 1 hour is charged at 0.35 USD. Charges are calculated based on the actual CU usage. |
Payment Method | Postpaid | Prepaid | Postpaid |
Features | 1. Users can flexibly choose when to use resources. When users do not use pay-as-you-go resources, they can choose to suspend (release) the resources. No charges will be incurred after suspension. 2. Pay-as-you-go resources are allocated to a user only when the user starts a cluster to run tasks. Once these resources are allocated, they are exclusively available to the current user. However, due to limitations in the resource pool, there may be a situation where resources are insufficient and no pay-as-you-go resources are available for allocation. | 1. Resources are allocated to users for exclusive use upon purchase. Therefore, there will be a situation where resources are unavailable for allocation. 2. Resources are available at any time. Meanwhile, additional elastic resources can be purchased, and they are charged based on the actual usage. | 1. Elastic computing resources are additional pay-as-you-go resources activated on the foundation of having purchased a monthly subscription Spark cluster. 2. Elastic resources can accelerate task execution and reduce the entire system load when necessary. At the same time, when there are few tasks, elastic resources are automatically released and no charges are incurred, effectively reducing costs. |
Recommended Scenarios | 1. POC testing phase 2. The usage duration per month does not exceed 18 days. | 1. Official production environment 2. Data computing scenarios with a large and stable workload 3. If the usage duration exceeds 60% of the total duration in 1 month, using the monthly subscription is more cost-effective. | 1. Official production environment 2. Purchased monthly subscription computing resources run tasks, but the completion time of the tasks does not meet expectations. |
Whether Payment Method Switchover is Supported | Yes | No | No |
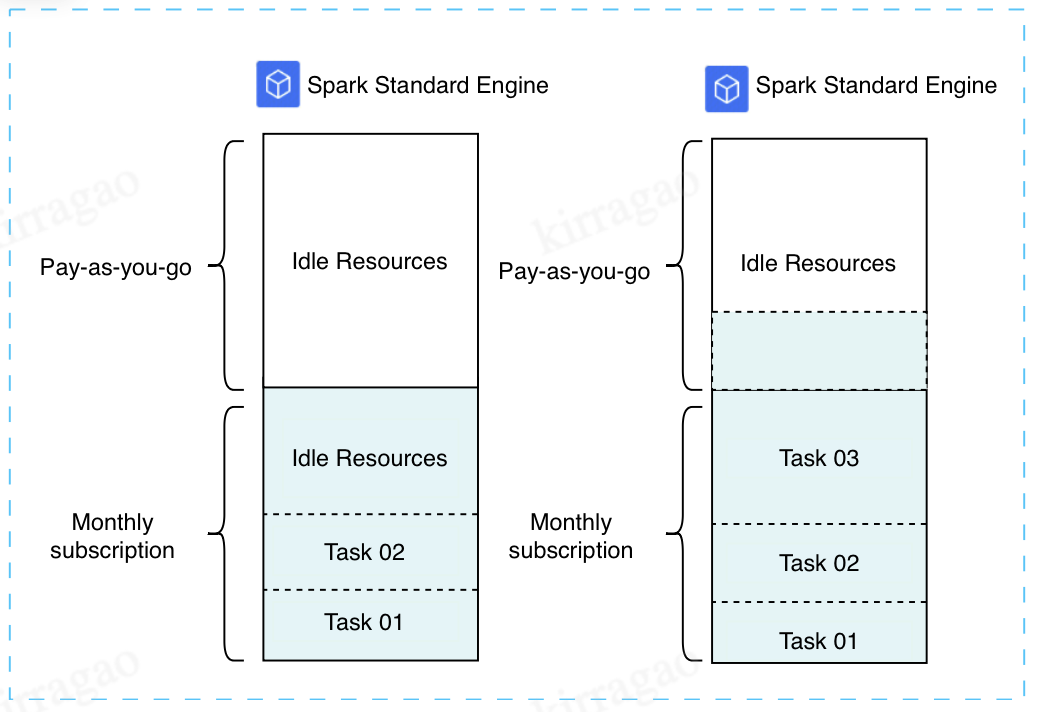
Scenario: Task Completion Time Fails to Meet Expectations Due to Insufficient Monthly Subscription Computing Resources
An e-commerce platform has purchased 128 CUs of monthly subscription computing resources to ensure the completion and result returns of 600 analysis tasks on the promotion day.
With the arrival of the major e-commerce promotion, the data volume surged. It was found that the time efficiency of task completion could not be guaranteed during this period. Through analysis, it was concluded that the currently purchased resources could not meet the data processing requirements during the major promotion period, leading to task queuing and thus delaying progress. To address this issue, the enterprise is seeking a solution that can guarantee the timely completion of tasks in the short term while keeping costs within a reasonable range.
Recommended Solution:
During the major promotion period, an additional 128 CUs of elastic computing resources are purchased on top of the existing 128 CUs of monthly subscription computing resources. According to the task load situation, when all the 128 CUs of monthly subscription computing resources are in use, the elastic resources are triggered to enhance the operation efficiency. After the major promotion ends, the elastic feature is disabled to effectively control the cost investment.
Low workload: Pay-as-you-go elastic resources are automatically released, and no charges are incurred, effectively reducing costs.
High workload: Pay-as-you-go elastic resources can speed up task execution when necessary. You pay for what you use.
Activation Steps:
1. Enter the SuperSQL Engine page and find the monthly subscription engine that needs to be configured with elastic computing resources.
2. Click Spec configuration in the operation column.
3. Enable the elastic computing resources switch and select the elastic configuration specifications.
Note:
The elastic computing specification cannot exceed the monthly subscription specifications.
4. After the major promotion ends, normal task operations are resumed. You can click Spec configuration to disable the elastic cluster feature.
How to Reasonably Plan the Allocation of Computing Resources?
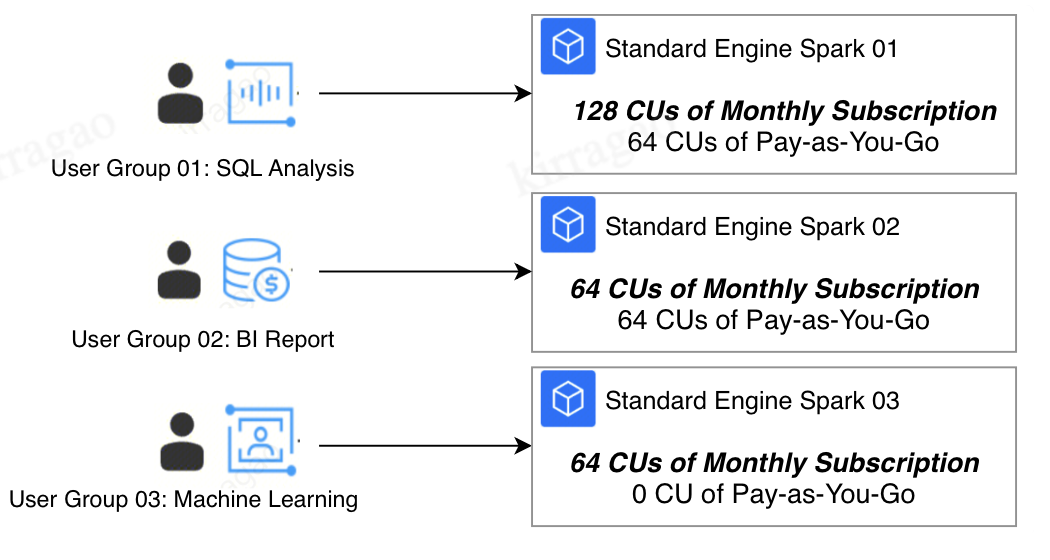
Method 1: Allocating Computing Resources Through Multiple Engines
Multiple computing resources are purchased and allocated to different user groups or feature scenarios. Each computing resource runs tasks independently.
Strengths | Resources are completely isolated among different engines, and the resources of each engine are exclusively available to the current user group. The configurations, management, tasks, and failures of different user groups do not affect each other. |
Applicable Scenarios | 1. Multiple departments need to use the platform, but there is no business overlap among them. These mostly occur in independent business analysis scenarios. 2. Enterprises have relatively high requirements for cost auditing and security Ops. |
Limitations | Resources may experience idle periods, making it unable to maximize utilization. As shown in the figure, User Group 01 primarily conducts SQL analysis and uses resources between 9 am and 5 pm, leaving resources idle at other times. Solution: Switch the computing resources to pay-as-you-go resources and adjust the resource allocation method. |
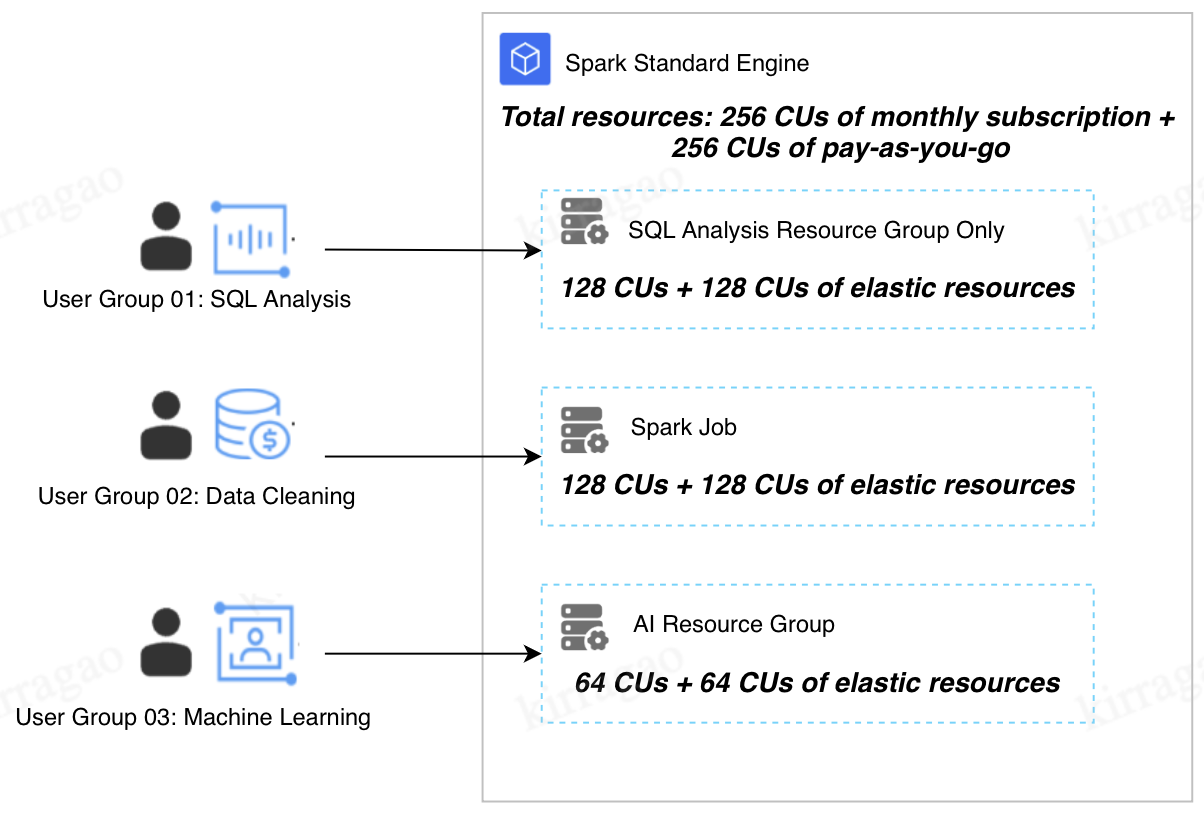
Method 2: Allocating Resources Through Resource Groups with an Engine
In this method, all user groups or feature scenarios share the same engine, but each user group uses resource groups with different configurations to allocate resources.
Strengths | Computing resource utilization can be maximized. |
Applicable Scenarios | 1. There are relatively high requirements for cost control. 2. A small number of resource groups need to be configured, and most of the tasks are linear startup tasks, while a few are concurrent tasks. 3. The running times of tasks do not overlap significantly, and the computing workload consumed by overlapping tasks does not exceed the total resource amount. |
Limitations | Resource competition may occur among different resource groups. As shown in the figure, when all 3 user groups are using resources, if User Group 01 occupies 256 CUs of resources and User Group 02 also occupies 256 CUs of resources, it means that all resources in the engine are occupied at this point. In this case, no resources can be allocated to User Group 03. As a result, User Group 03 cannot run tasks. Solution: Add computing resources and adjust the resource group configurations and allocation method. |
Scenario: Reasonably Plan Time-Sharing Running of Tasks to Maximize Resource Utilization
An enterprise currently needs to purchase computing resources and allocate them to 3 departments for interactive SQL analysis and batch Spark job tasks. With relatively high requirements for cost control, the enterprise hopes the sales team can recommend a reasonable purchase solution. This solution needs to ensure that resources are reasonably allocated to the 3 departments for use and no task failures occur, on the basis of maximizing resource utilization.
Recommended Solution:
1. For interactive SQL tasks, the running time, minimum number of resources, and elasticity of interactive resource groups need to be assessed based on the number and complexity of tasks to be run per day.
After analysis, the department concludes that interactive SQL tasks need to run from 9 am to 5 pm daily. Based on the maximum concurrency quantity and resource requirements of SQL tasks, it is determined that the resource group needs the maximum specifications of 128 CUs. Resource usage can be configured from 4 CUs to 128 CUs, where 4 CUs is the minimum resource usage of the resource group.
2. For job tasks, the required resources need to be assessed based on the time efficiency of task execution.
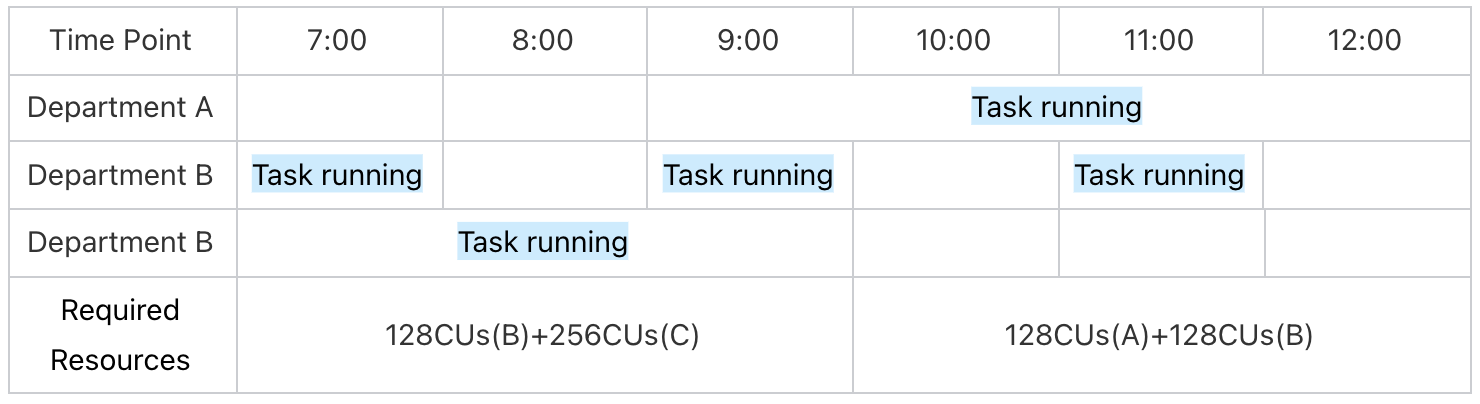
For example, in this enterprise, Department B has a scheduled task that runs once per hour. If this task needs to be completed within the current hour, at least 128 CUs of resources are required to ensure timely completion. In this case, the resources for the job can be configured from 4 CUs to 128 CUs.
Department C also has a task that runs once a day. If this task only needs to run in the early hours and should be completed before 8 am, it requires 256 CUs of resources.
Here, we find:
The task running times of Department A and Department B overlap. Thus, you need to configure the maximum amount of resources available for the engine. The formula is as follows: 128 + 128 = 256 CUs.
The task running times of Department B and Department C also overlap. To ensure the tasks are completed on time, you need to configure the maximum amount of resources. The formula is as follows: 128 + 256 = 384 CUs.
Based on the daily running time and usage, the sales team provides the resource purchase suggestion "128 CUs of monthly subscription + 128 CUs of elastic billing".
How to Perform Cost Tracking?
Method 1: Achieving Cost Tracking Through Cost Allocation
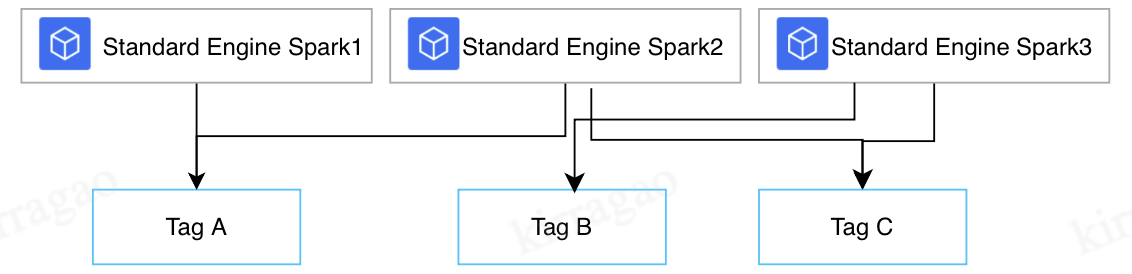
DLC supports cost allocation by tag in the engine dimension. By tagging engines, you can view cost allocation by tag in the Billing Center.
As shown in the figure, after different tags are assigned to engines, you can view the cost statistics of Engine 1 and 2 with Tag A, Engine 3 with Tag B, and Engine 2 and 3 with Tag C.
Note:
For details on how to tag an engine, see Associating Tag with Private Engine Resource.
For details on how to achieve cost allocation by tag, see Cost Allocation Tags.
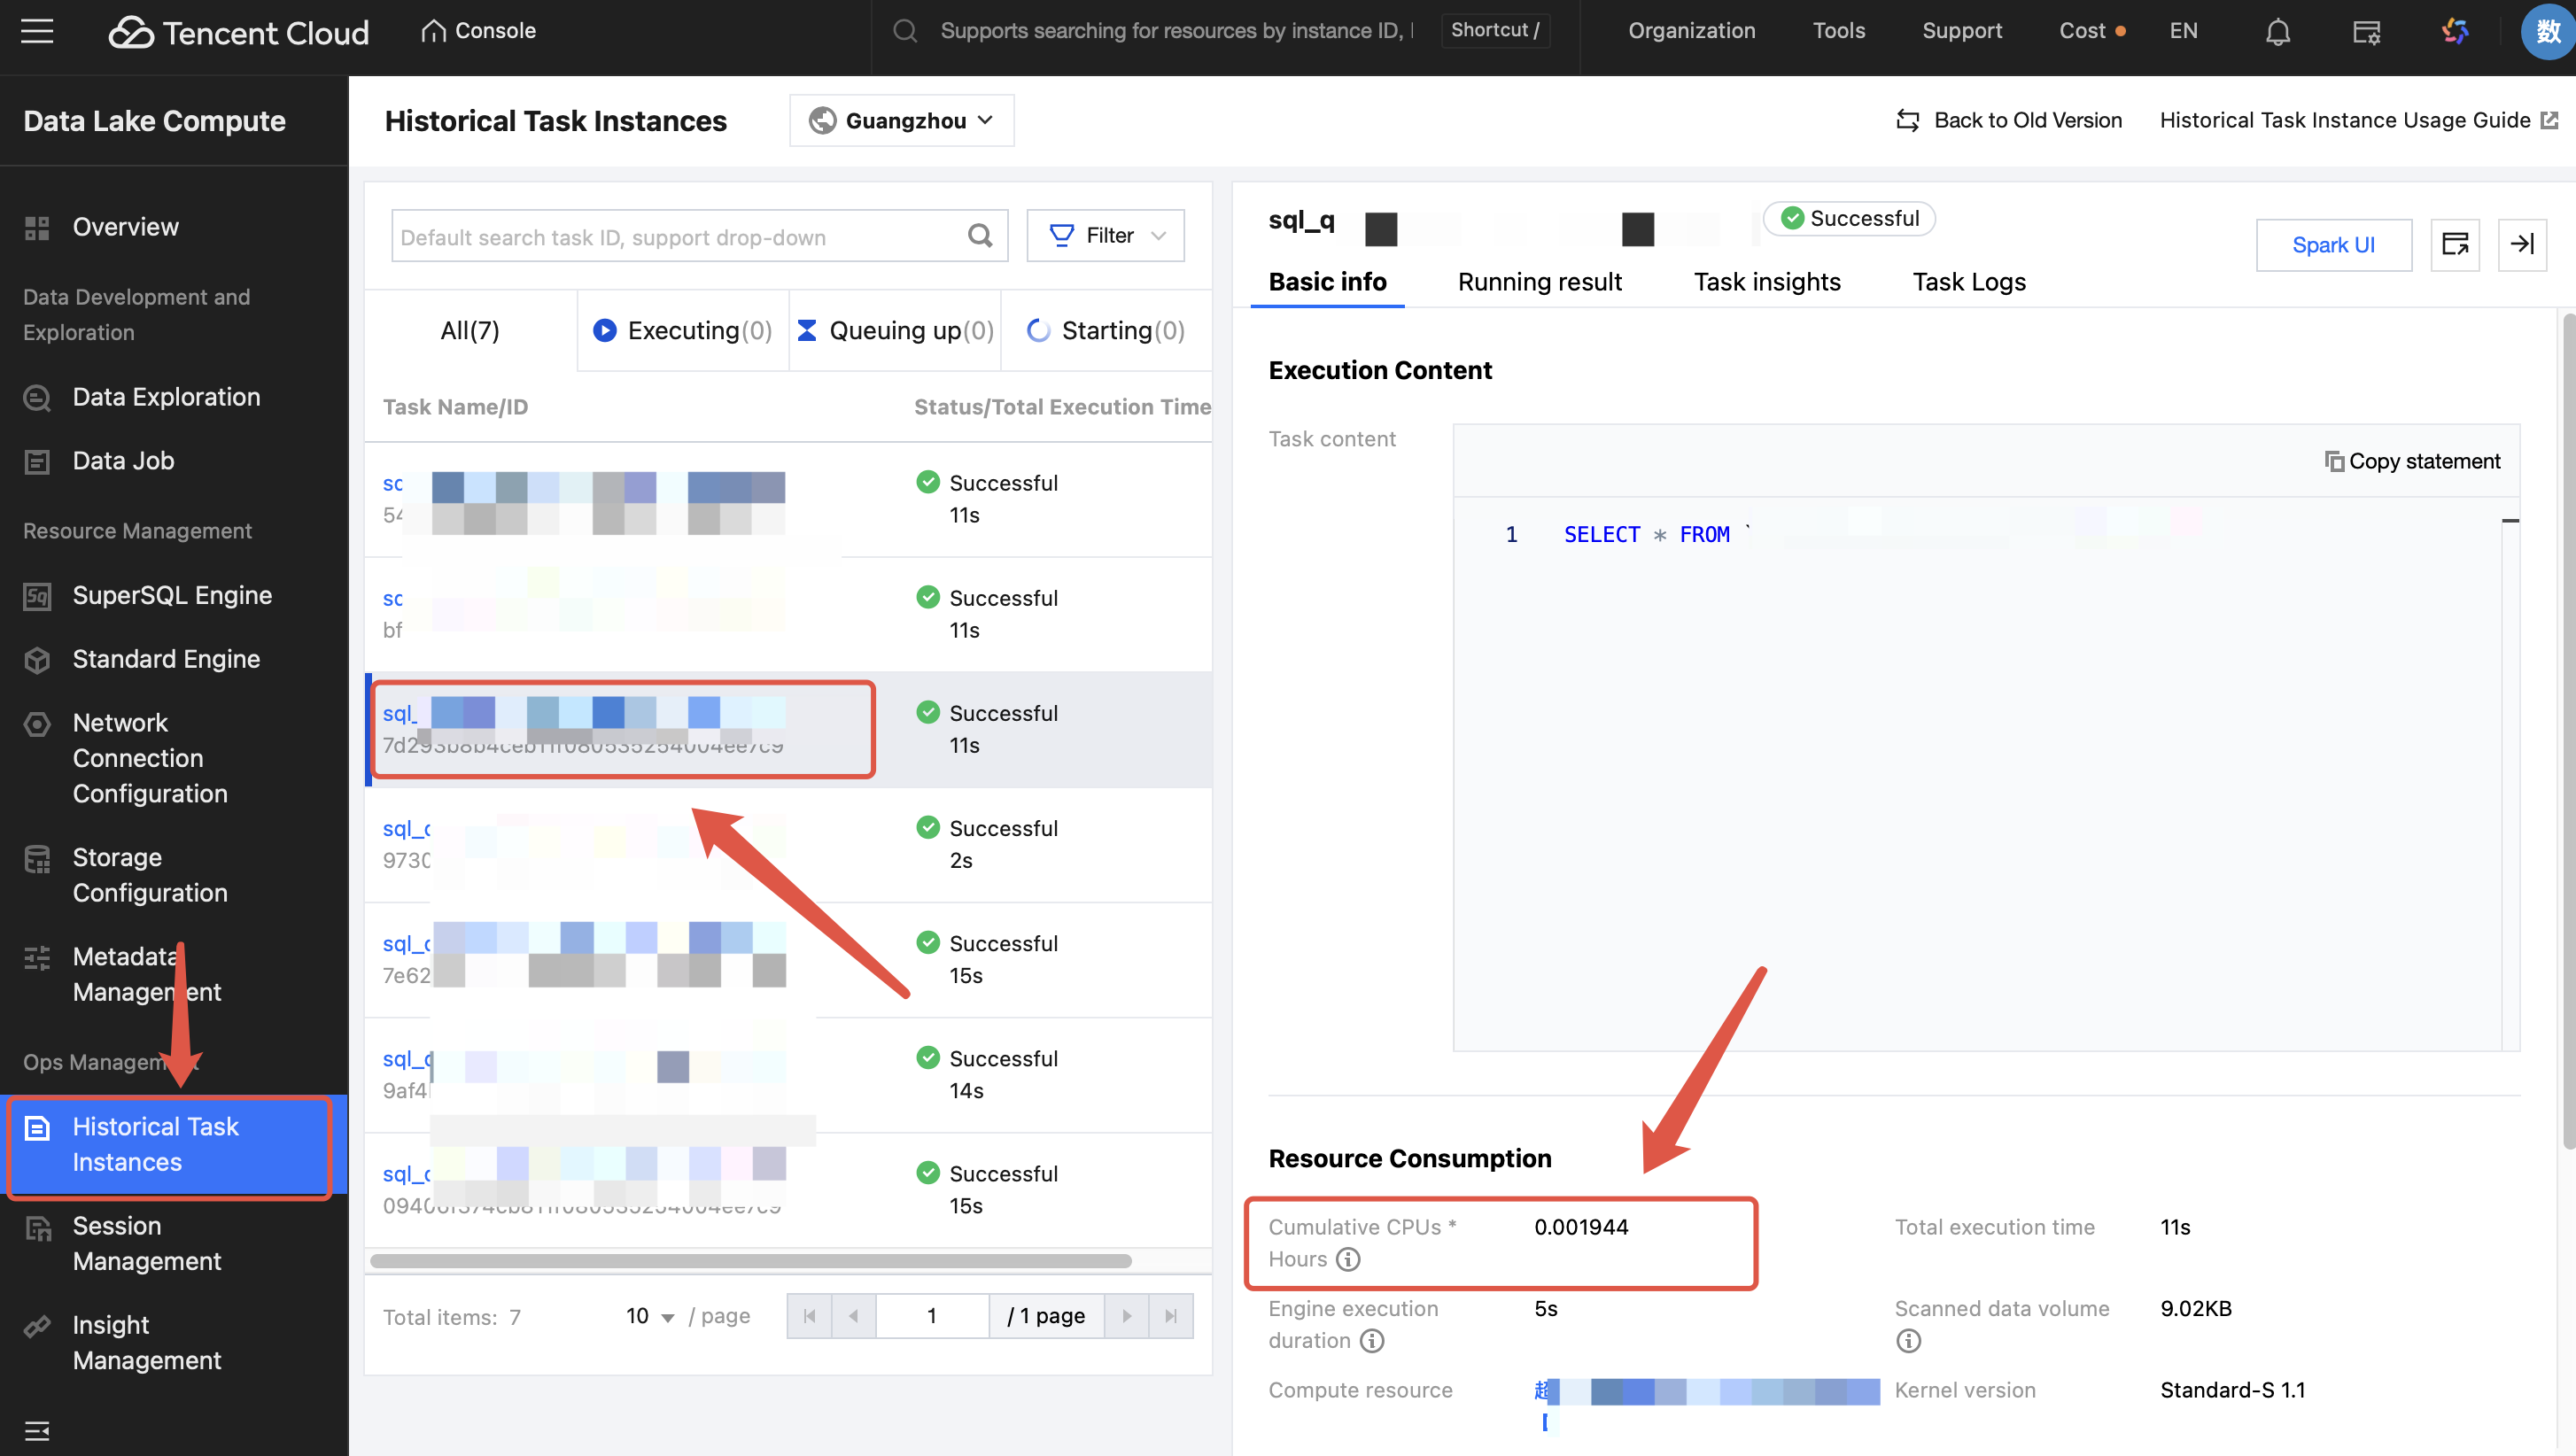
Method 2: Achieving Cost Tracking Through the Task Insight Feature
Enter the Historical Task Instances page of DLC and find the completed task. Click the task name/ID, then you can view the consumed CUs x hours of the task.
Note:
1. Consumed CUs x Hours: Specifies the sum of the CPU execution duration of each core of the Spark executor used in computing. The unit is CU x hour.
2. The resource consumption is the actual consumption generated by the resources occupied by this task. It does not include the statistics such as the resource startup time and idle time of the resource group. Therefore, the consumption value will be much smaller than the total consumption of the resource group and cannot be entirely consistent with the data on the billing side. This consumption value is recommended for analyzing the actual amount of resources used by a single task, for optimizing a single task, or for conducting cost analysis, such as analyzing the usage amount.
How to Perform Task Governance, Enhance the Time Efficiency of Task Completion, and Achieve Cost Optimization?
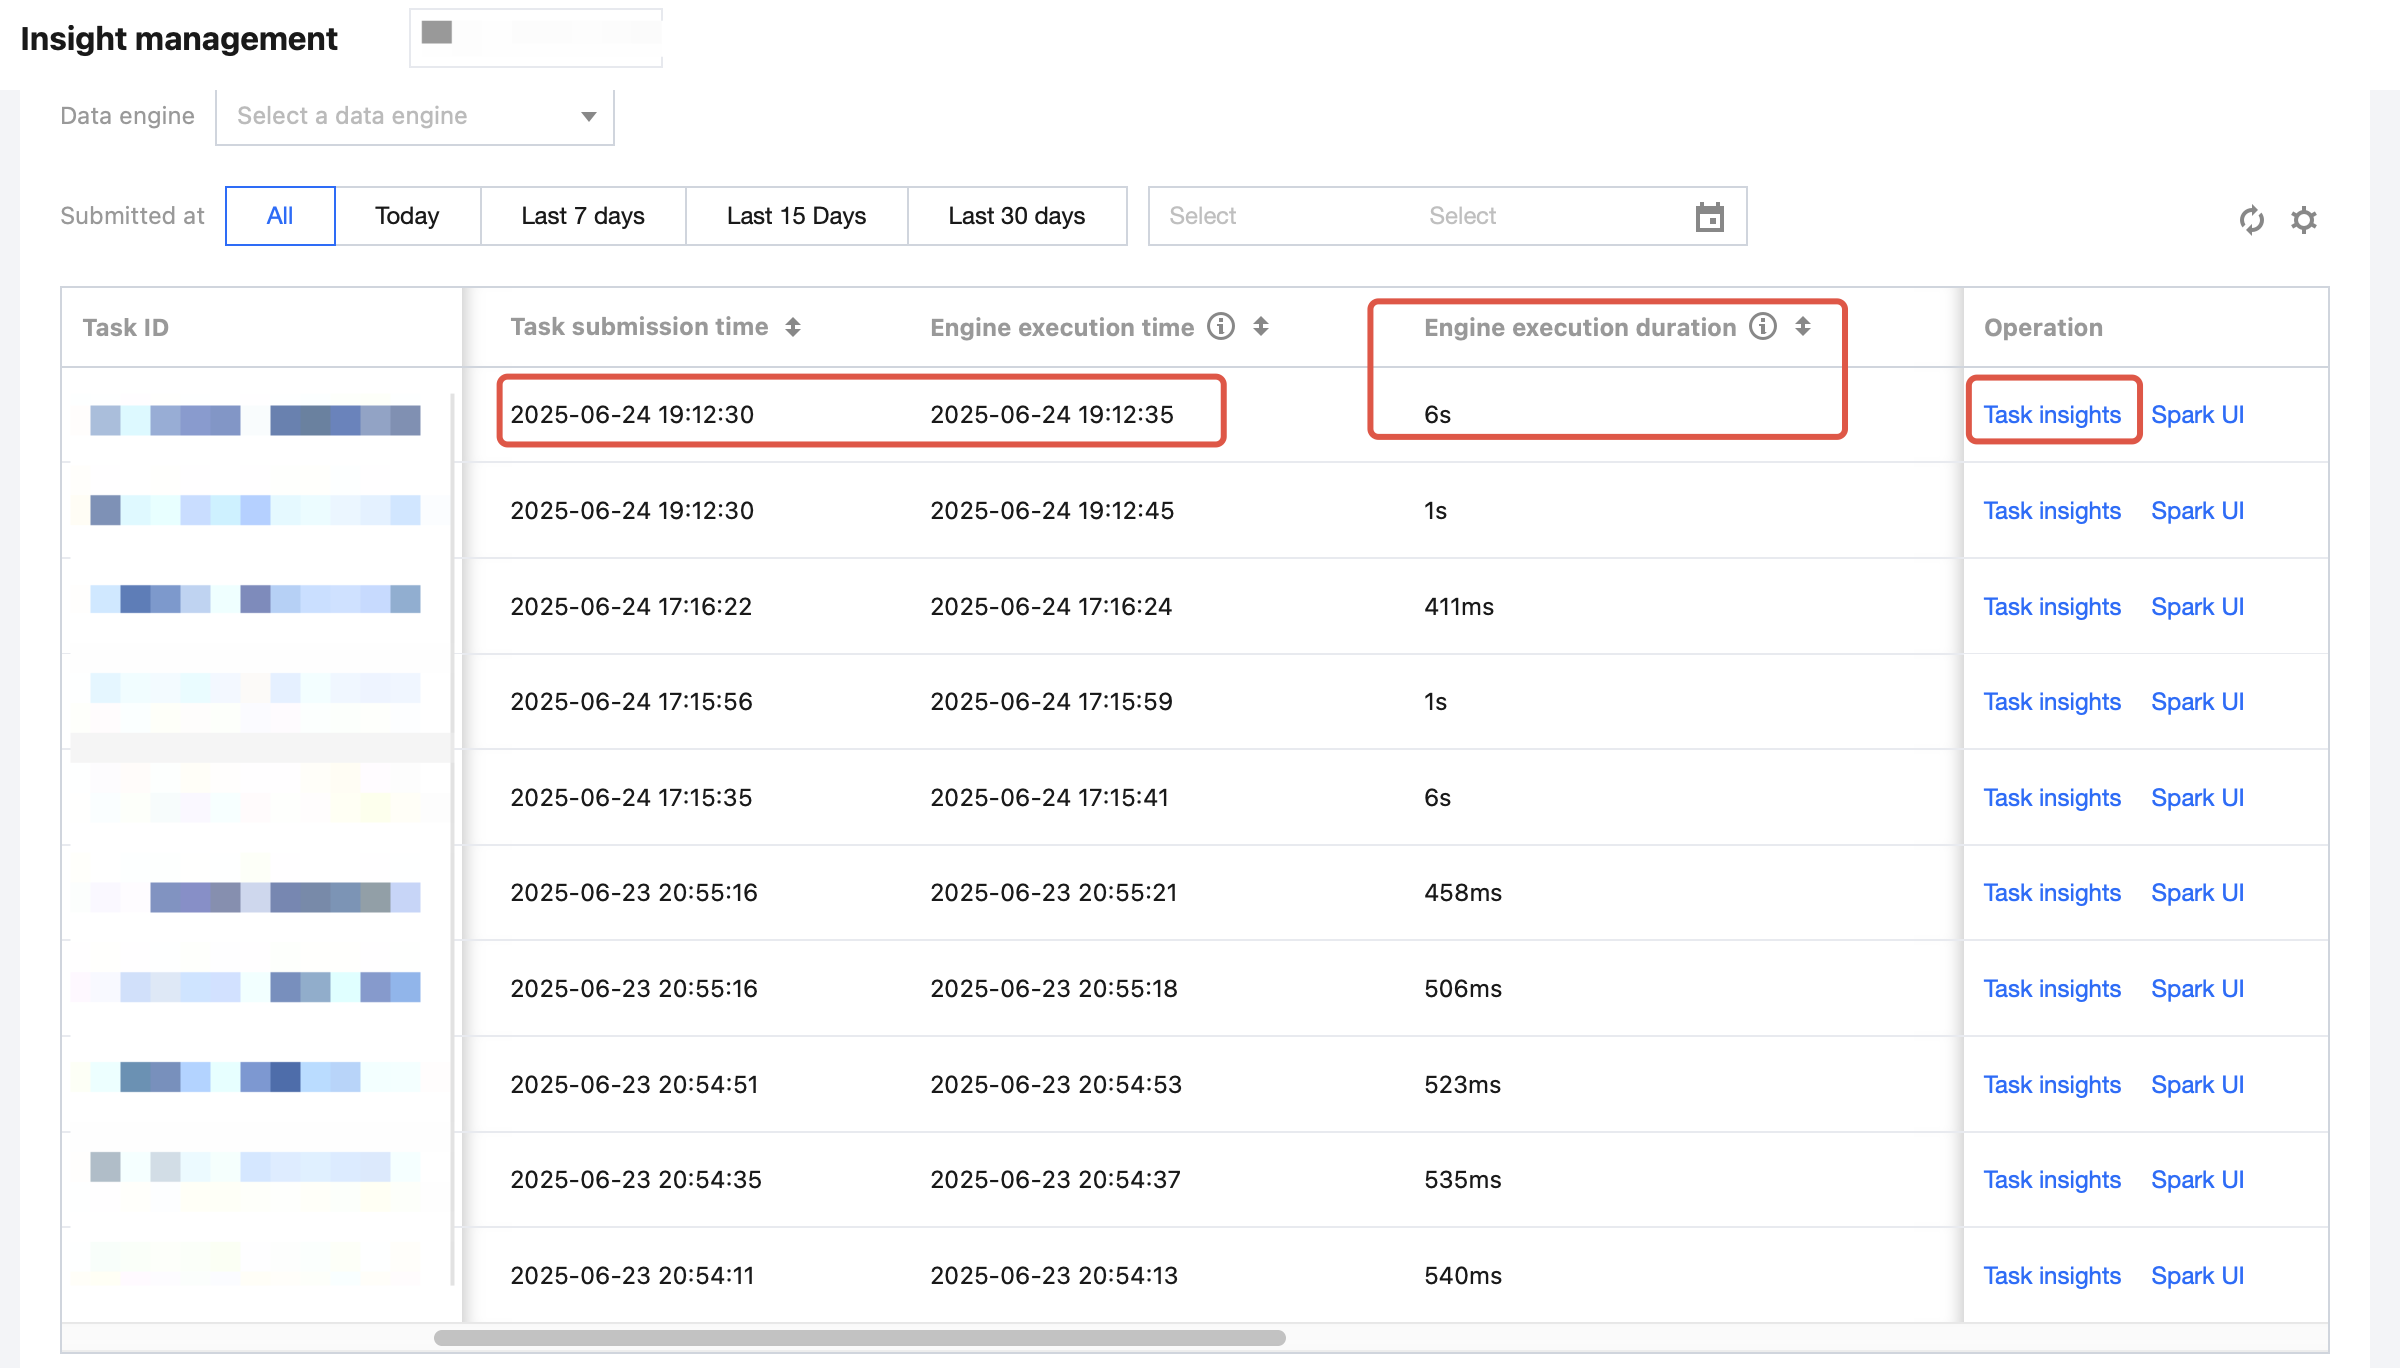
DLC Insight Management provides a visual and intuitive interface to help you quickly understand the current query performance and potential factors affecting performance, and obtain performance optimization suggestions. For details, see Task Insights.
Applicable Scenarios | 1. Insight analysis of the overall running condition of the Spark engine. For example, the resource preemption situation of each task running under the engine, the resource usage situation in the engine, the engine execution duration, the data scan size, and the data shuffle size are all intuitively displayed and analyzed. 2. Self-service troubleshooting and analysis of task running conditions. For example, numerous tasks can be filtered and sorted by time consumption to quickly find problematic large tasks and identify the reasons for slow or failed Spark task execution, including resource preemption, shuffle anomalies, and insufficient disk space, with clear positioning. |
Key Metrics | 1. Engine execution time: Reflects the time the first task was executed on the Spark engine (namely, the time when the task first preempted the CPU for execution). 2. Execution time within the engine: Reflects the time actually required for computing, namely, the time taken from the start of the first task execution in a Spark job to the completion of the Spark job. 3. Queuing time: Reflects the time taken from a job submission to the start of execution of the first Spark job. The time taken may include the cold startup duration of the first execution of the engine, the queueing time caused by the concurrent limit of the configuration task, the time spent waiting for executor resources due to full resources within the engine, and the queuing time caused by a lack of available resources for allocation to the resource group. 4. Consumed CUs * Hours: Specifies the sum of the CPU execution duration of each core of the Spark executor used in computing. The unit is CU x hour. |
Scenario 1: Automatically Analyzing Task Issues to Quickly Locate the Issues and Enhance the Time Efficiency of Task Execution
Inconsistent task quality levels make it difficult to operate and maintain numerous tasks, resulting in low utilization of cluster resources.
Slow task execution mainly results from factors including data skew, insufficient shuffle concurrency, and long-tail tasks that slow down the overall execution time. The DLC Task Insights feature supports analyzing some issues encountered during task execution and providing optimization solutions. When time is limited, prioritize finding the top large tasks for better optimization results.
1. For example, sort by engine execution time (or sort by consumed CUs x hours) and then filter out problematic tasks.
2. For example, since the Spark shuffle phase is a critical factor affecting task execution speed and overall cluster stability, targeted optimization for tasks with large shuffle data volumes can yield good results. Specific operations include sorting tasks by shuffle size, filtering out tasks with shuffle anomalies (even successful tasks may have shuffle retry situations internally), or conducting targeted optimization for top large tasks with large shuffle data volumes. All of these can benefit the overall cluster consumption performance.
Pay close attention to the following metrics:
Insight Type | Algorithm Description (Continuously Improving and Adding Algorithms) |
Resource Preemption | The delay time of an SQL execution task is greater than 1 minute after a stage submission, or the delay exceeds 20% of the total runtime (the threshold formula is dynamically adjusted based on task runtime and data volume). |
Shuffle Anomaly | Shuffle-related error stack information occurs during stage execution. |
Slow Task | The task duration in a stage is greater than twice the average duration of other tasks in the same stage (the threshold formula is dynamically adjusted based on task runtime and data volume). |
Data Skew | Task shuffle data is greater than twice the average shuffle data size of other tasks (the threshold formula is dynamically adjusted based on task runtime and data volume). |
Disk or Memory Insufficiency | Error stack information during stage execution includes OOM, insufficient disk space, or bandwidth limitation errors of Cloud Object Storage (COS). |
Excessive Small File Output | (The collection of this insight type requires upgrading the Spark engine kernel to a version after November 16, 2024) See the metric "Number of Output Small Files" in the list. The presence of excessive small file output is determined if one of the following conditions is met: 1. Partitioned tables: The number of small files written out by a partition exceeds 200. 2. Non-partitioned tables: The total number of output small files exceeds 1000. 3. Partitioned or non-partitioned tables: The total number of files written out exceeds 3000, and the average file size is less than 4 MB. |
Scenario 2: Analyze Resource Preemption Situations Rapidly Through Engine Insights, Reasonably Arrange the Number of Running Tasks, and Enhance the Time Efficiency of Task Execution
Slow execution does not necessarily mean slow computation. When cluster resources are limited, resource preemption is likely to occur among tasks. By using the Insight Management feature and considering the 2 metrics of execution time and queuing time in the engine, you can identify tasks that affect each other and reasonably adjust the task queuing plan.
As shown in the figure below, submitting a job does not necessarily mean the engine will start execution immediately. The time taken from a job submission to the start of execution of the first Spark job may include the cold startup duration of the first execution of the engine, the queuing time caused by the concurrent limit of the configuration task, the time spent waiting for executor resources due to full resources within the engine, and the time taken to generate and optimize the Spark execution plan.
When cluster resources are insufficient, the time spent waiting for resources at the preliminary stage is more obvious.
The Task Insights feature also supports automatic identification of resource preemption. Meanwhile, it allows for checking whether other concurrent tasks are preempting resources.
Help and Support
Was this page helpful?
You can also Contact sales or Submit a Ticket for help.
Help us improve! Rate your documentation experience in 5 mins.
Feedback