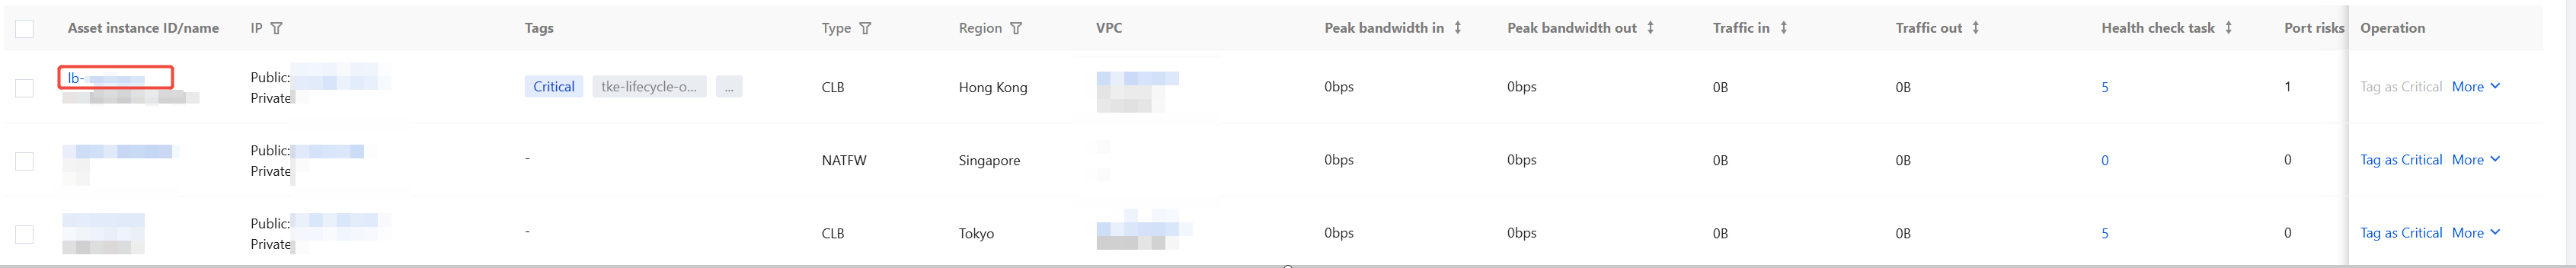
Log in to the CFW console. In the left-side navigation, click Asset Center > By assets types to go to the Asset List page. The asset list displays detailed information of six different types of assets, including host assets, public IP assets, domain assets, network assets, database assets, and other asset types. For specific asset classifications, see the table below.
Asset classification
Subcategory
English Name
Chinese Name
Host
-
CVM
CVM
LH
Lighthouse
CPM
CBM
ECM
Edge computing device
OTHER
Others
Public IP address
-
HAVIP
HAVIP
EIP
Elastic IP
IP
Public IP address
Domain name
-
DOMAIN
Domain name
Network
Gateway
NAT
NAT Gateway
VPN
VPN Gateway
NIC
ENI
ENI
VPC
VPC
VPC
Subnet
SUBNET
Subnet
Database
-
MySQL
TencentDB for MySQL
REDIS
TencentDB for Redis®
MARIADB
TencentDB for MariaDB
PostgreSQL
TencentDB for PostgreSQL
MangoDB
TencentDB for MangoDB
Others
-
CLB
CLB
NATFW
NAT Firewall
PROBE
probe
View Asset Details
1. In the asset list, click Asset instance ID/name to jump to the detail page of that asset.
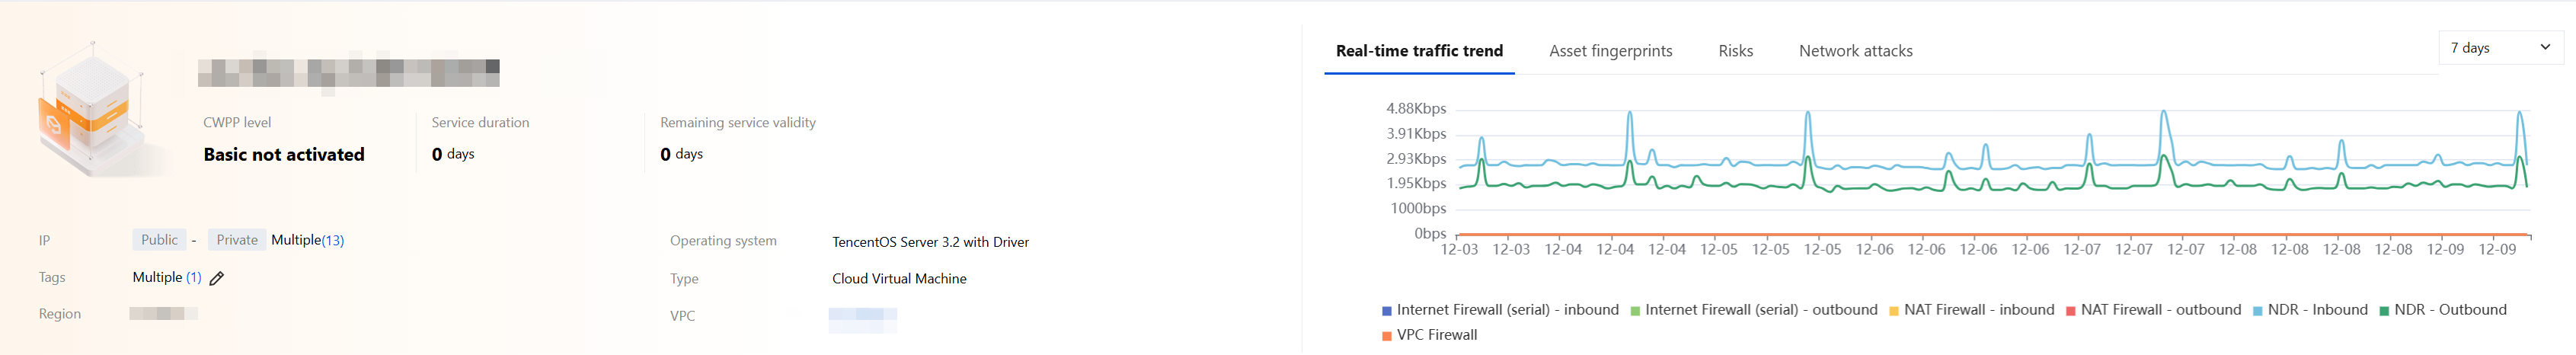
2. Taking host assets as an example. On the host asset details page, the left panel displays detailed information including the asset instance name, protection status, IP address, and resource tags. The right panel shows graphical representations of real-time traffic trends, asset fingerprint statistics, risk trends, and network attack trends for the asset.
3. At the bottom of the page, you can view the component services, risk management, and information about network attacks for this host asset.
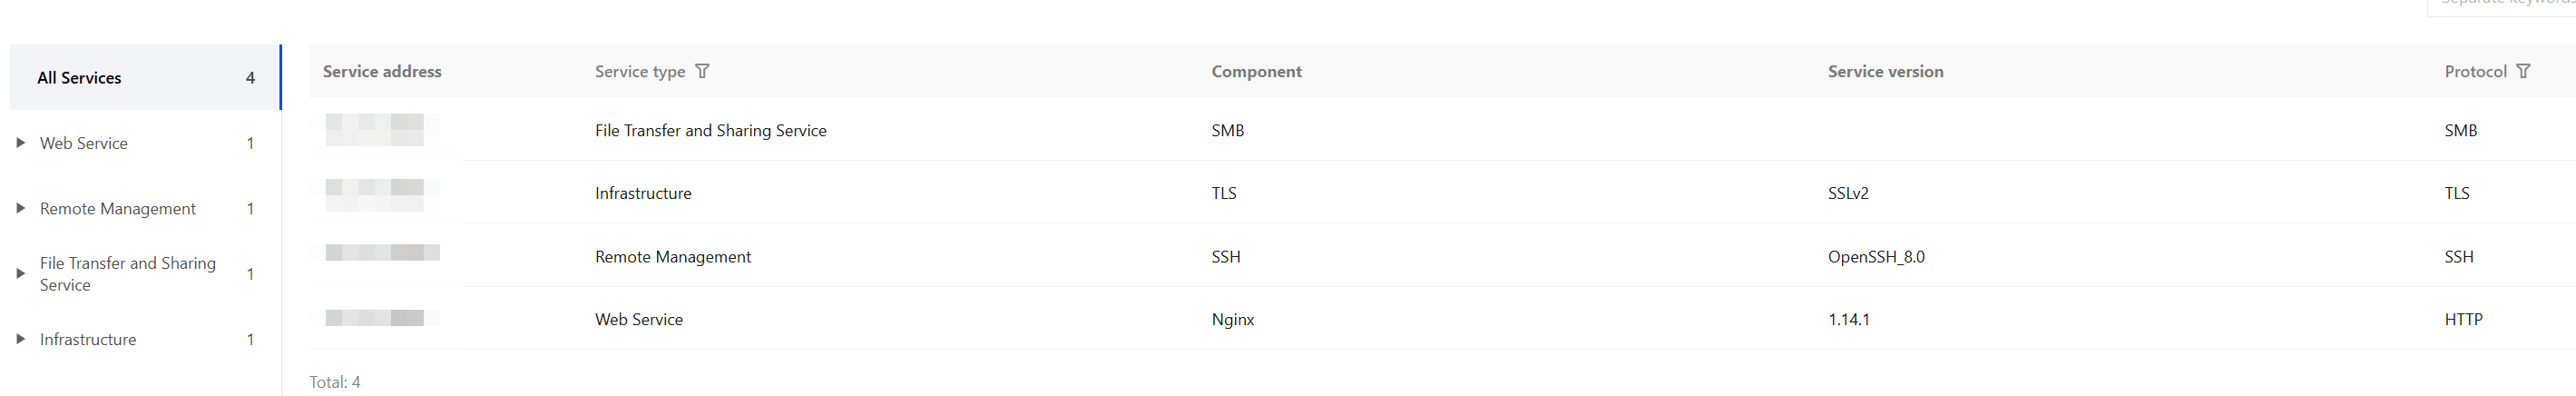
Components Service of Asset
After the Network Detection and Response traffic parsing feature is enabled, the system supports accurately identifying asset components and service types within network traffic, providing support with multi-dimensional data for traceability analysis of security events.
Note:
To enable this feature, ensure that the Network Detection and Response switch is enabled for this asset. For specific operations, see Network Detection and Response switch.
On the asset details page, click Component Service to view all service lists associated with this asset and their detailed parameters.
Risks Management of Asset
On the asset details page, click Risks. Click search box and enter keywords to filter and locate risks.
Note:
Taking port risks as an example, the system displays unhandled risks by default.
Tag Status
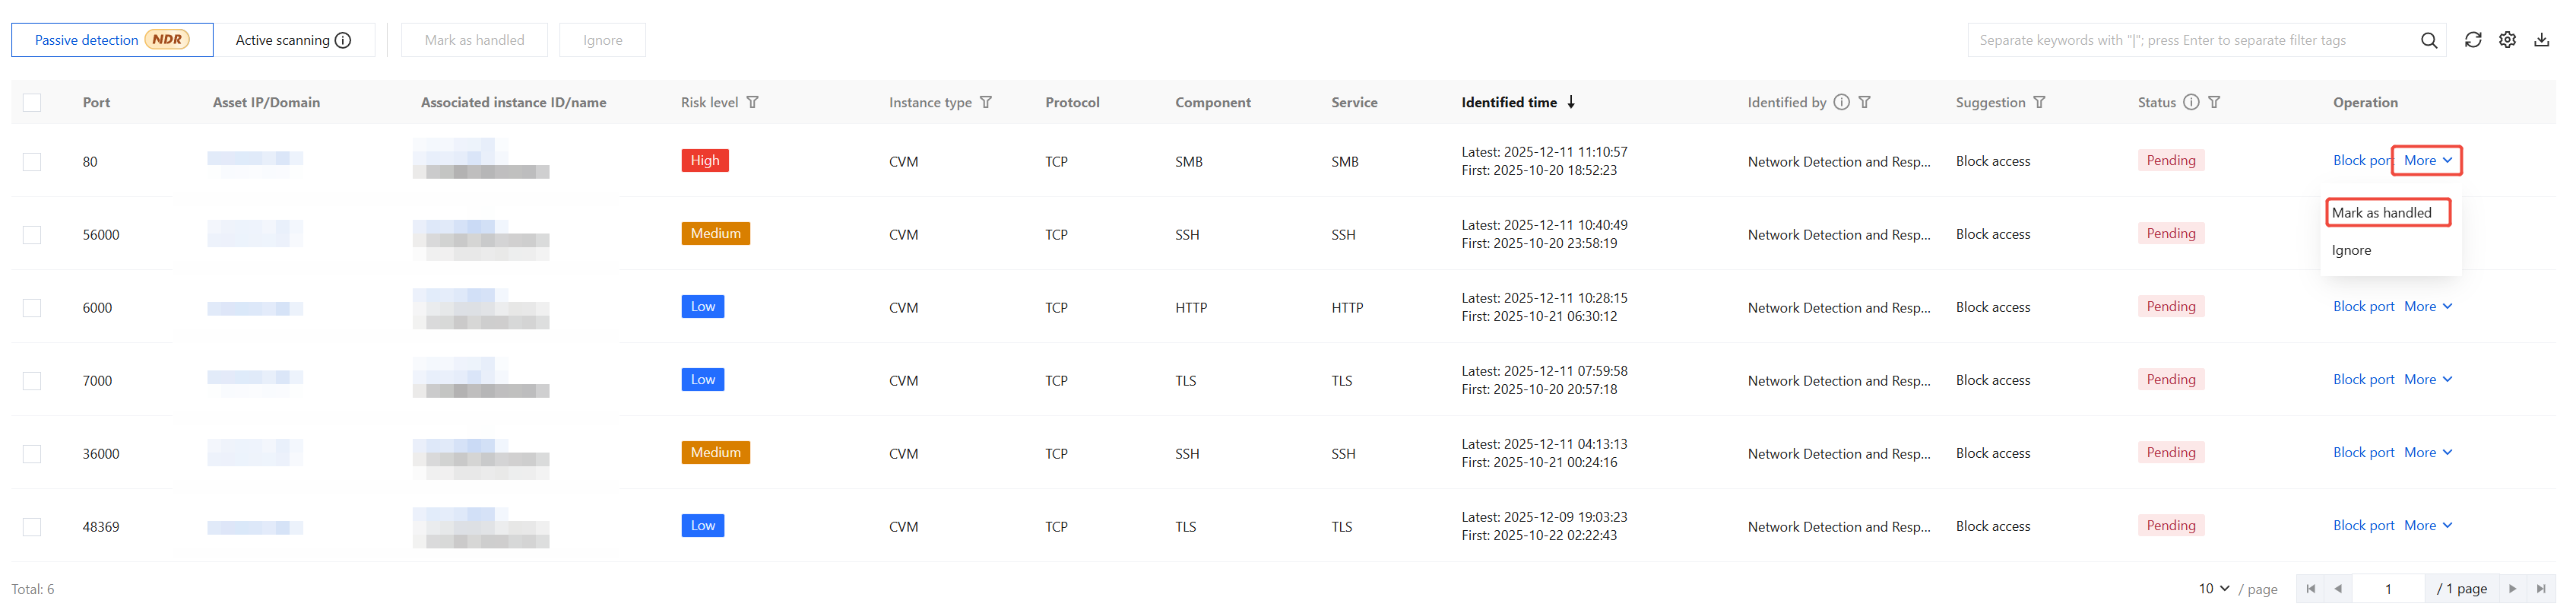
Mark as Handled
It is recommended to use CWPP and CFW to implement defensive measures such as blocking against security risks. Risks that have been mitigated through defensive actions can be marked as Handled, and their processing status will be updated to Handled. If the same risk is detected again in subsequent scan tasks, the processing status will revert to Unhandled.
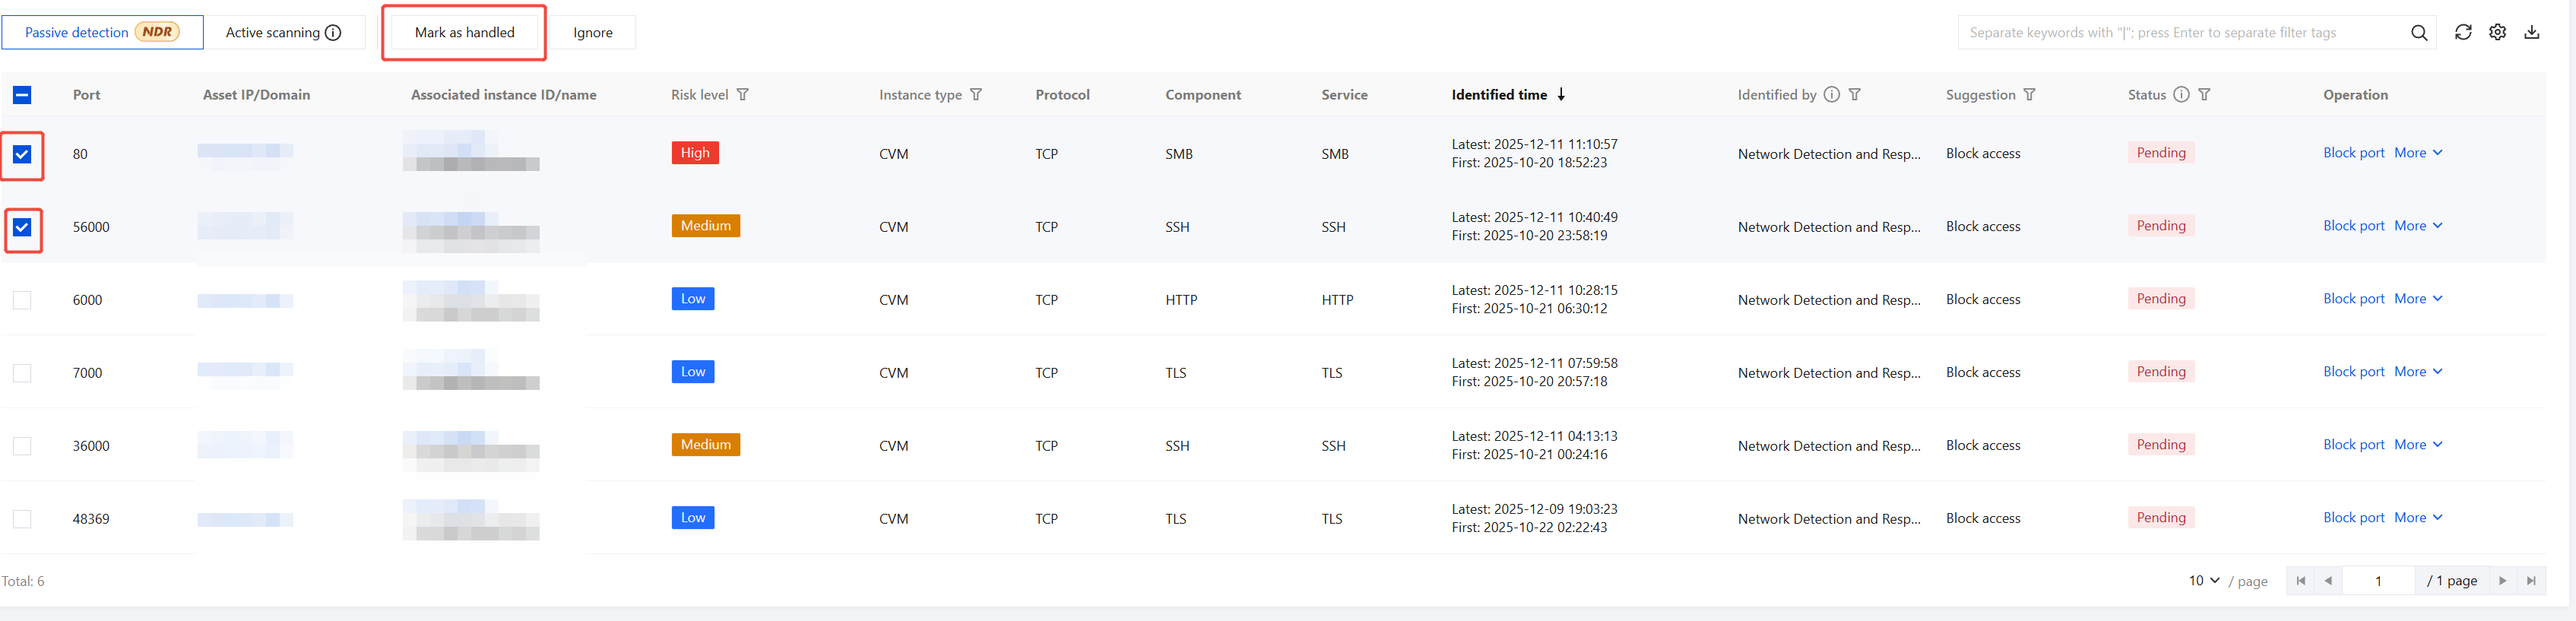
1. Supports marking risk status as Handled individually or in batches.
Single: Select the target risk, click Mark as Handled in the operation column or More > Mark as Handled.
Batch: Select multiple risks and click Mark as Handled.
2. In the confirmation window, click OK to mark the target risk as Handled.
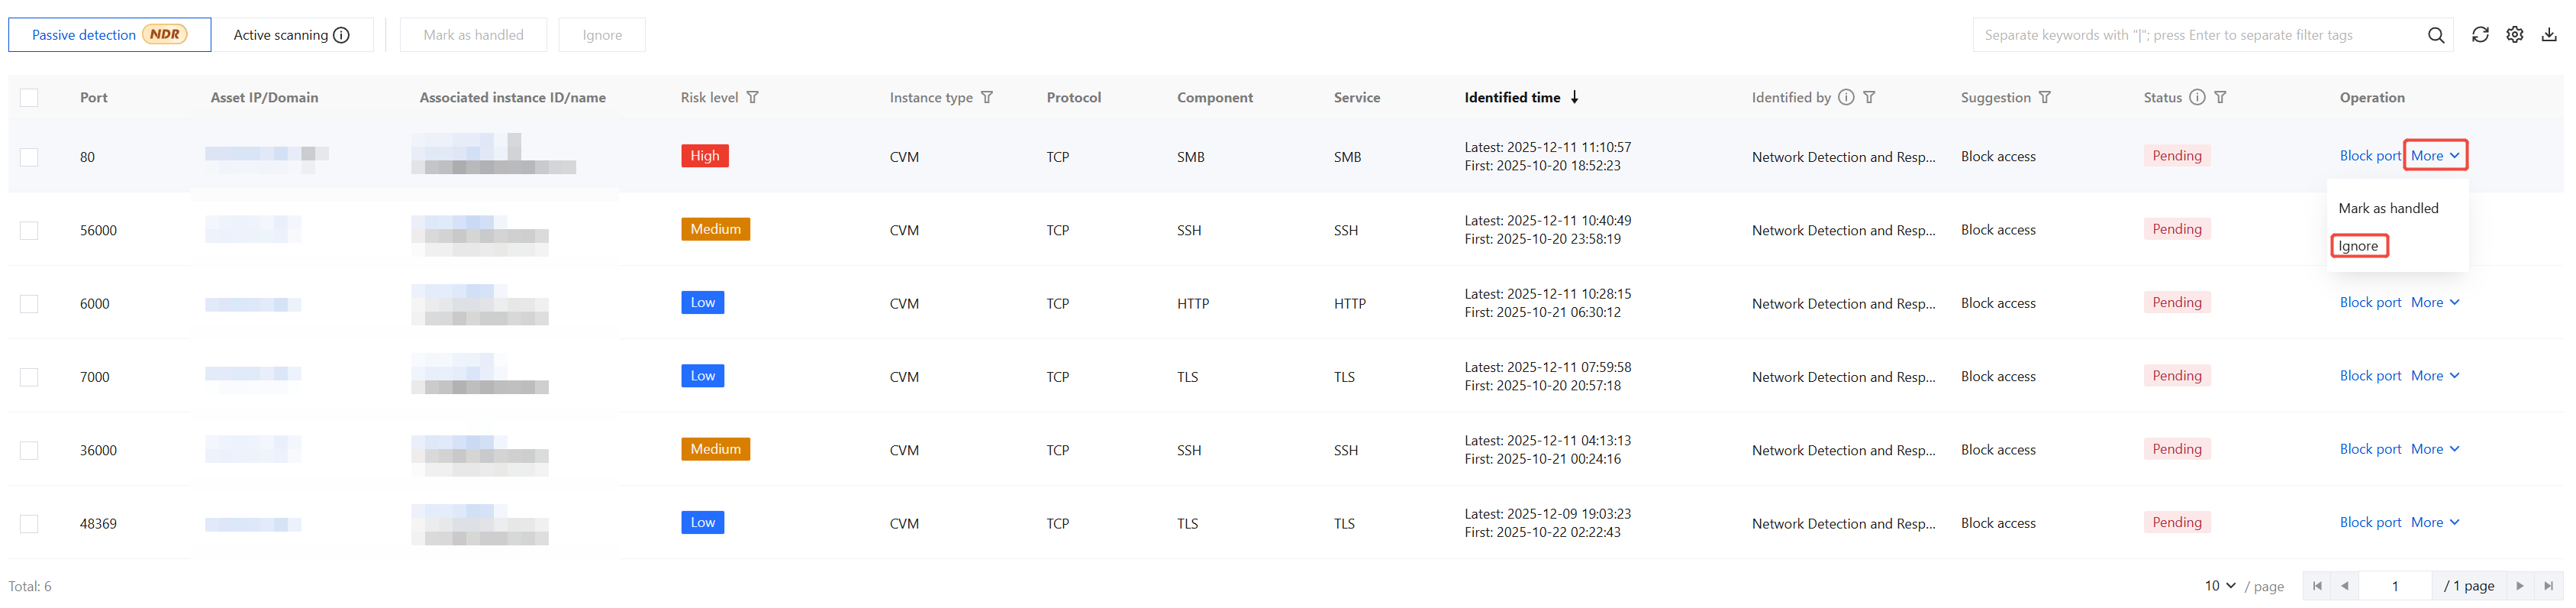
Mark as Ignored
When scan false positives result in risk false positives or when a risk is deemed unnecessary to handle, it can be ignored and will be filtered in subsequent scan tasks.
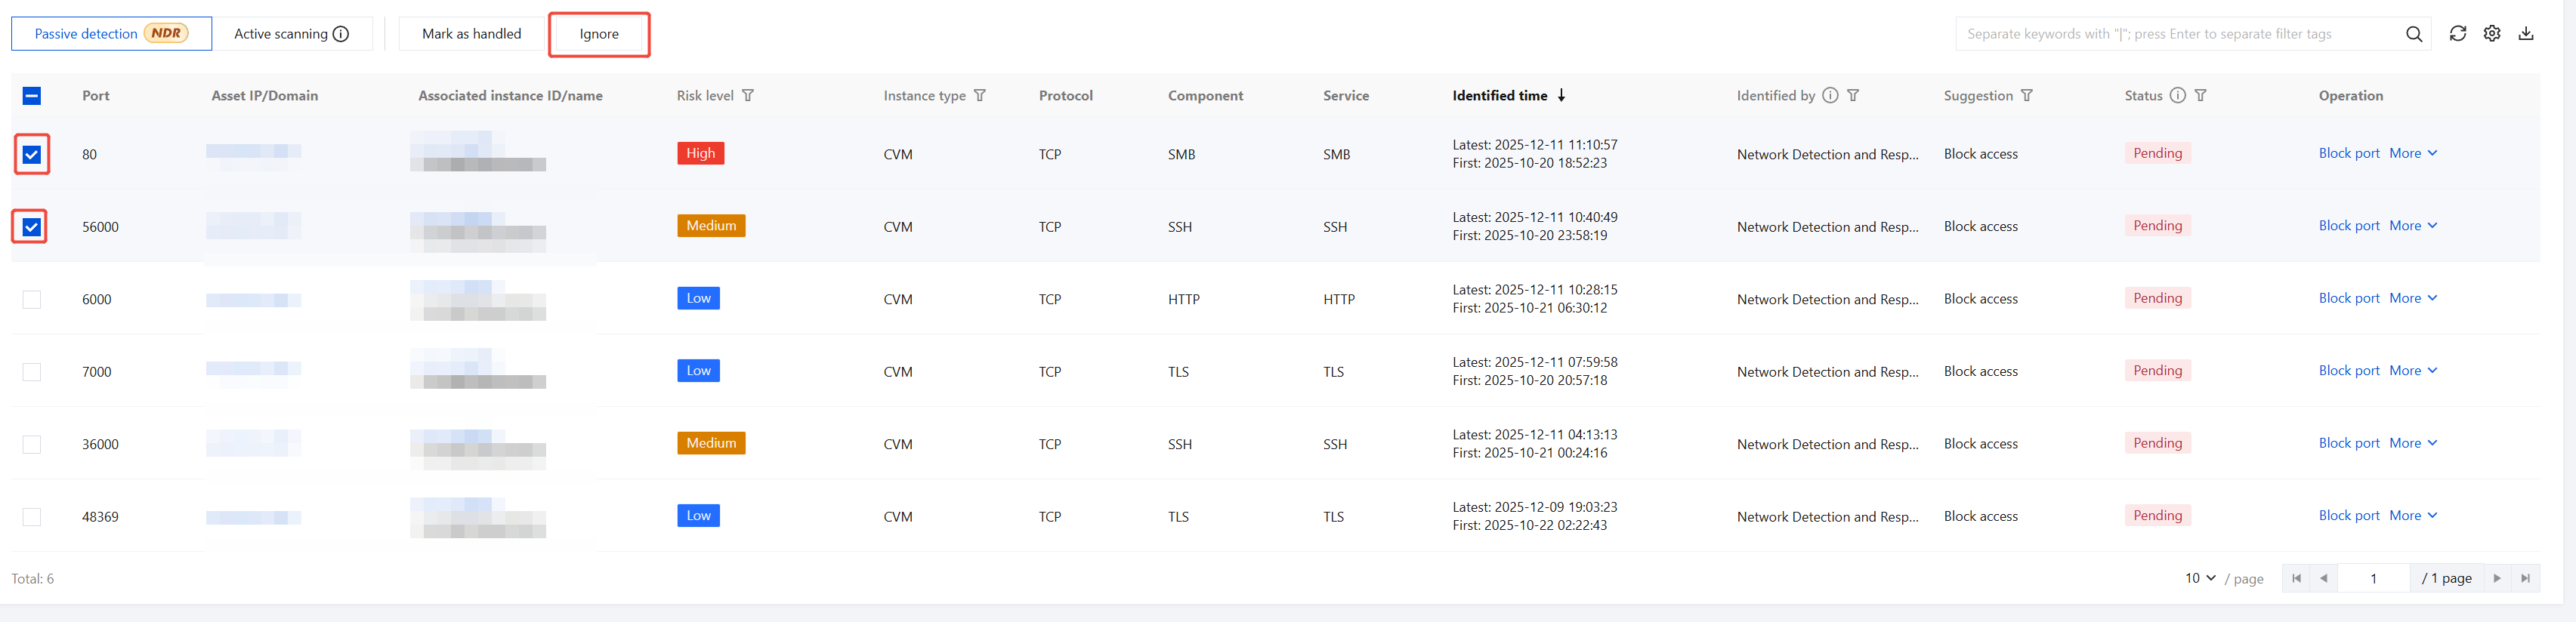
1. Supports changing risk status to Ignored individually or in batches.
Single: Select the target risk, click Ignore in the operation column or More >Ignore.
Batch: Select multiple risks and click Ignore.
2. In the confirmation window, click OK to change the status of the target risk to Ignored.
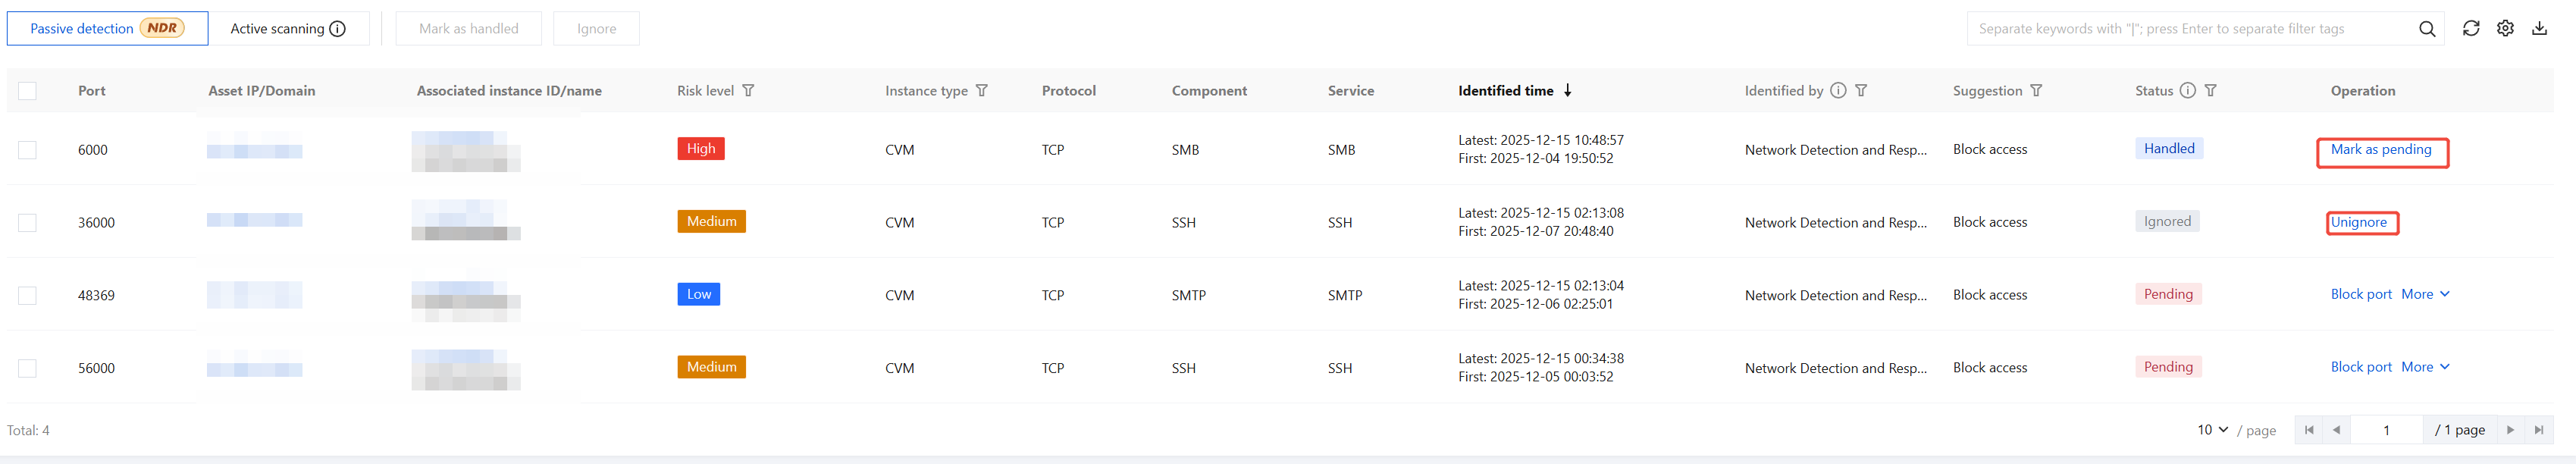
Unmark
When an alarm requires re-evaluation, its handling status will revert to Unhandled after the mark is removed.
When risks have been handled or ignored, on the Vulnerability and Risk Center page, select the target risk, then click Mark as pending or Unignore in the operation column to cancel the status.
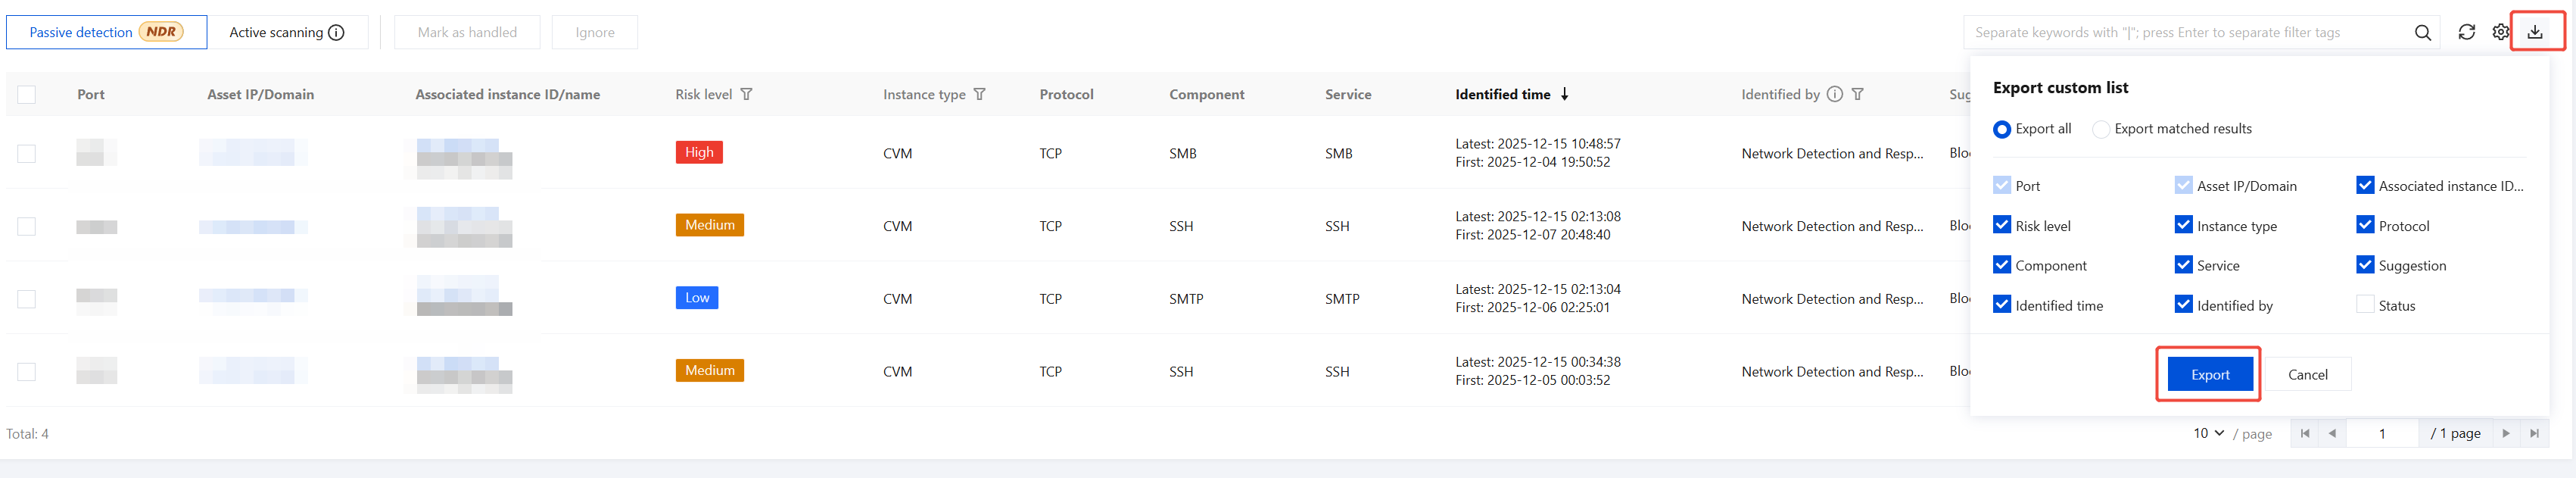
in the top right corner, select the rows and columns to export, then click Export to save the data locally.
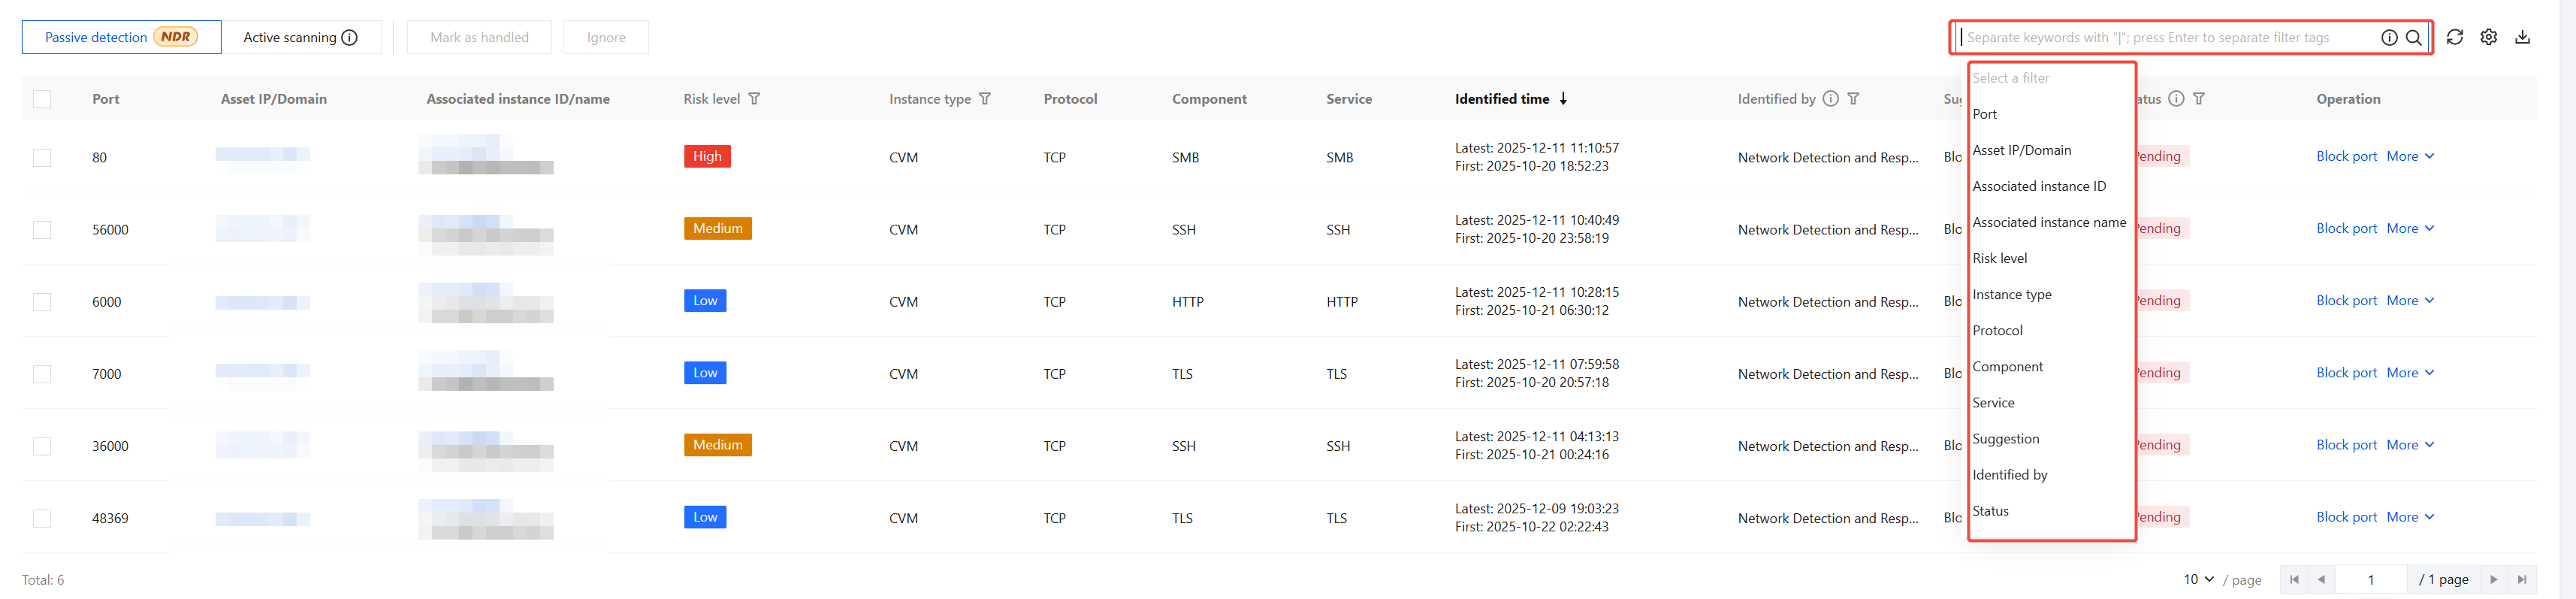
Network Detection and Response Capability
The Risk Management feature now includes passive detection capabilities based on Network Detection and Response. By passively analyzing full-traffic data through built-in detection rules, it can deeply identify three types of security threats: port risks, weak password risks, and sensitive data leakage risks.
Note:
To enable this feature, ensure that the target assets have the Network Detection and Response switch activated. For specific operational guidance, see Network Detection and Response Switch.
Switch Source
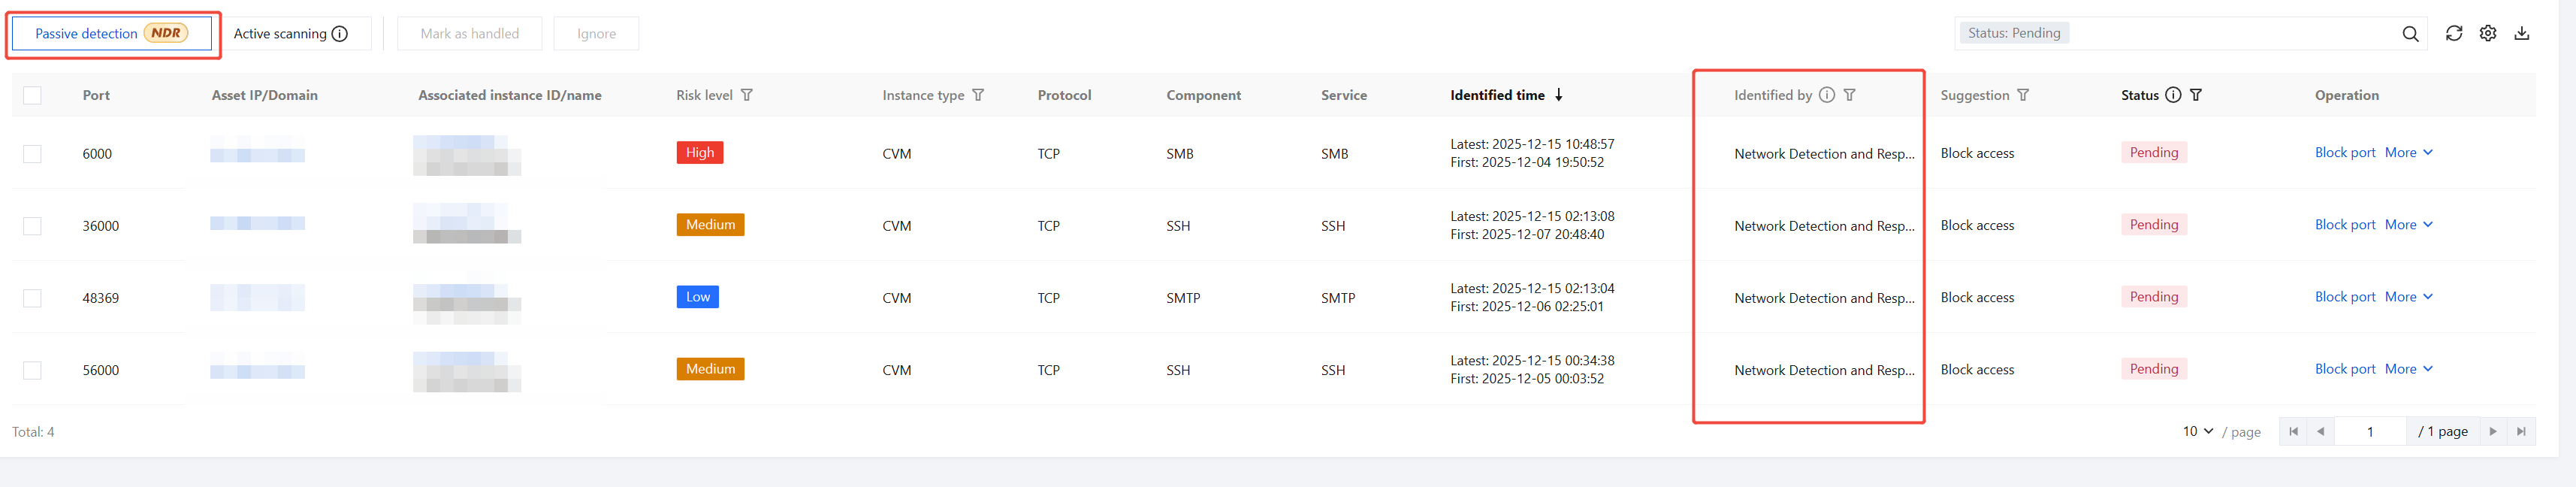
On the Risk page, navigate to either the Port Risks or Weak Passwords section. Click Passive Detection to switch the identification source to Network Detection and Response. This leverages Network Detection and Response detection rules to passively identify risks from traffic flows and display them.
Note:
Take Port Risks as an example.
Data Masking Display
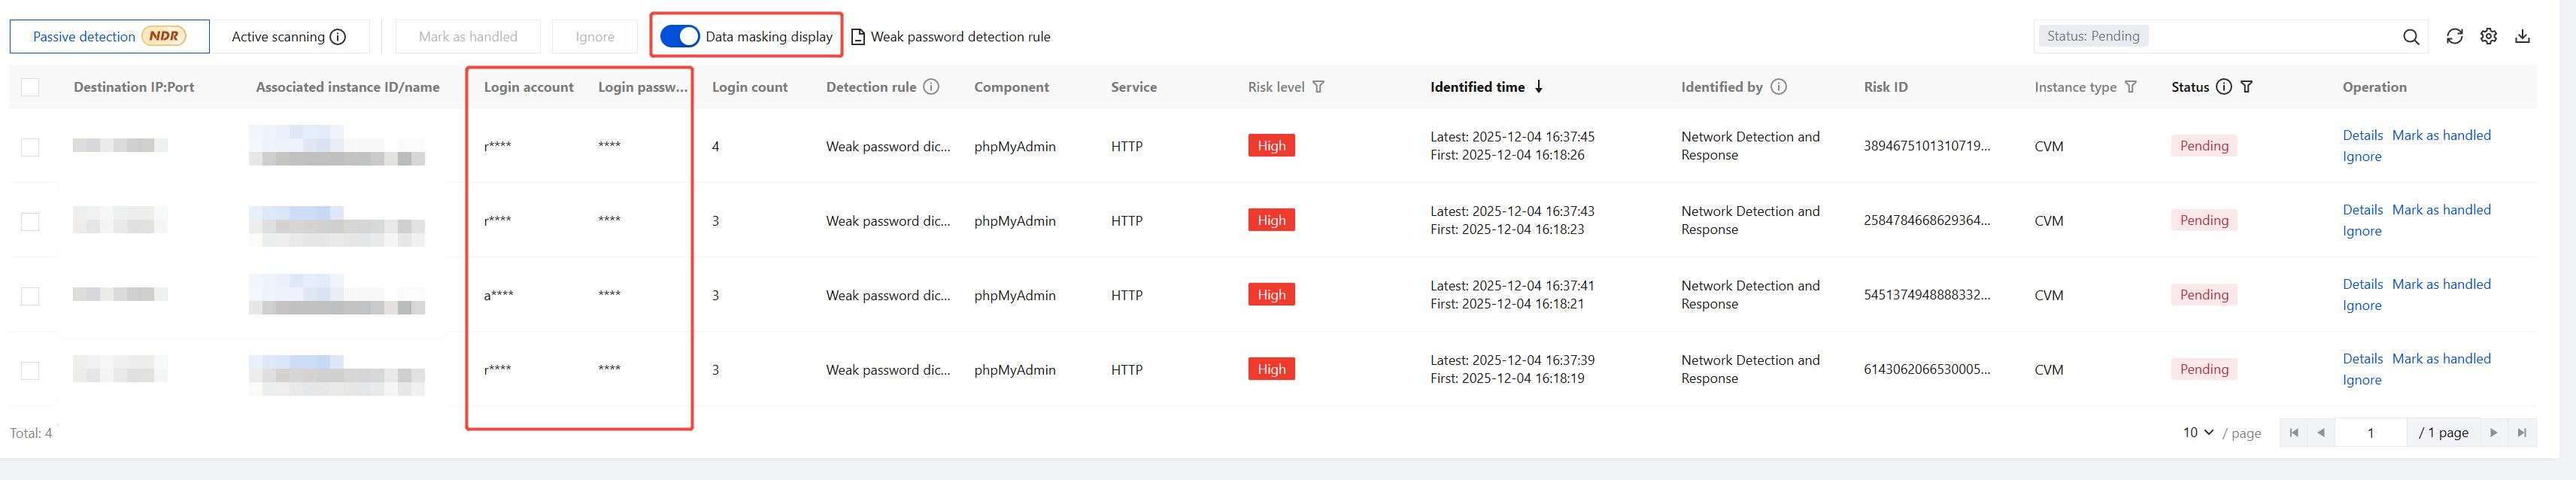
On the Risk Management page, in the Weak Password Risks or Sensitive Data Leaks section, you can control the Data Masking Display Switch to dynamically manage how sensitive data is displayed:
Note
Take Weak Passwords as an example.
Enable: Sensitive data on the page will be displayed in a masked format as "******". This feature is enabled by default.
Disable: Sensitive data on the page will be displayed with a partial mask.
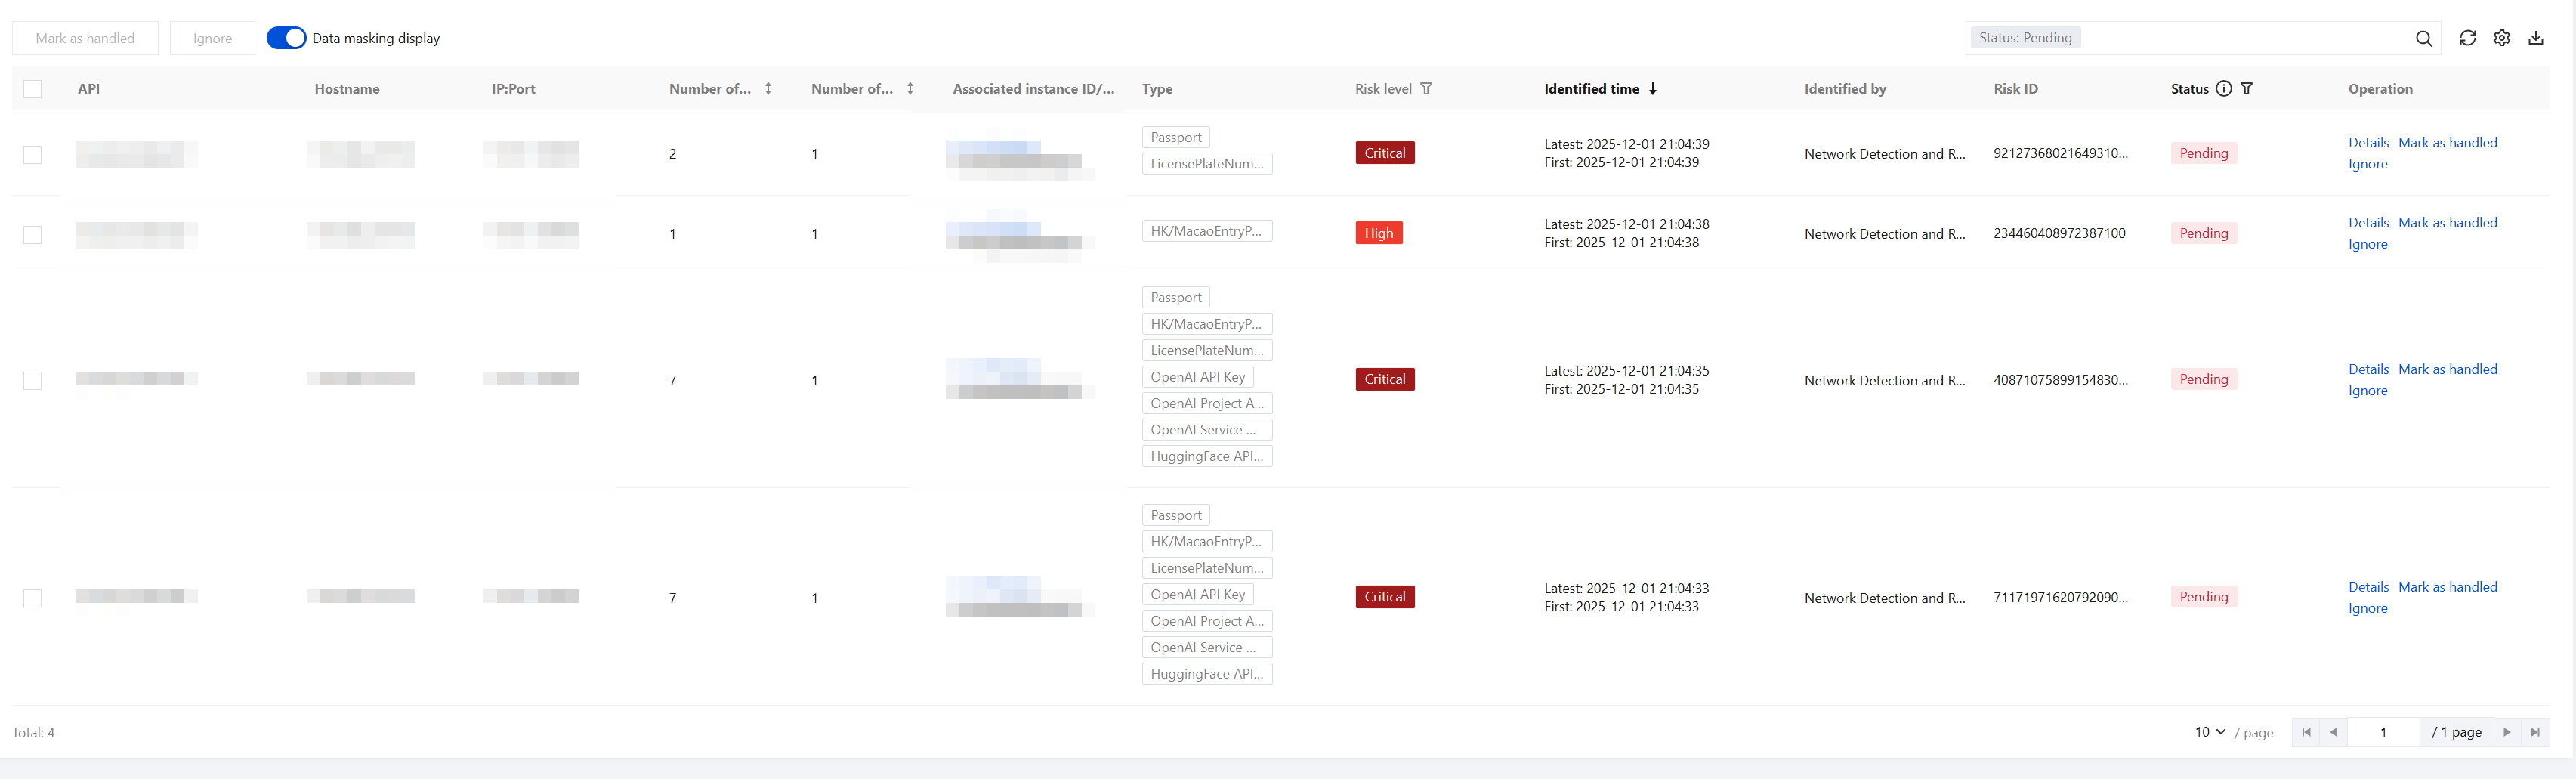
Sensitive Data Detection
Added the capability to detect sensitive data leak risks. You can view the sensitive data leak risks for current assets on the Risk > Sensitive Data Leaks page, and directly view and handle risks on this page.
Currently supported types for detecting sensitive data leak risks include Chinese mainland ID cards, savings bank cards, and so on. For detailed types of sensitive data leak risk detection, you can view them on the Sensitive Data Leaks page.
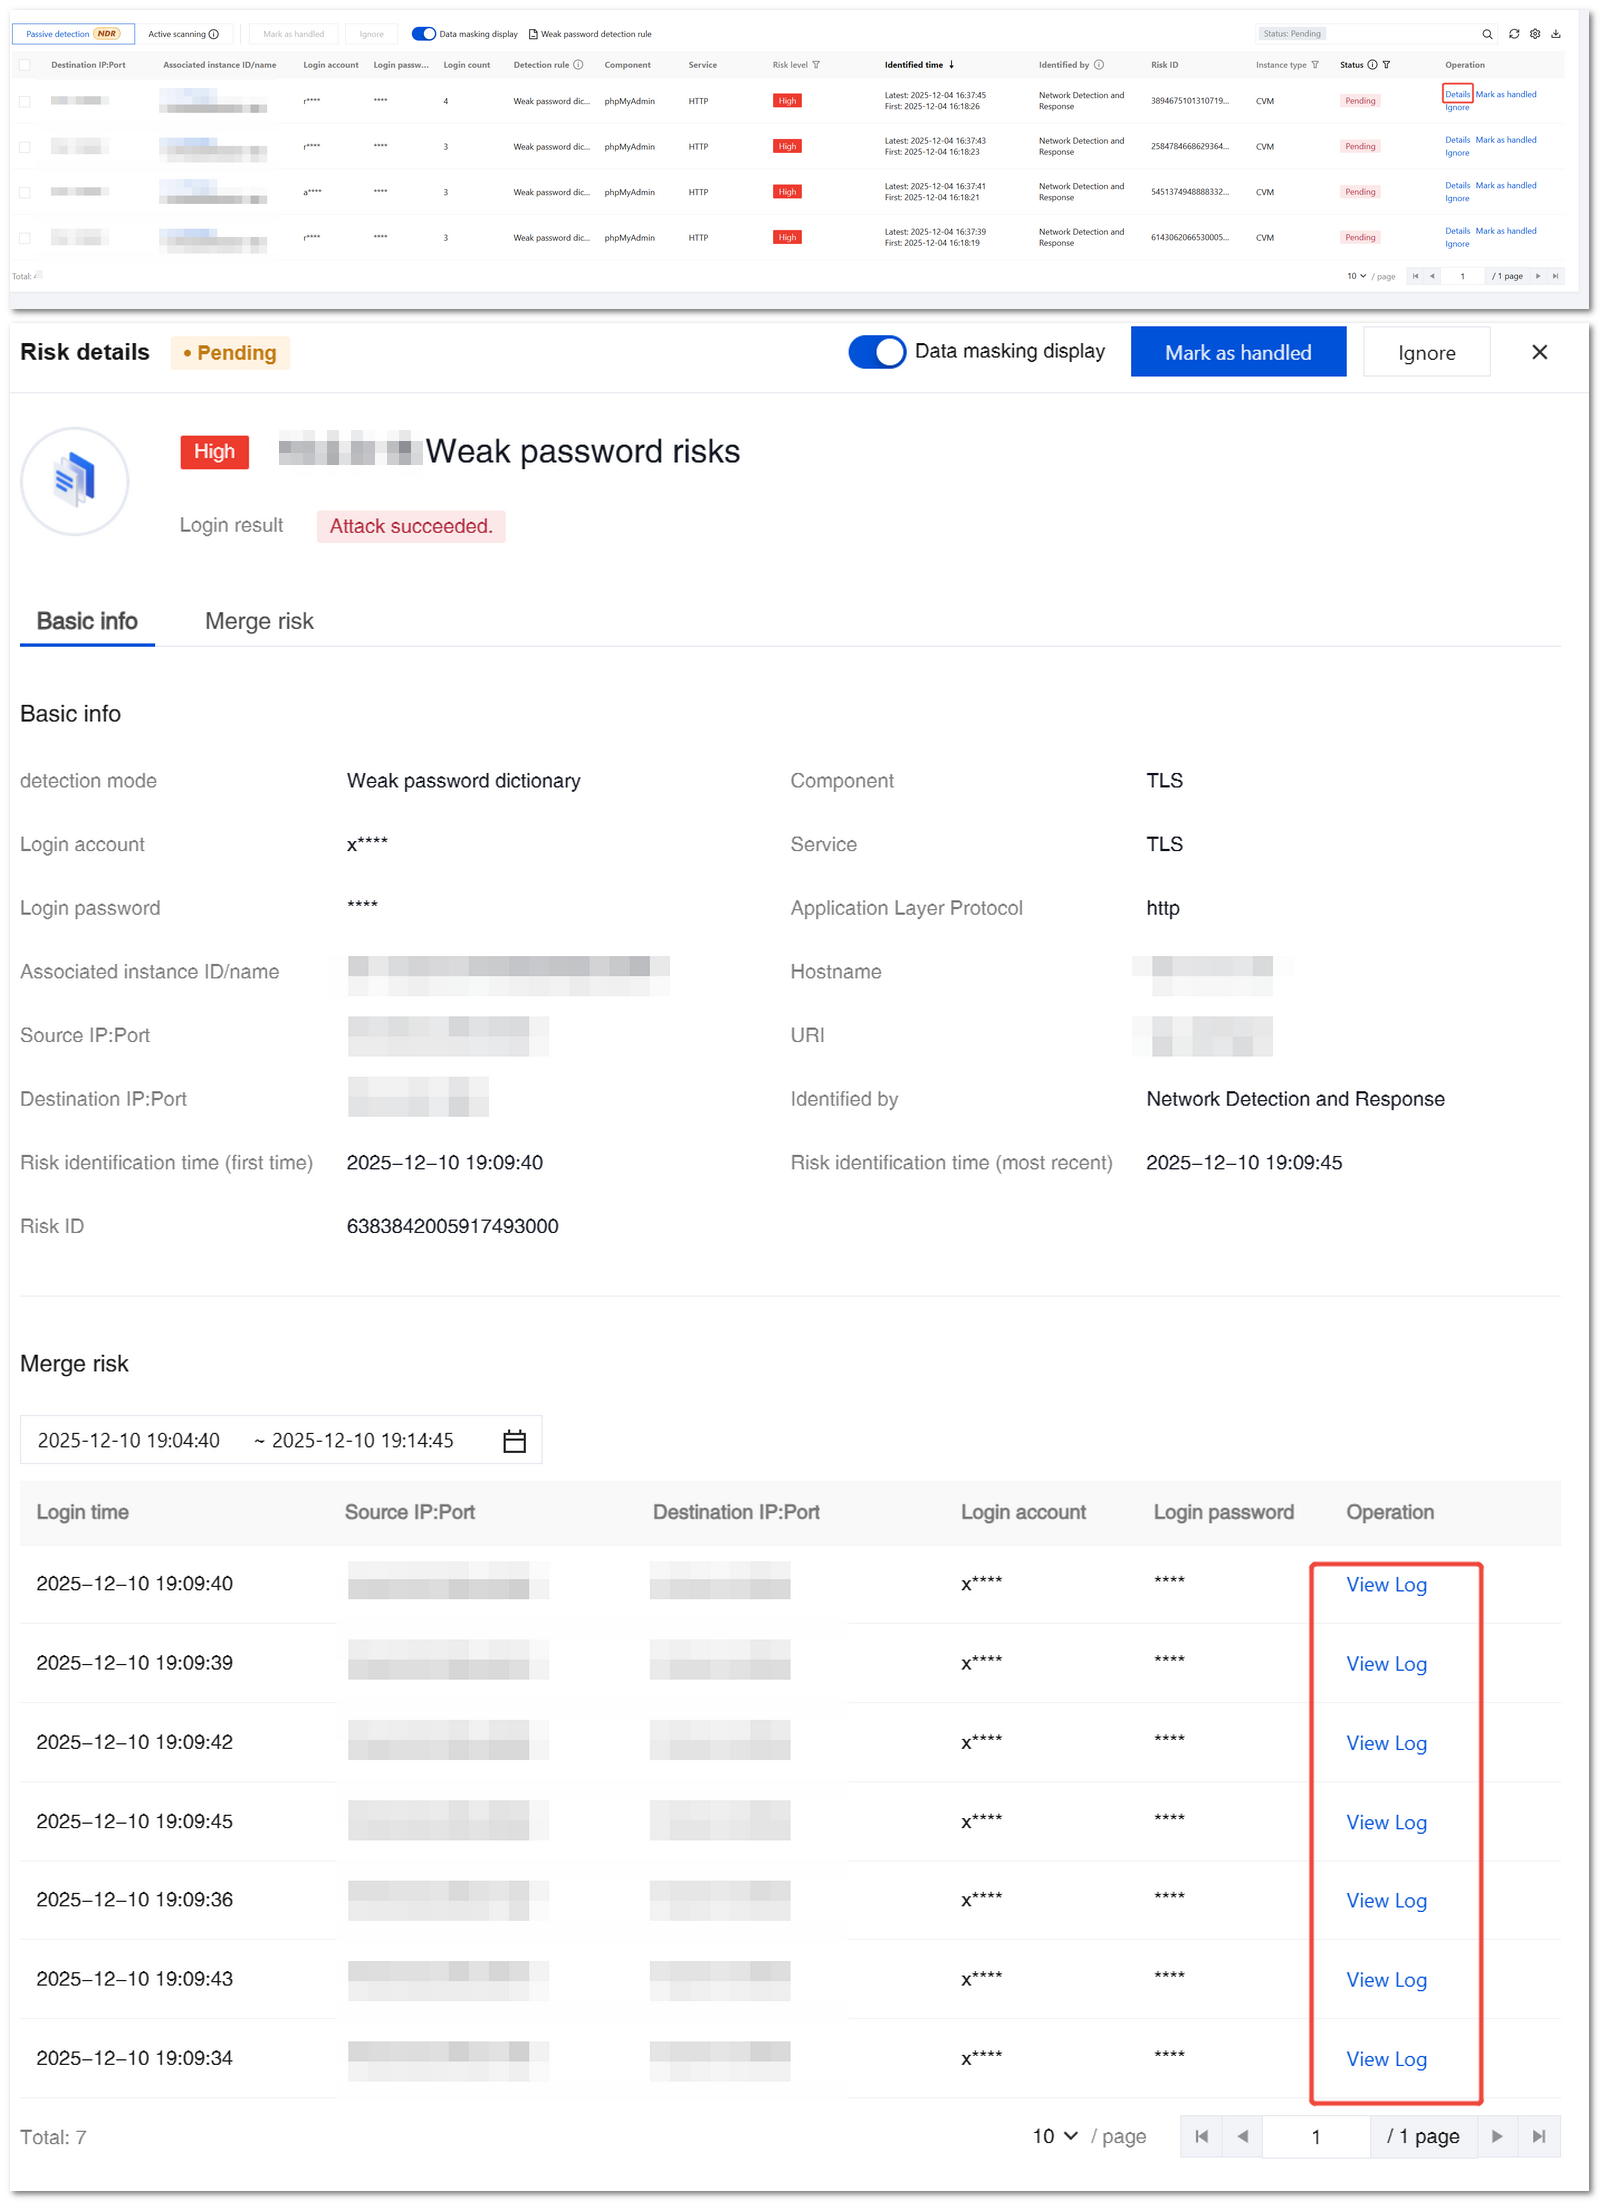
Risk Details
On the Weak Password Risks / Sensitive Data Leaks page, click Details to view specific information and aggregated risks of the current threat. In the Aggregated Risks section, click View Log to automatically navigate to the corresponding Netword Detection and Response Log - Traffic Risk Log page.
Note
Take Weak Passwords as an example.
Network Attack of Asset
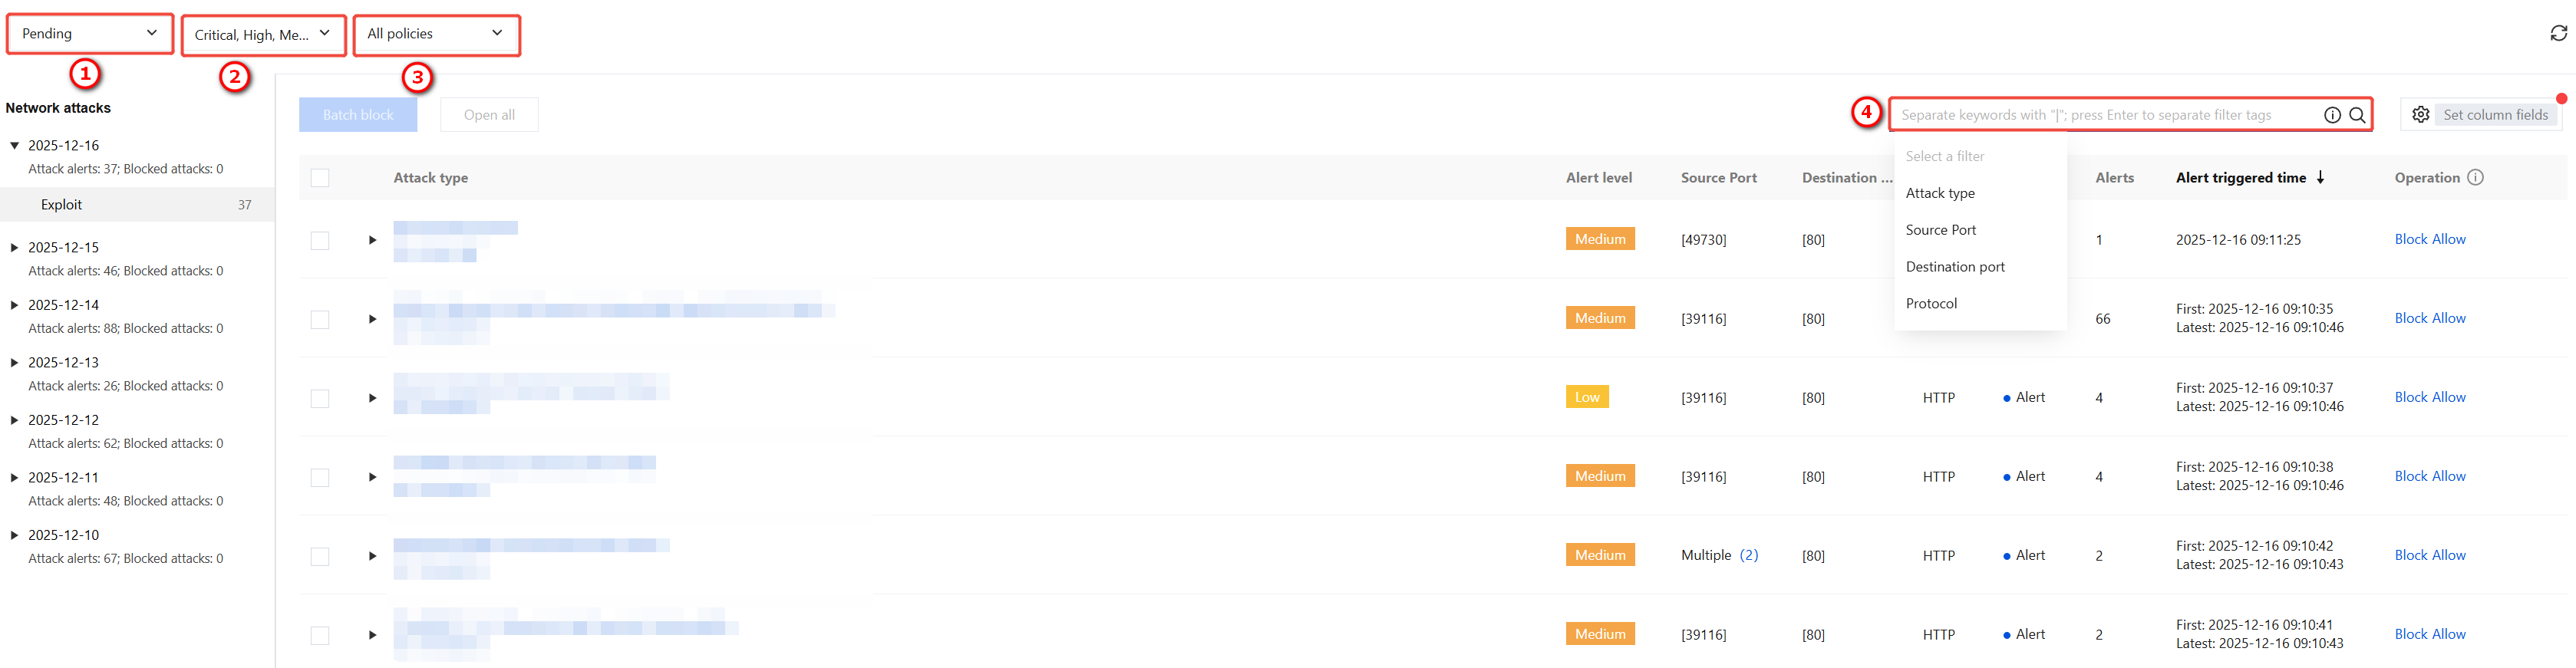
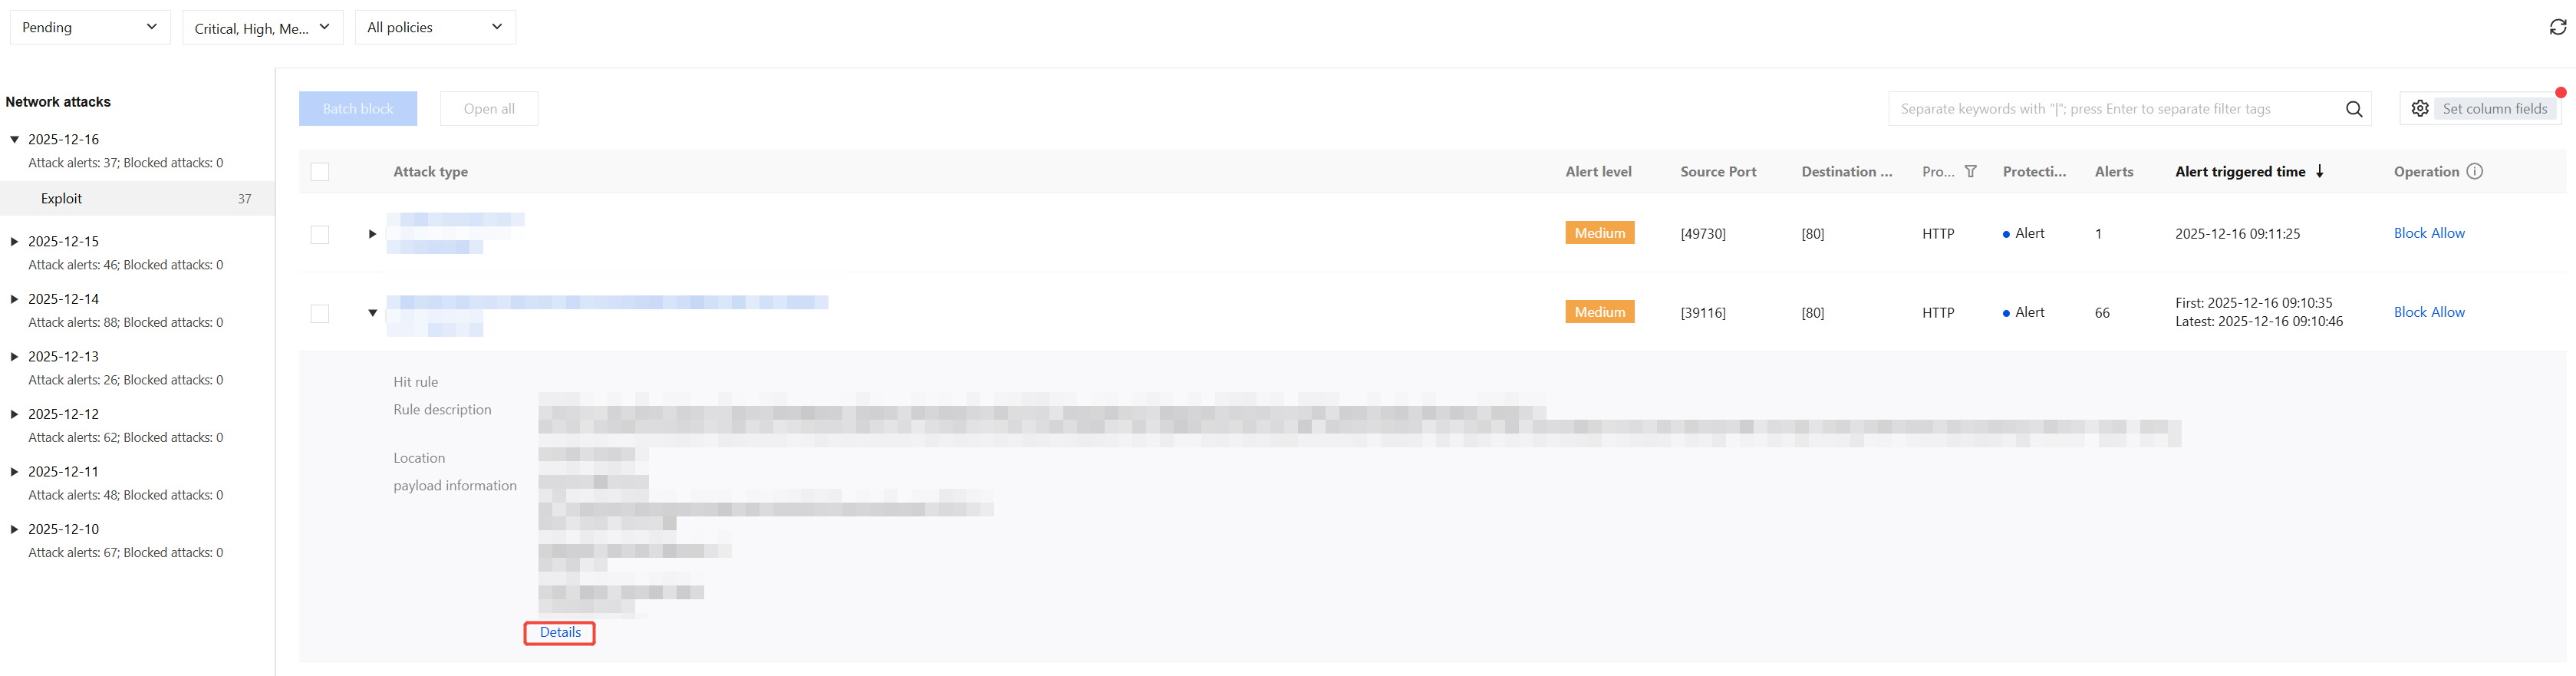
Alarms for network attacks and blocking events for this asset are recorded in chronological order.
1. Users can filter network attack events based on keywords using ① event handling status (default: unhandled), ② alarm level, ③ execution policy, ④ search box.
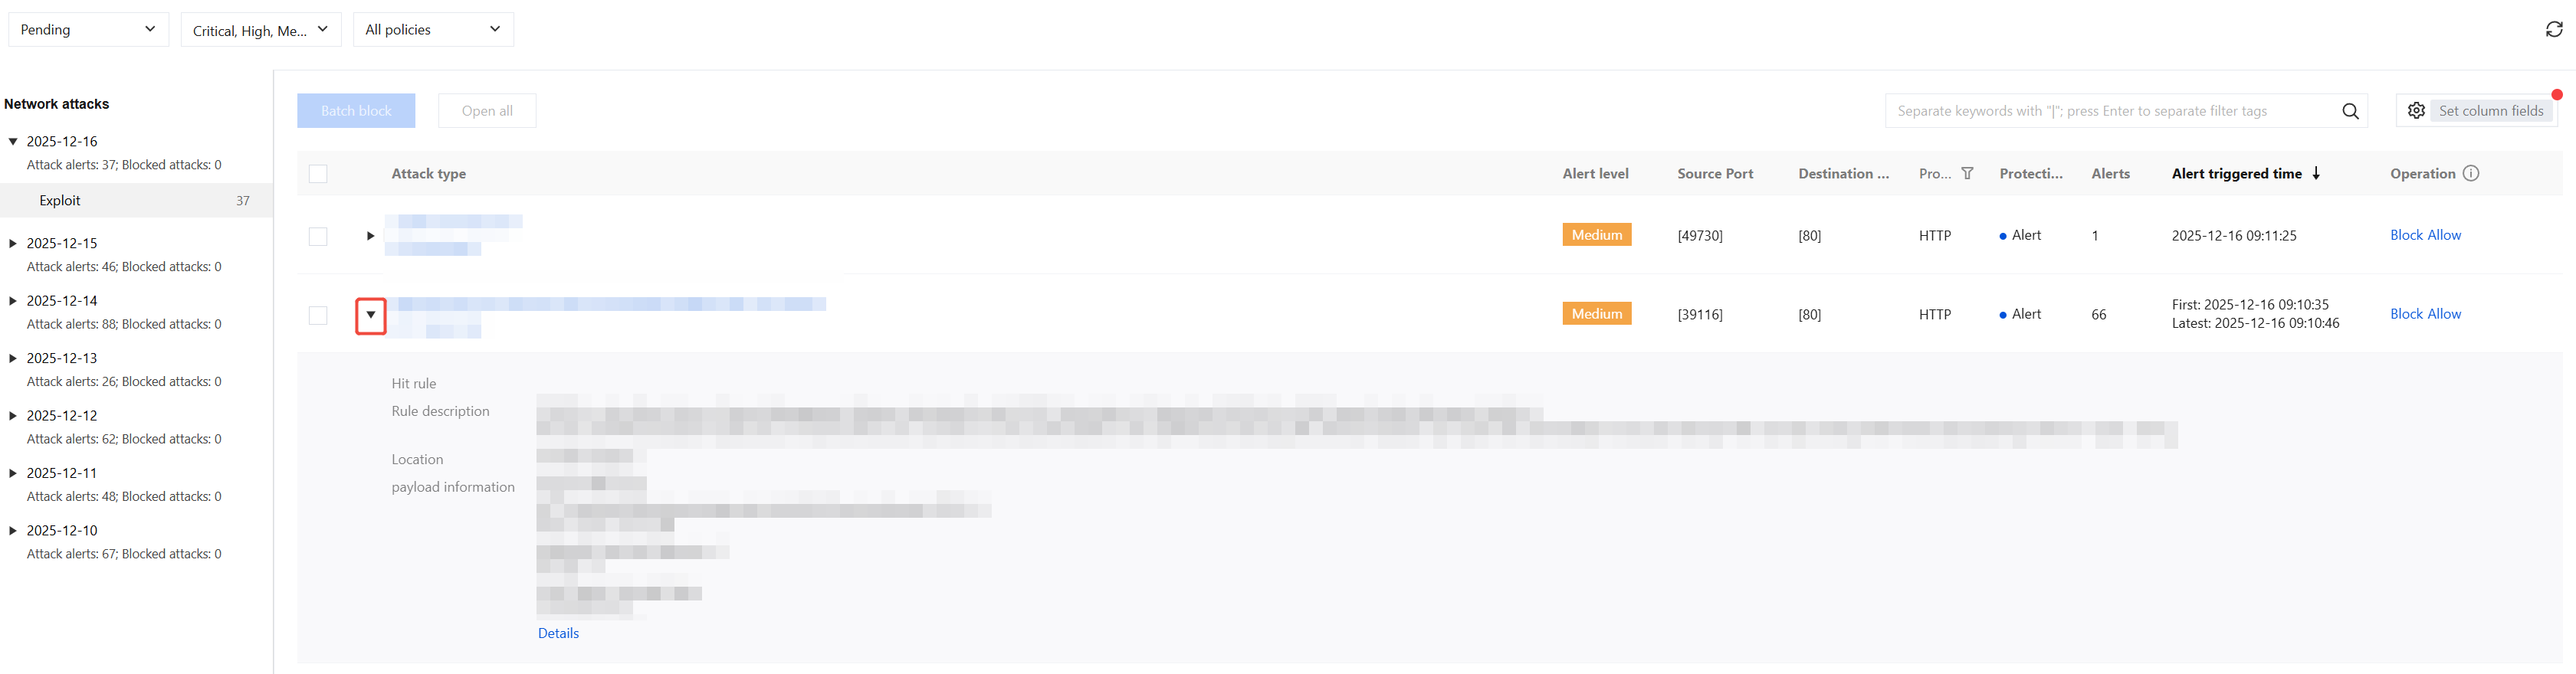
2. Select a specific event, click
to view event details, including event description and threat intelligence tags.
3. Click payload Information > Details to view the payload information of the attacking IP address.
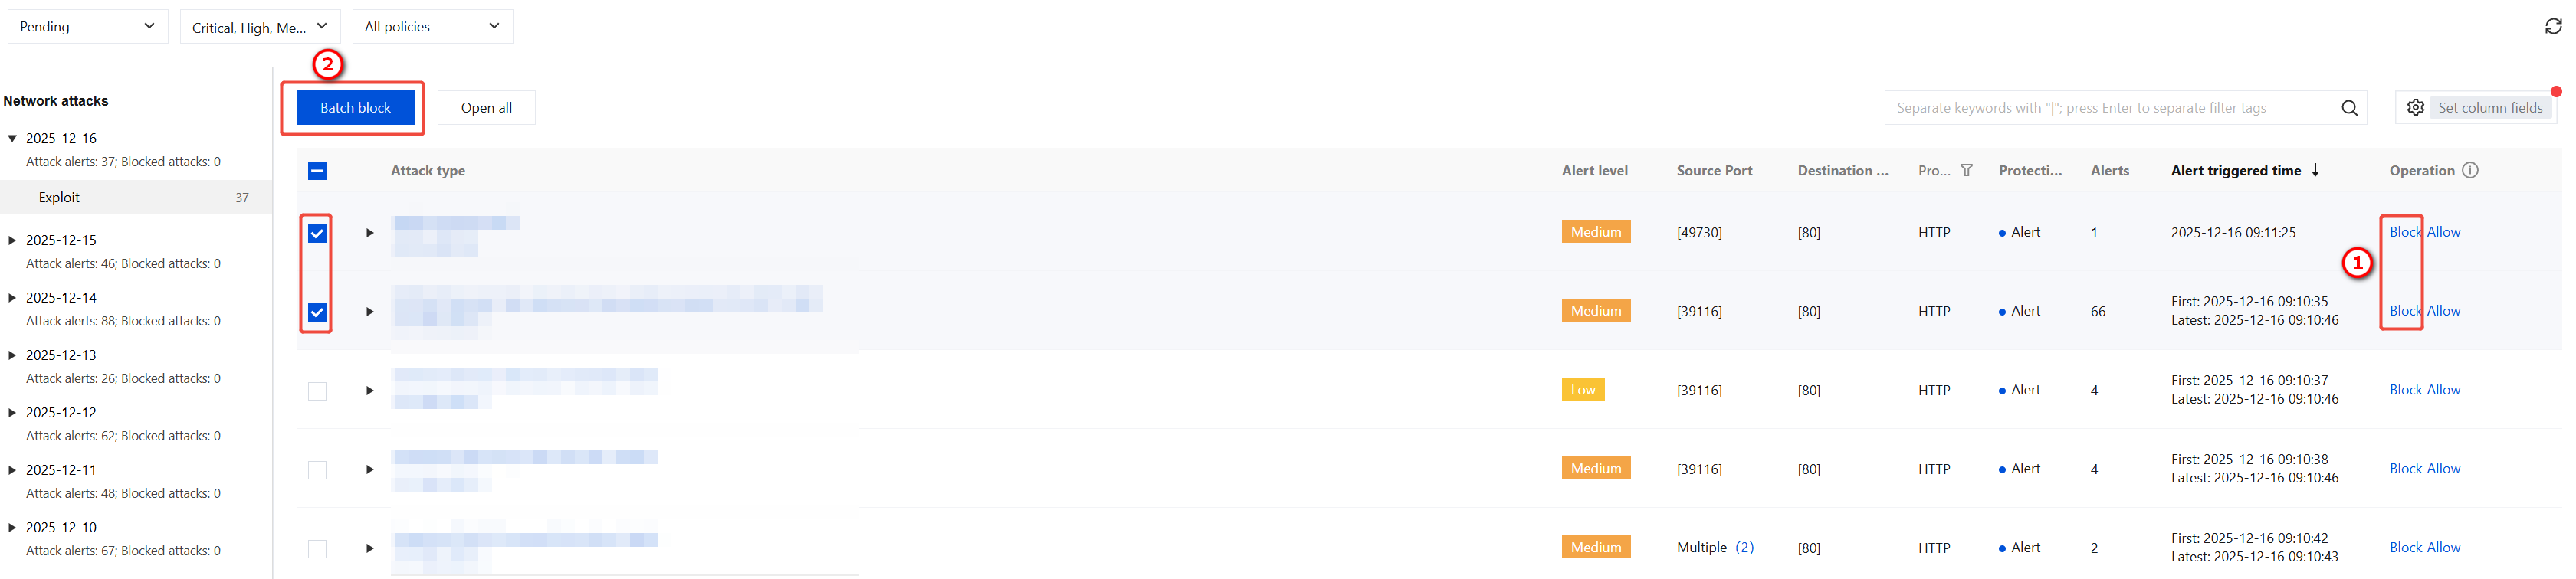
4. Support one-click blocking of IP addresses associated with attack events. Click Block at ① to block access by a single IP address to all assets. Select multiple events and click Batch Block in ② to block the selected IP addresses.
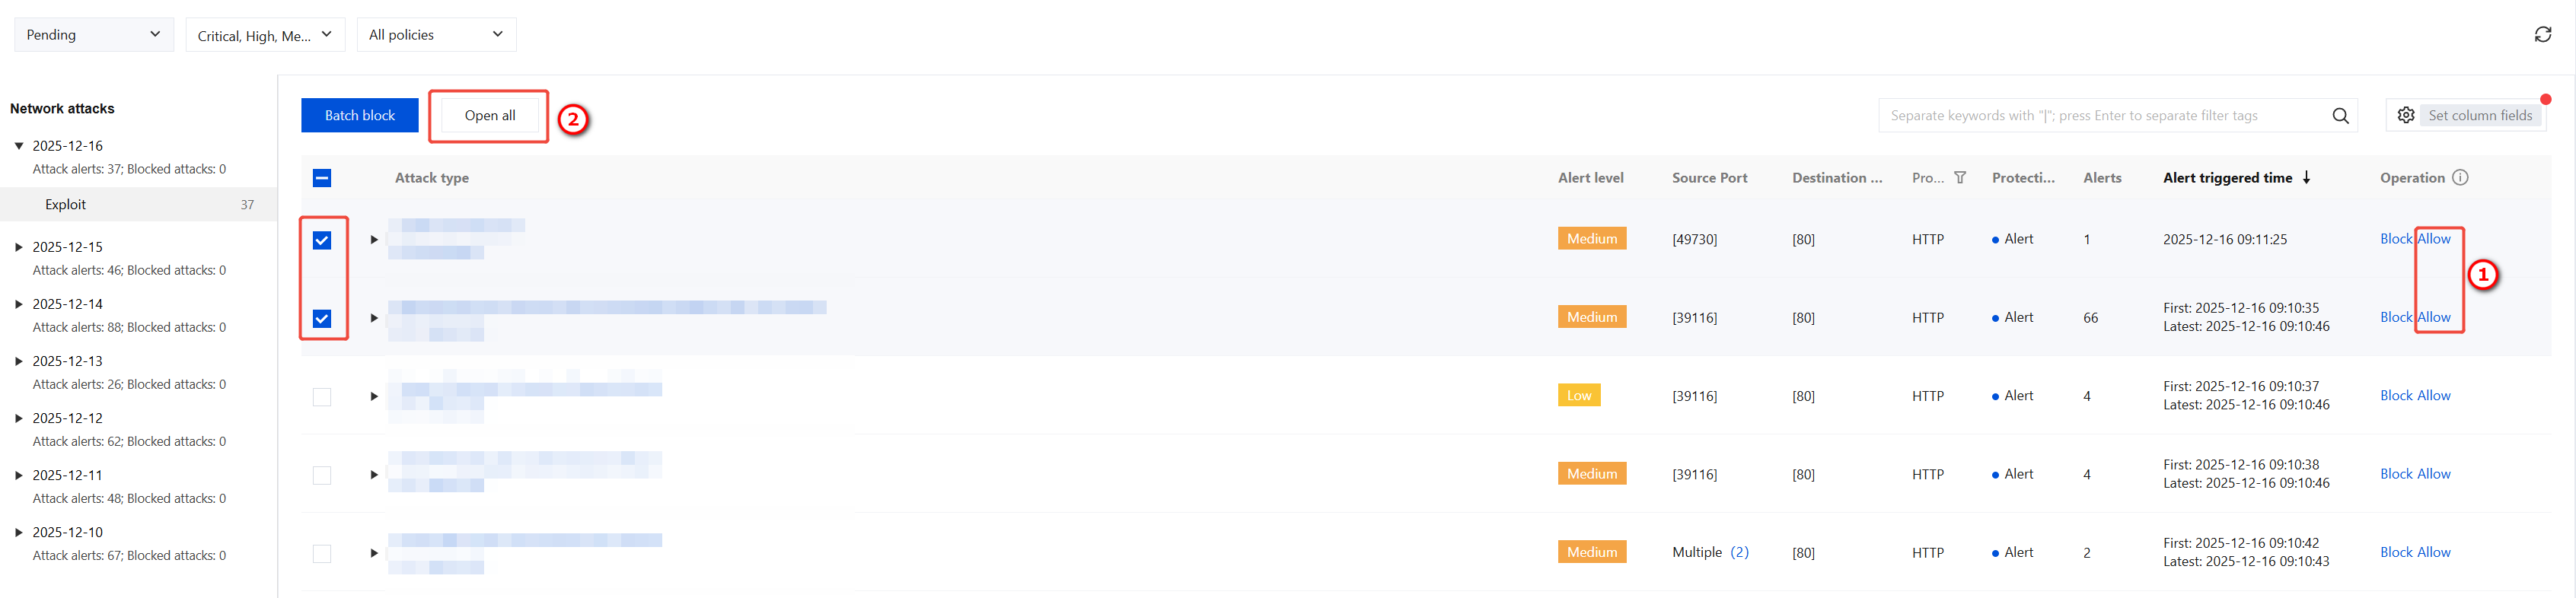
5. For events that may be duplicates or false positives, support one-click allowing of the relevant IP addresses. Click Allow at ① to allow traffic from a single IP address. Select multiple events and click Open All in ② to allow traffic from the selected multiple IP addresses.
Note
For details on blocking and allowing attack IPs, see the Alarm Center documentation.
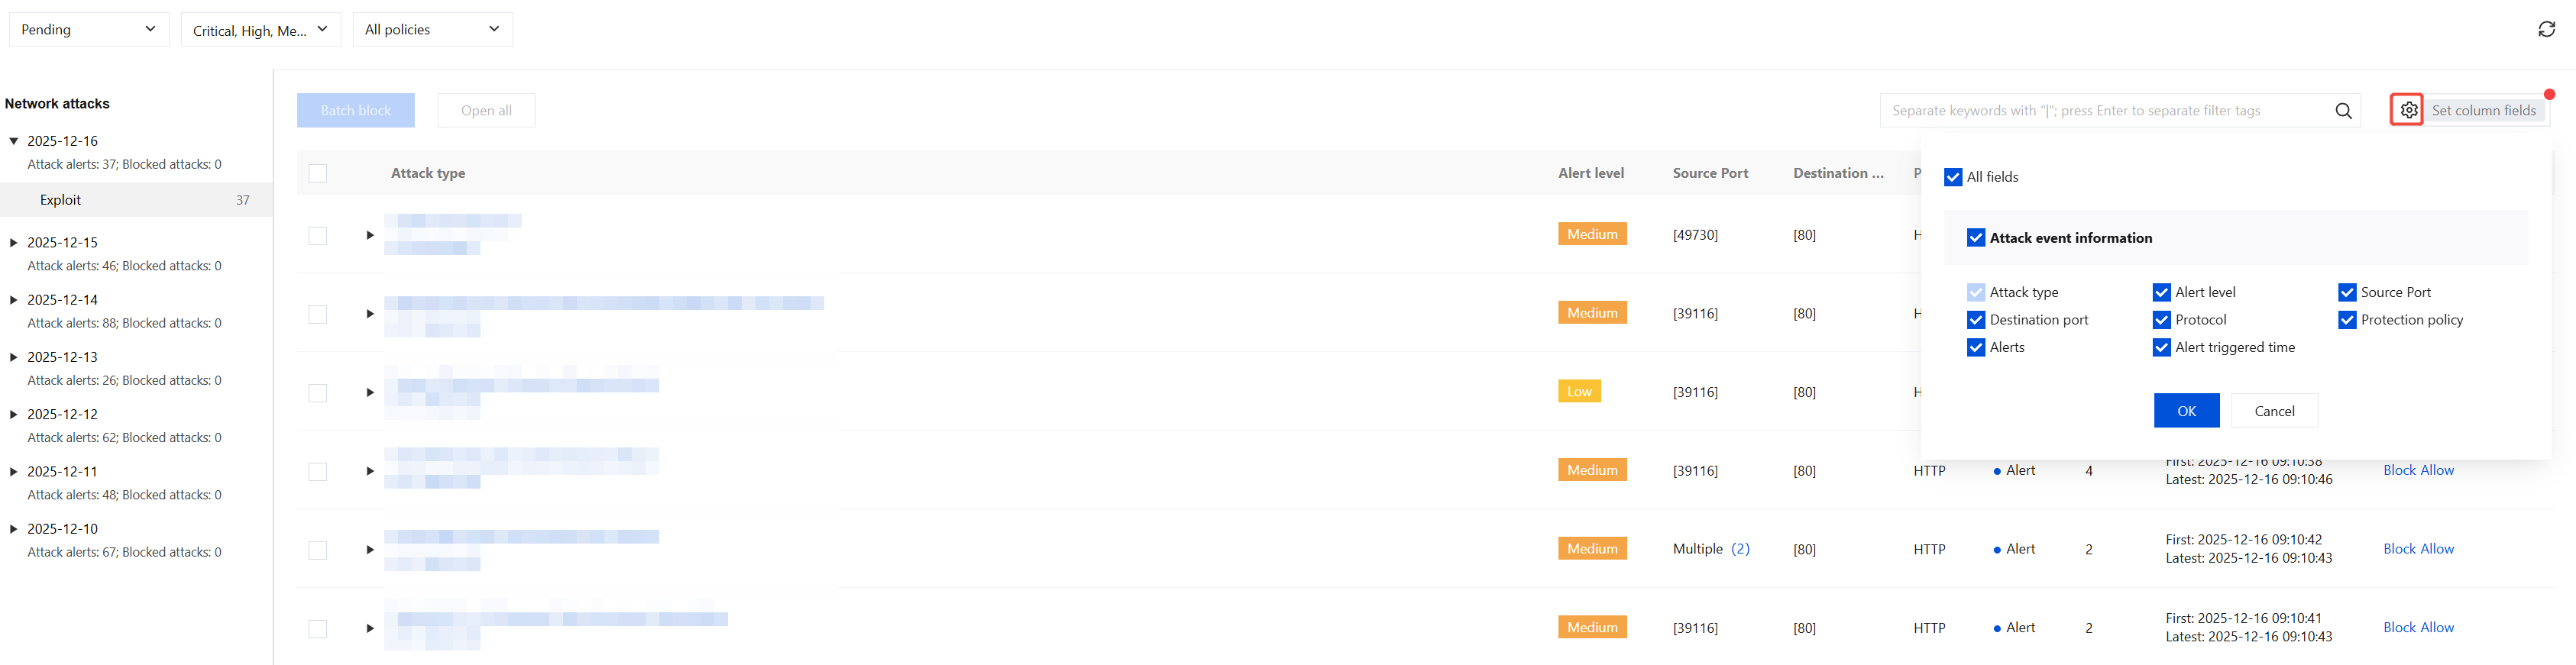
6. Click the
icon to customize event list fields and display event information of interest to users.
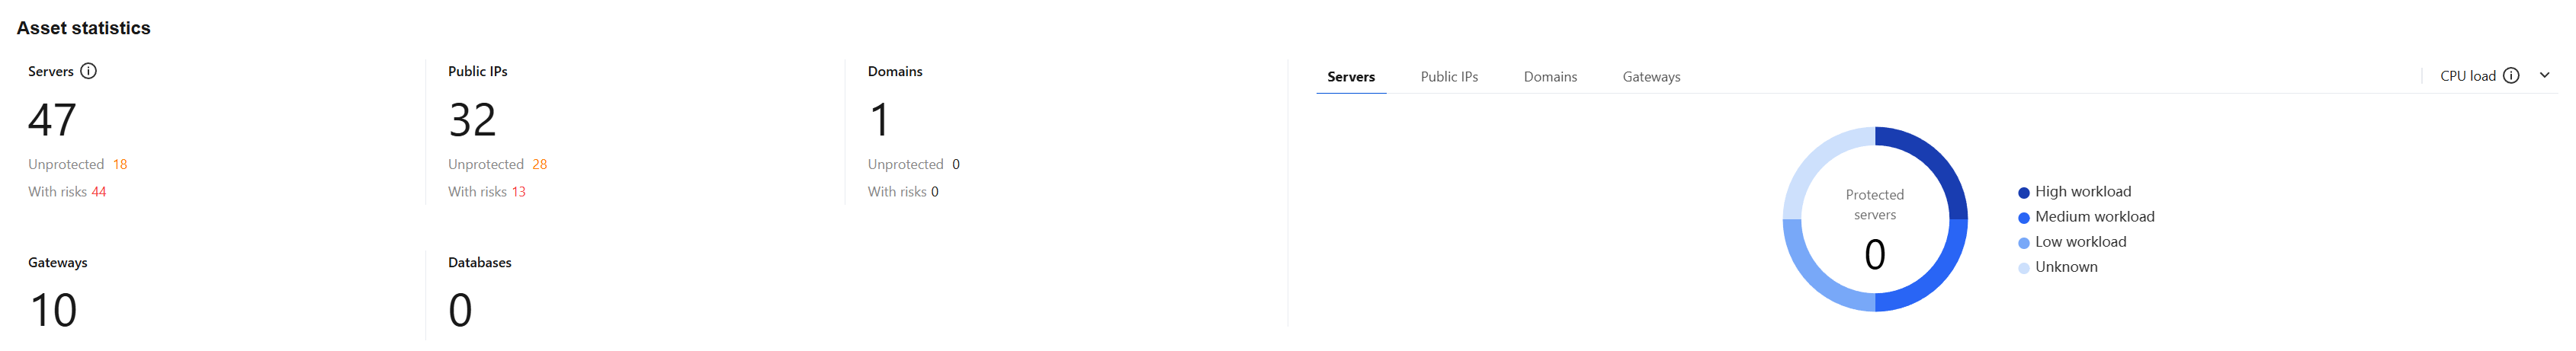
Overview of Asset Statistics
1. View the overview of asset statistics. The left side of the page displays counts of host assets, public IP address assets, domain name assets, gateway assets, and database assets. Click the number to filter the corresponding asset list at the bottom of the page, allowing users to view asset details.
2. Users can view asset monitoring within the corresponding time period on the right side of the page.
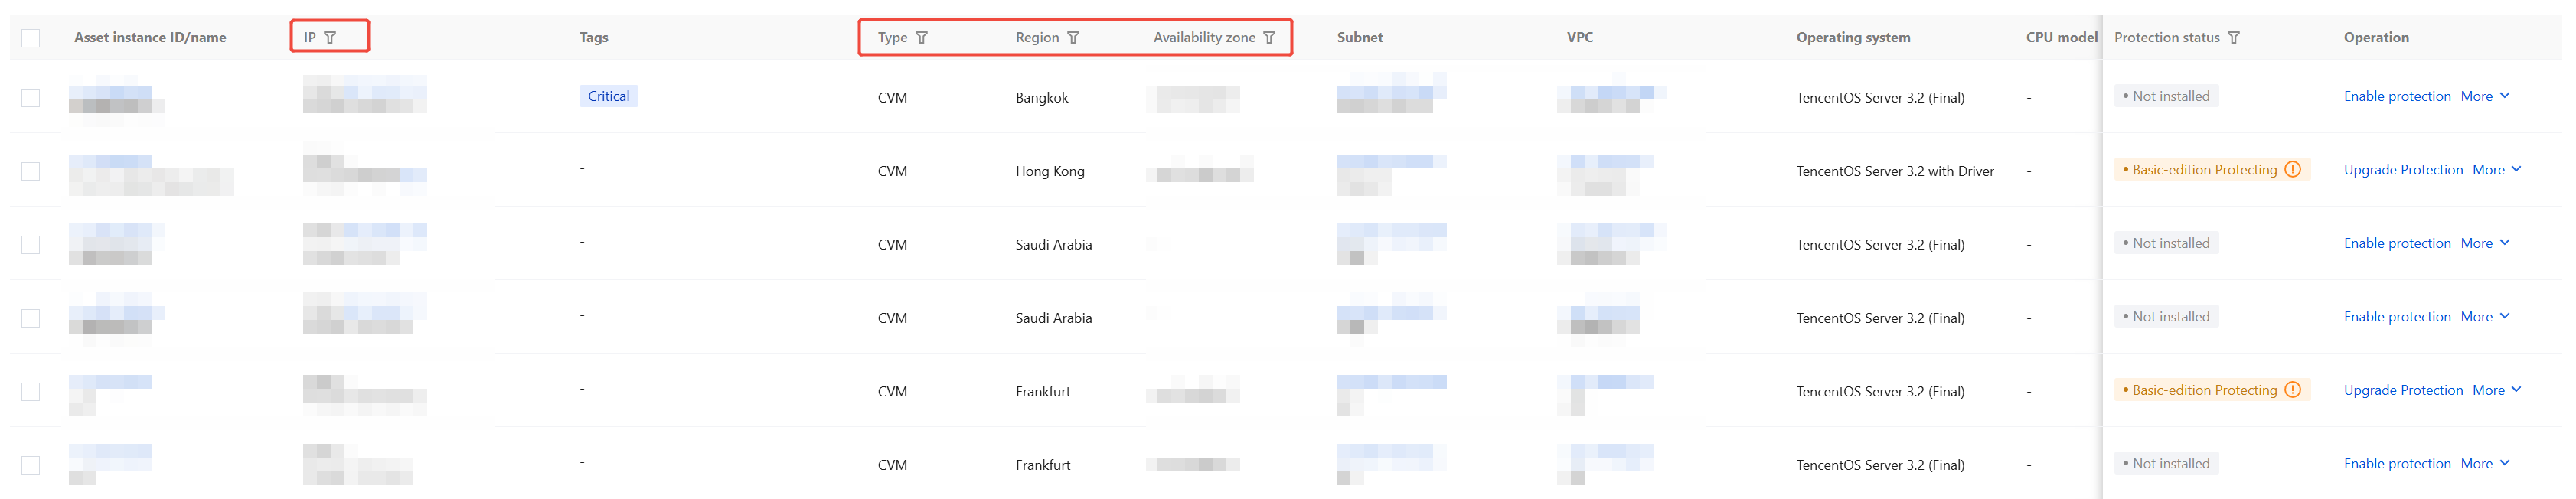
3. Users can view detailed information of each asset at the bottom of the page.
Note:
Take host assets as an example.
Click the
icon to filter the corresponding asset information.
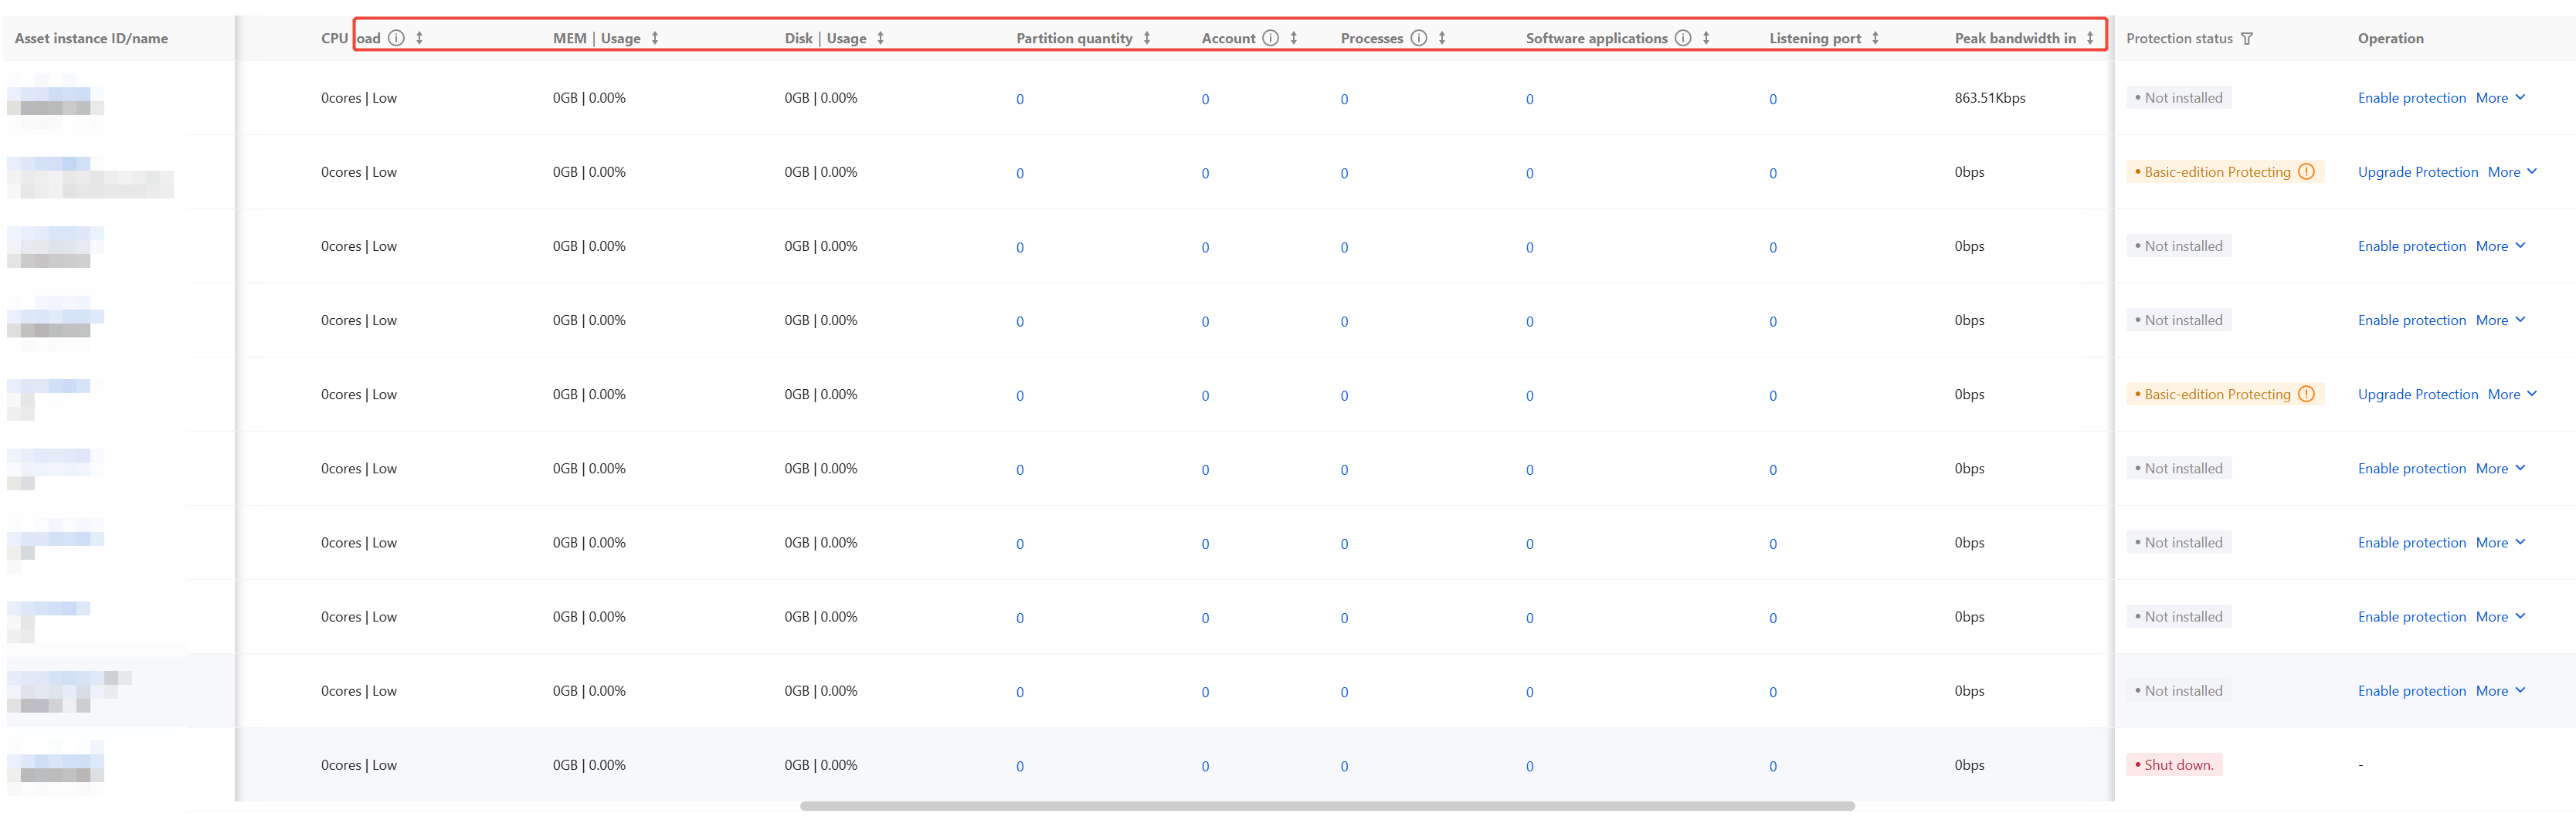
Click the
icon to sort the corresponding asset information.
Note:
Exposed ports, exposed vulnerabilities, and data on configuration risks need to be displayed based on the scanning results after asset scanning is completed.
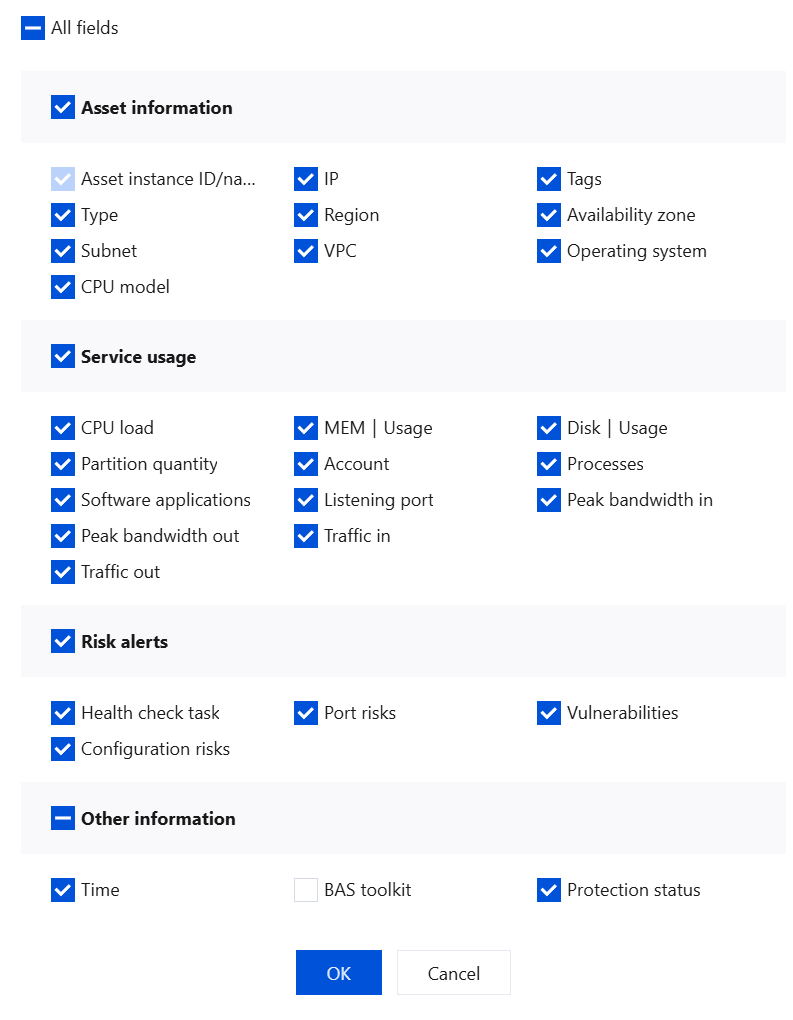
Click the
icon to support user customization of asset list content.
Click the
icon to export the asset list, supporting customization of list content and search criteri