This document describes how to view CFW-related logs.
Viewing Access Control Log
1. Log in to the CFW console, and in the left sidebar, choose Log Auditing > Access Control Log. 2. On the Access Control log page, you can view the logs of rule hit records generated by CFW based on the access control rules configured by users in the Internet Border Firewall, NAT Border Firewall, VPC Border firewall, and Enterprise Security Group.
3. Meanwhile, on the Internet Border Firewall and NAT Border Firewall pages, Access Control logs generate two rule hit record lists based on inbound and outbound directions respectively, allowing users to view them separately. 4. In the operation bar on the right of the rule hit list, click View.
5. On the Rule Hit Details page, view the hit details of the current rule.
Note:
If the rule is deleted after the log generation time, its status is displayed as delete.
If the rule is edited after the log generation time, its status is displayed as edit.
If the rule has not been deleted or edited since the time of log generation, its status is displayed as newly add.
6. To further expedite the search and filtering of Access Control logs, you can click on the right side of the source IP or destination IP to view all records of rule hits between these two IP addresses. 7. Click the on the right side of the page to manually download logs, and the page allows conditional filtering. Each download is limited to 60,000 records. Viewing Intrusion Prevention Log
1. Log in to the CFW console, and in the left sidebar, choose Log Auditing > Intrusion Defense log. 2. On the Intrusion Defense log page, view all security events generated and recorded by CFW in "Observation Mode" and "Block Mode". Four lists—Intrusion, Server compromised, Lateral movements, and Honeypot—display detailed inbound and outbound security events respectively.
View Network Detection and Response Log
Network Detection and Response Log include Traffic Analysis Log, Traffic Alarm Log, Traffic Risk Log and File Detection Log.
1. Log in to the CFW console, in the left sidebar, choose Log Auditing > Network Detection and Response Log. 2. On the Network Detection and Response Log page, you can perform the following operations:
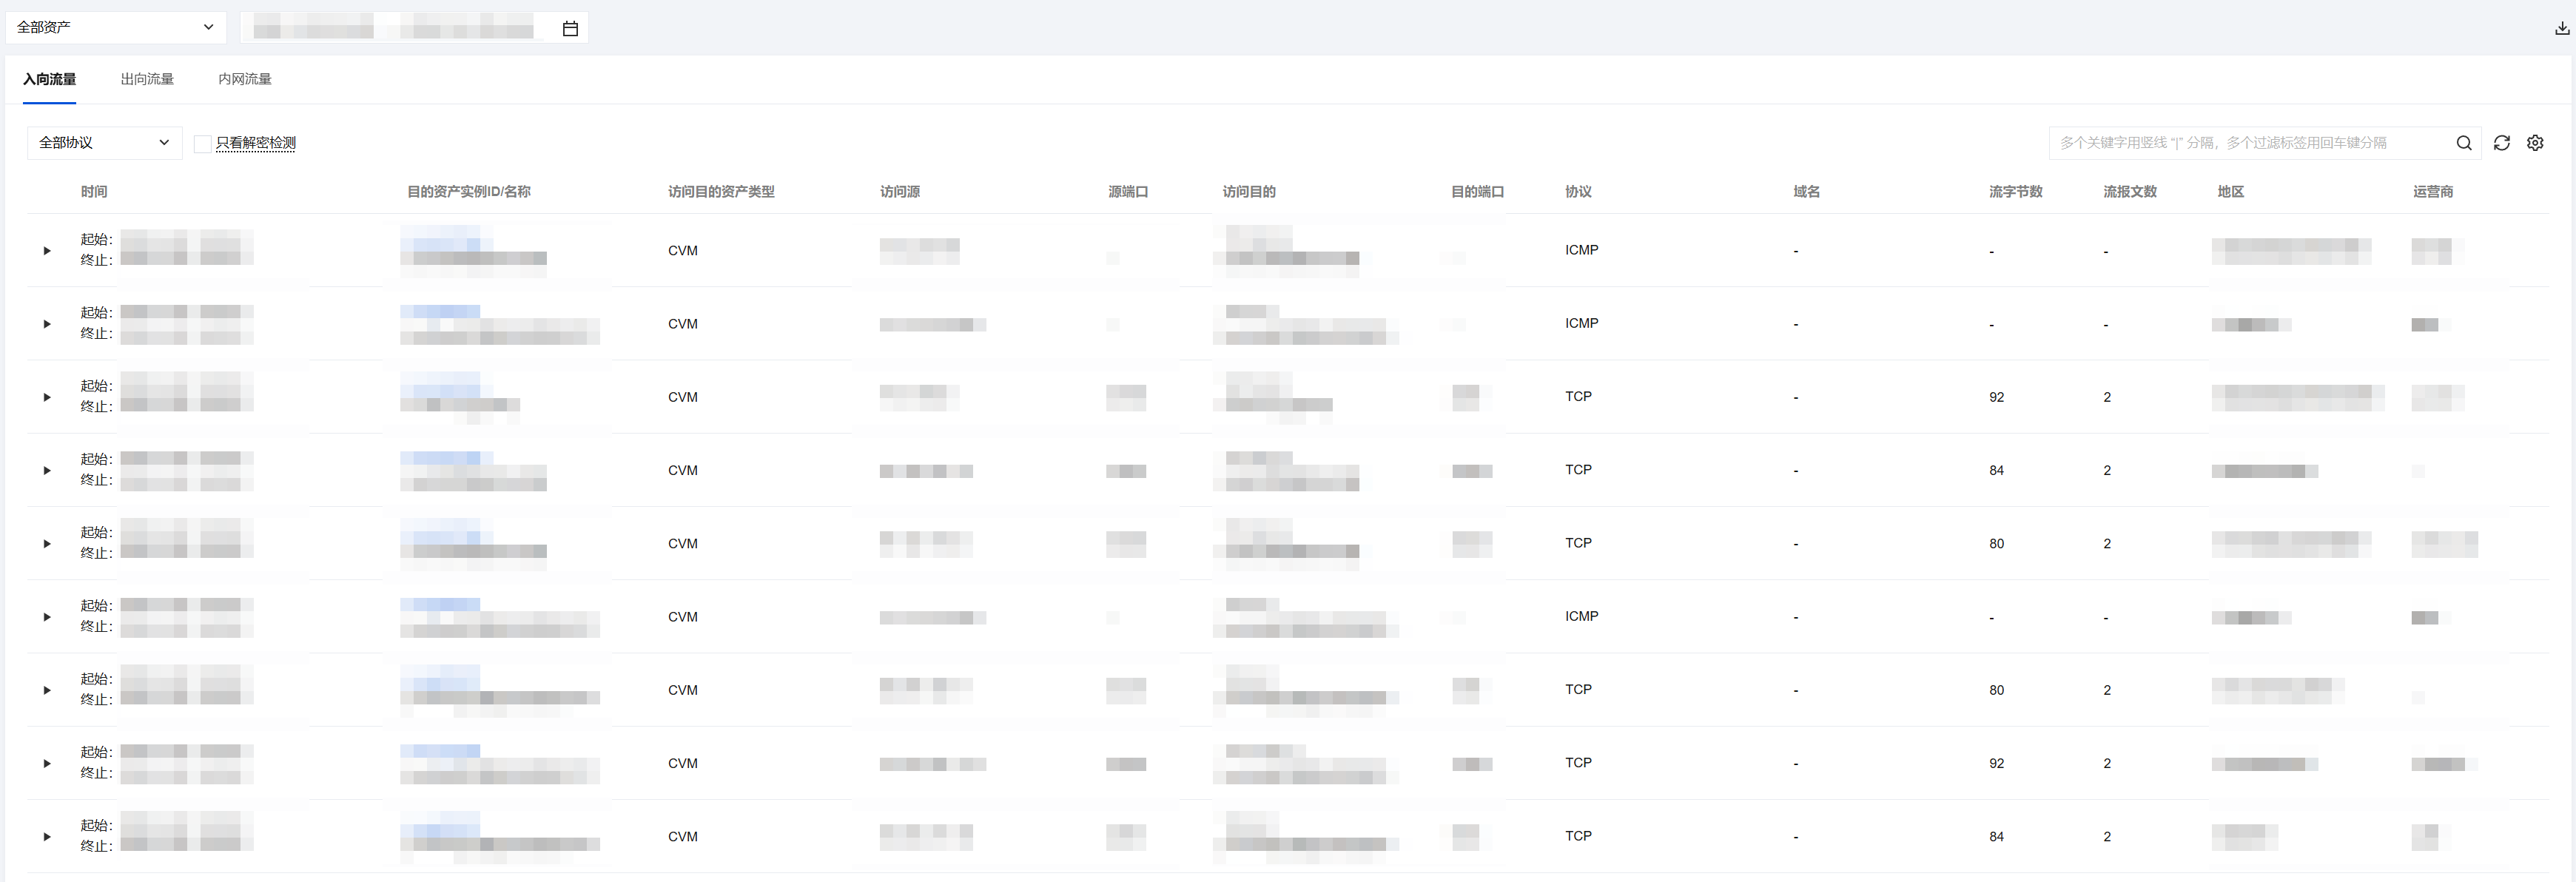
Traffic Analysis Log: Support viewing NDR analysis logs, including Traffic in, Traffic out, and Private Network Traffic.
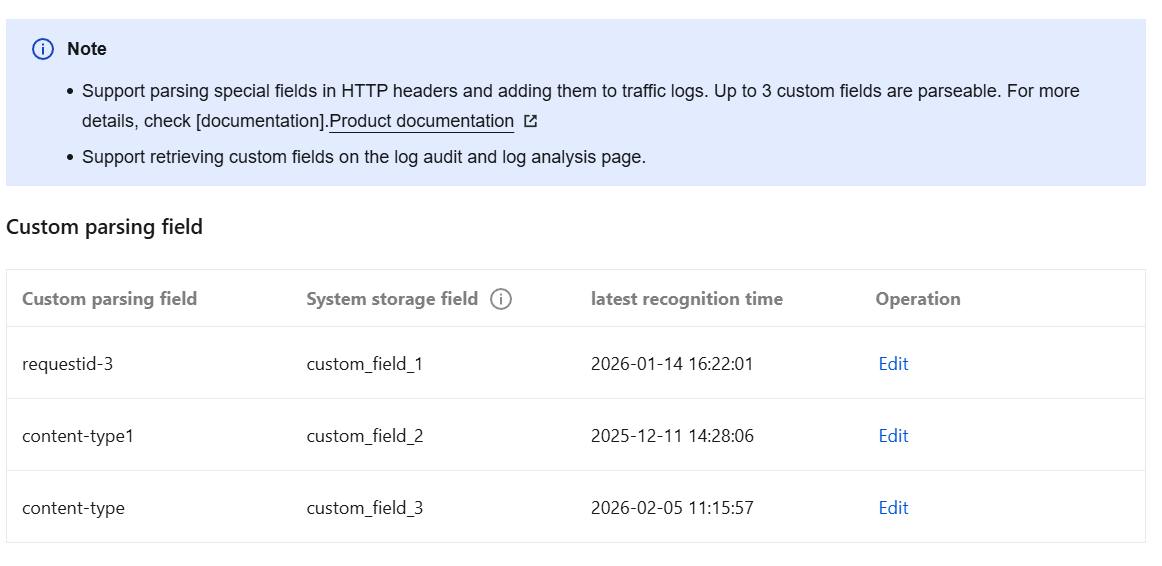
Click Log Parsing Settings in the upper-right corner, select the target custom parsing fields, click Edit to customize parsing of specific fields in HTTP Headers, and add them to traffic logs. Up to three custom fields can be parsed.
Select Decryption detection, and the page will only display logs decrypted and inspected by NDR.
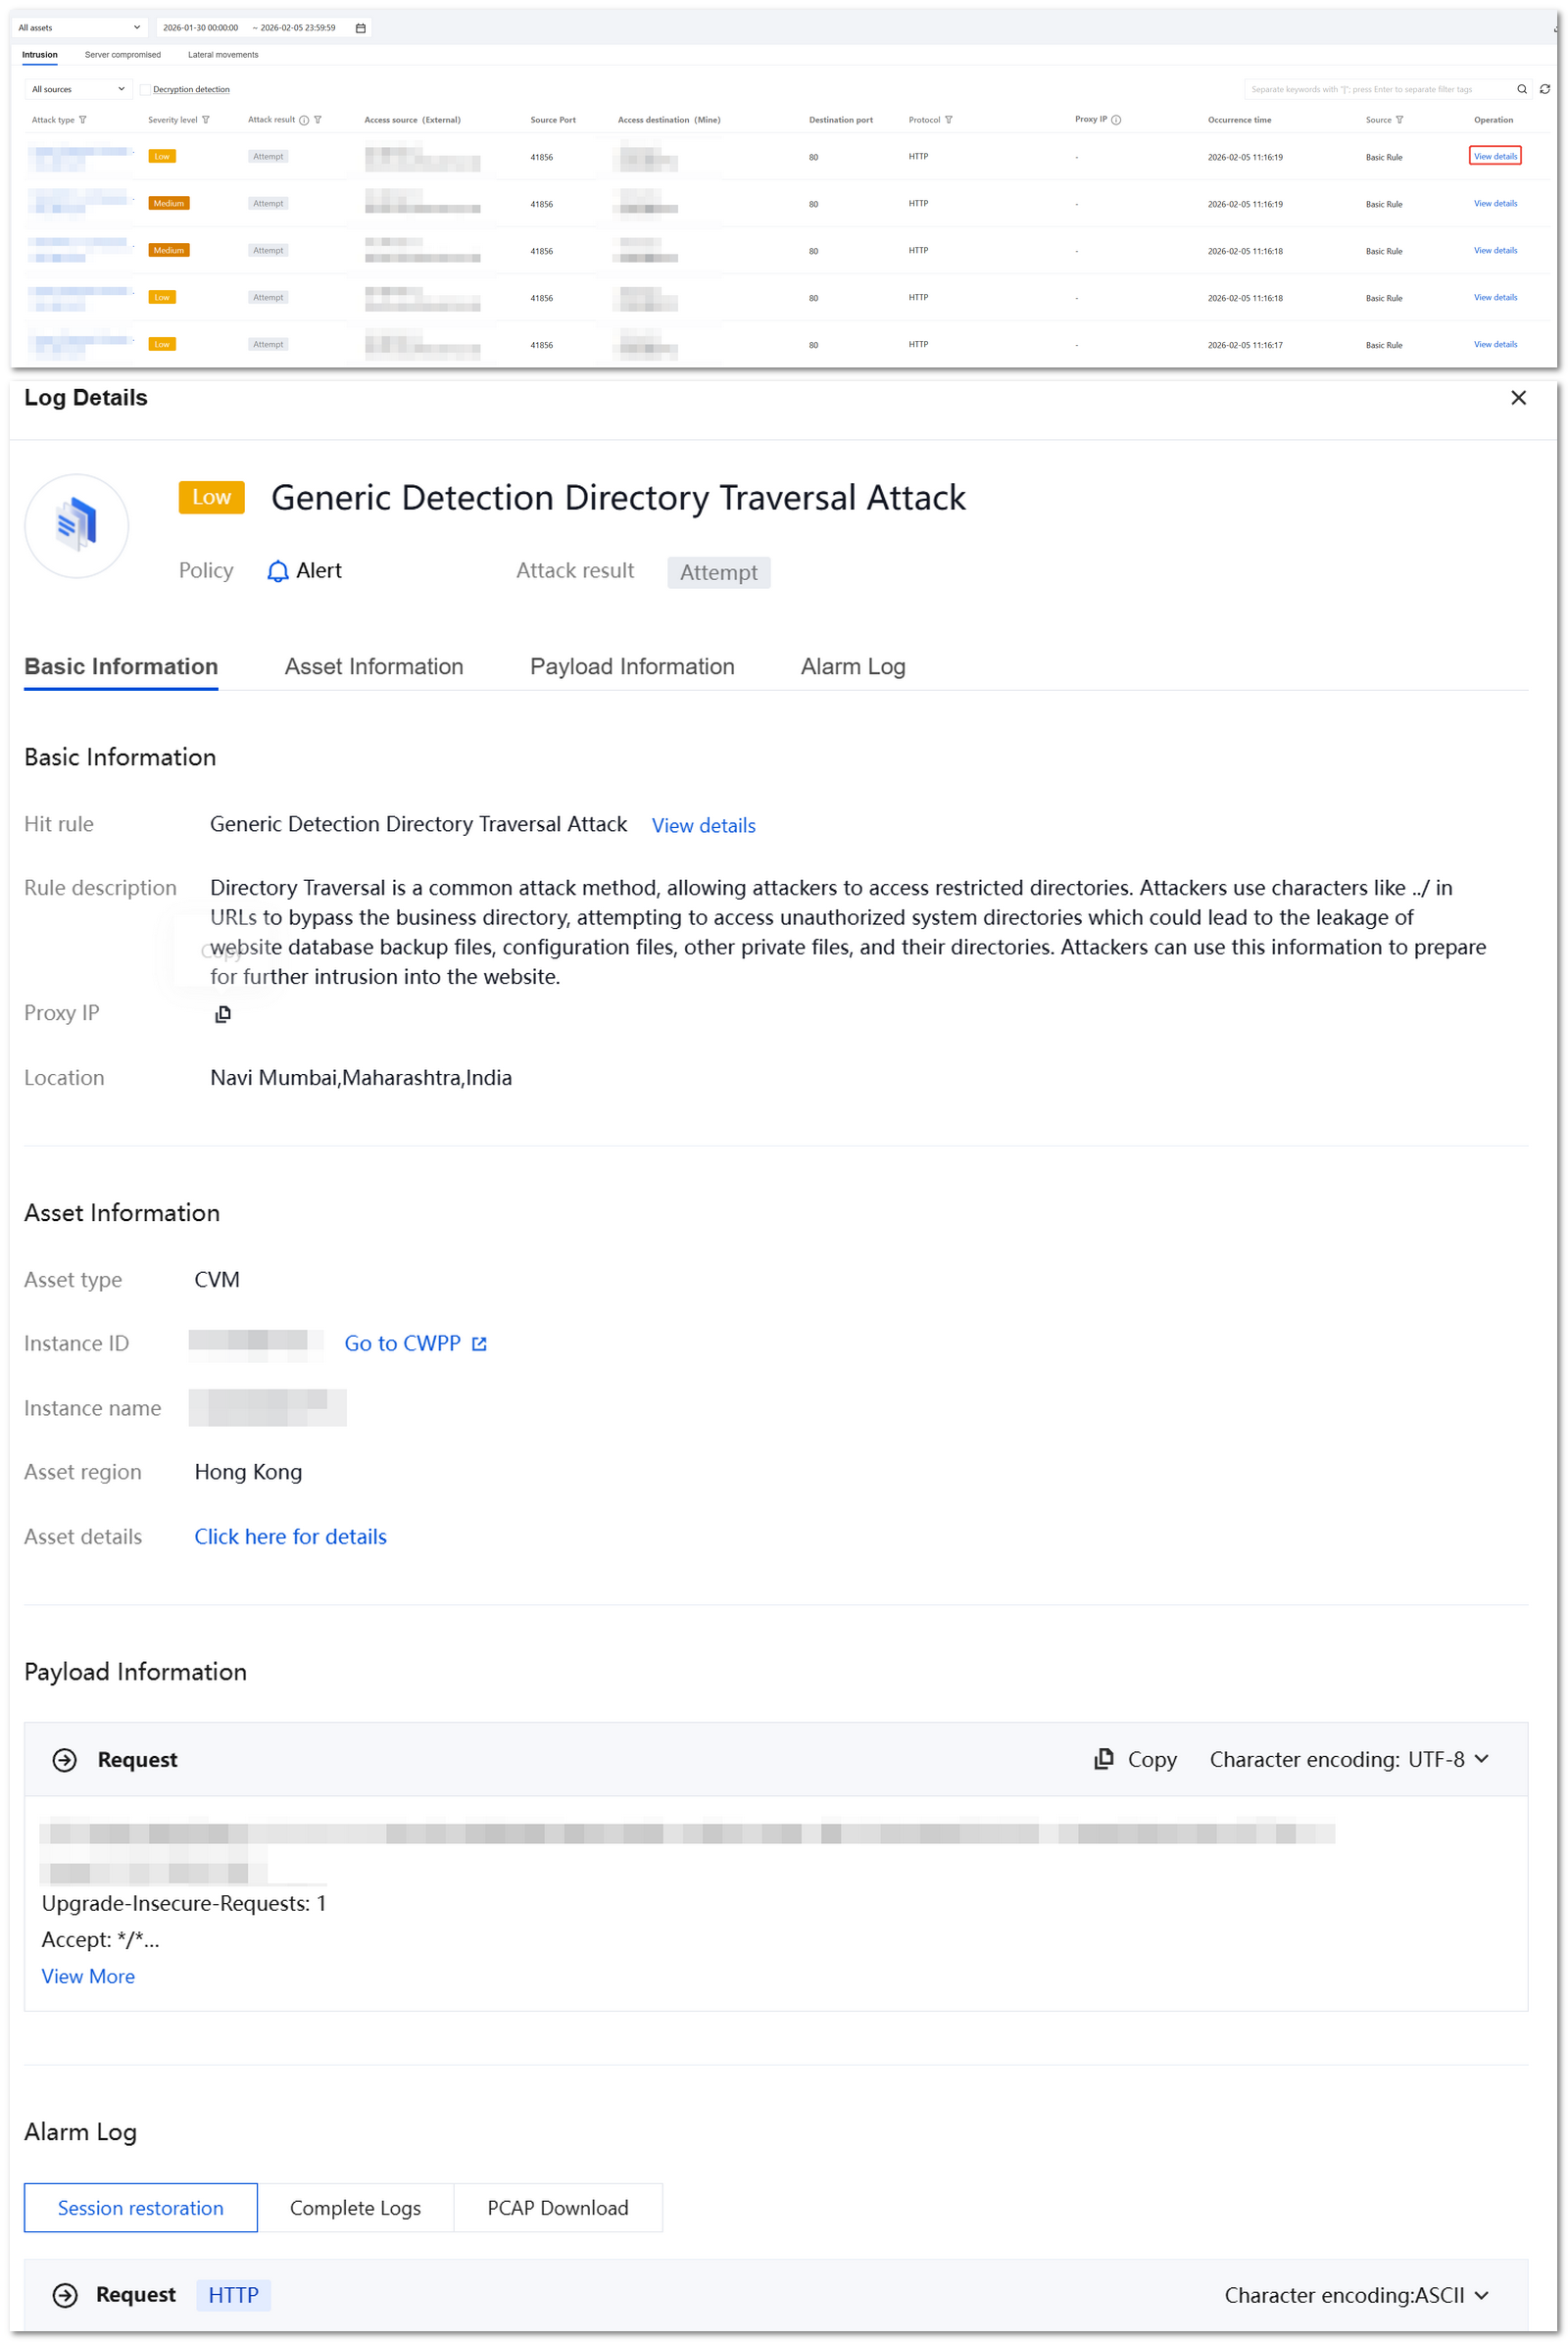
Traffic Alarm Log: Support viewing NDR alarm logs, including Intrusion, Server compromised, Lateral movements, and support filtering and querying by attack result.
Select Decryption detection, and the page will only display logs decrypted and inspected by NDR.
Click View details to view details of traffic alarm logs, session replay, complete logs, and PCAP download.
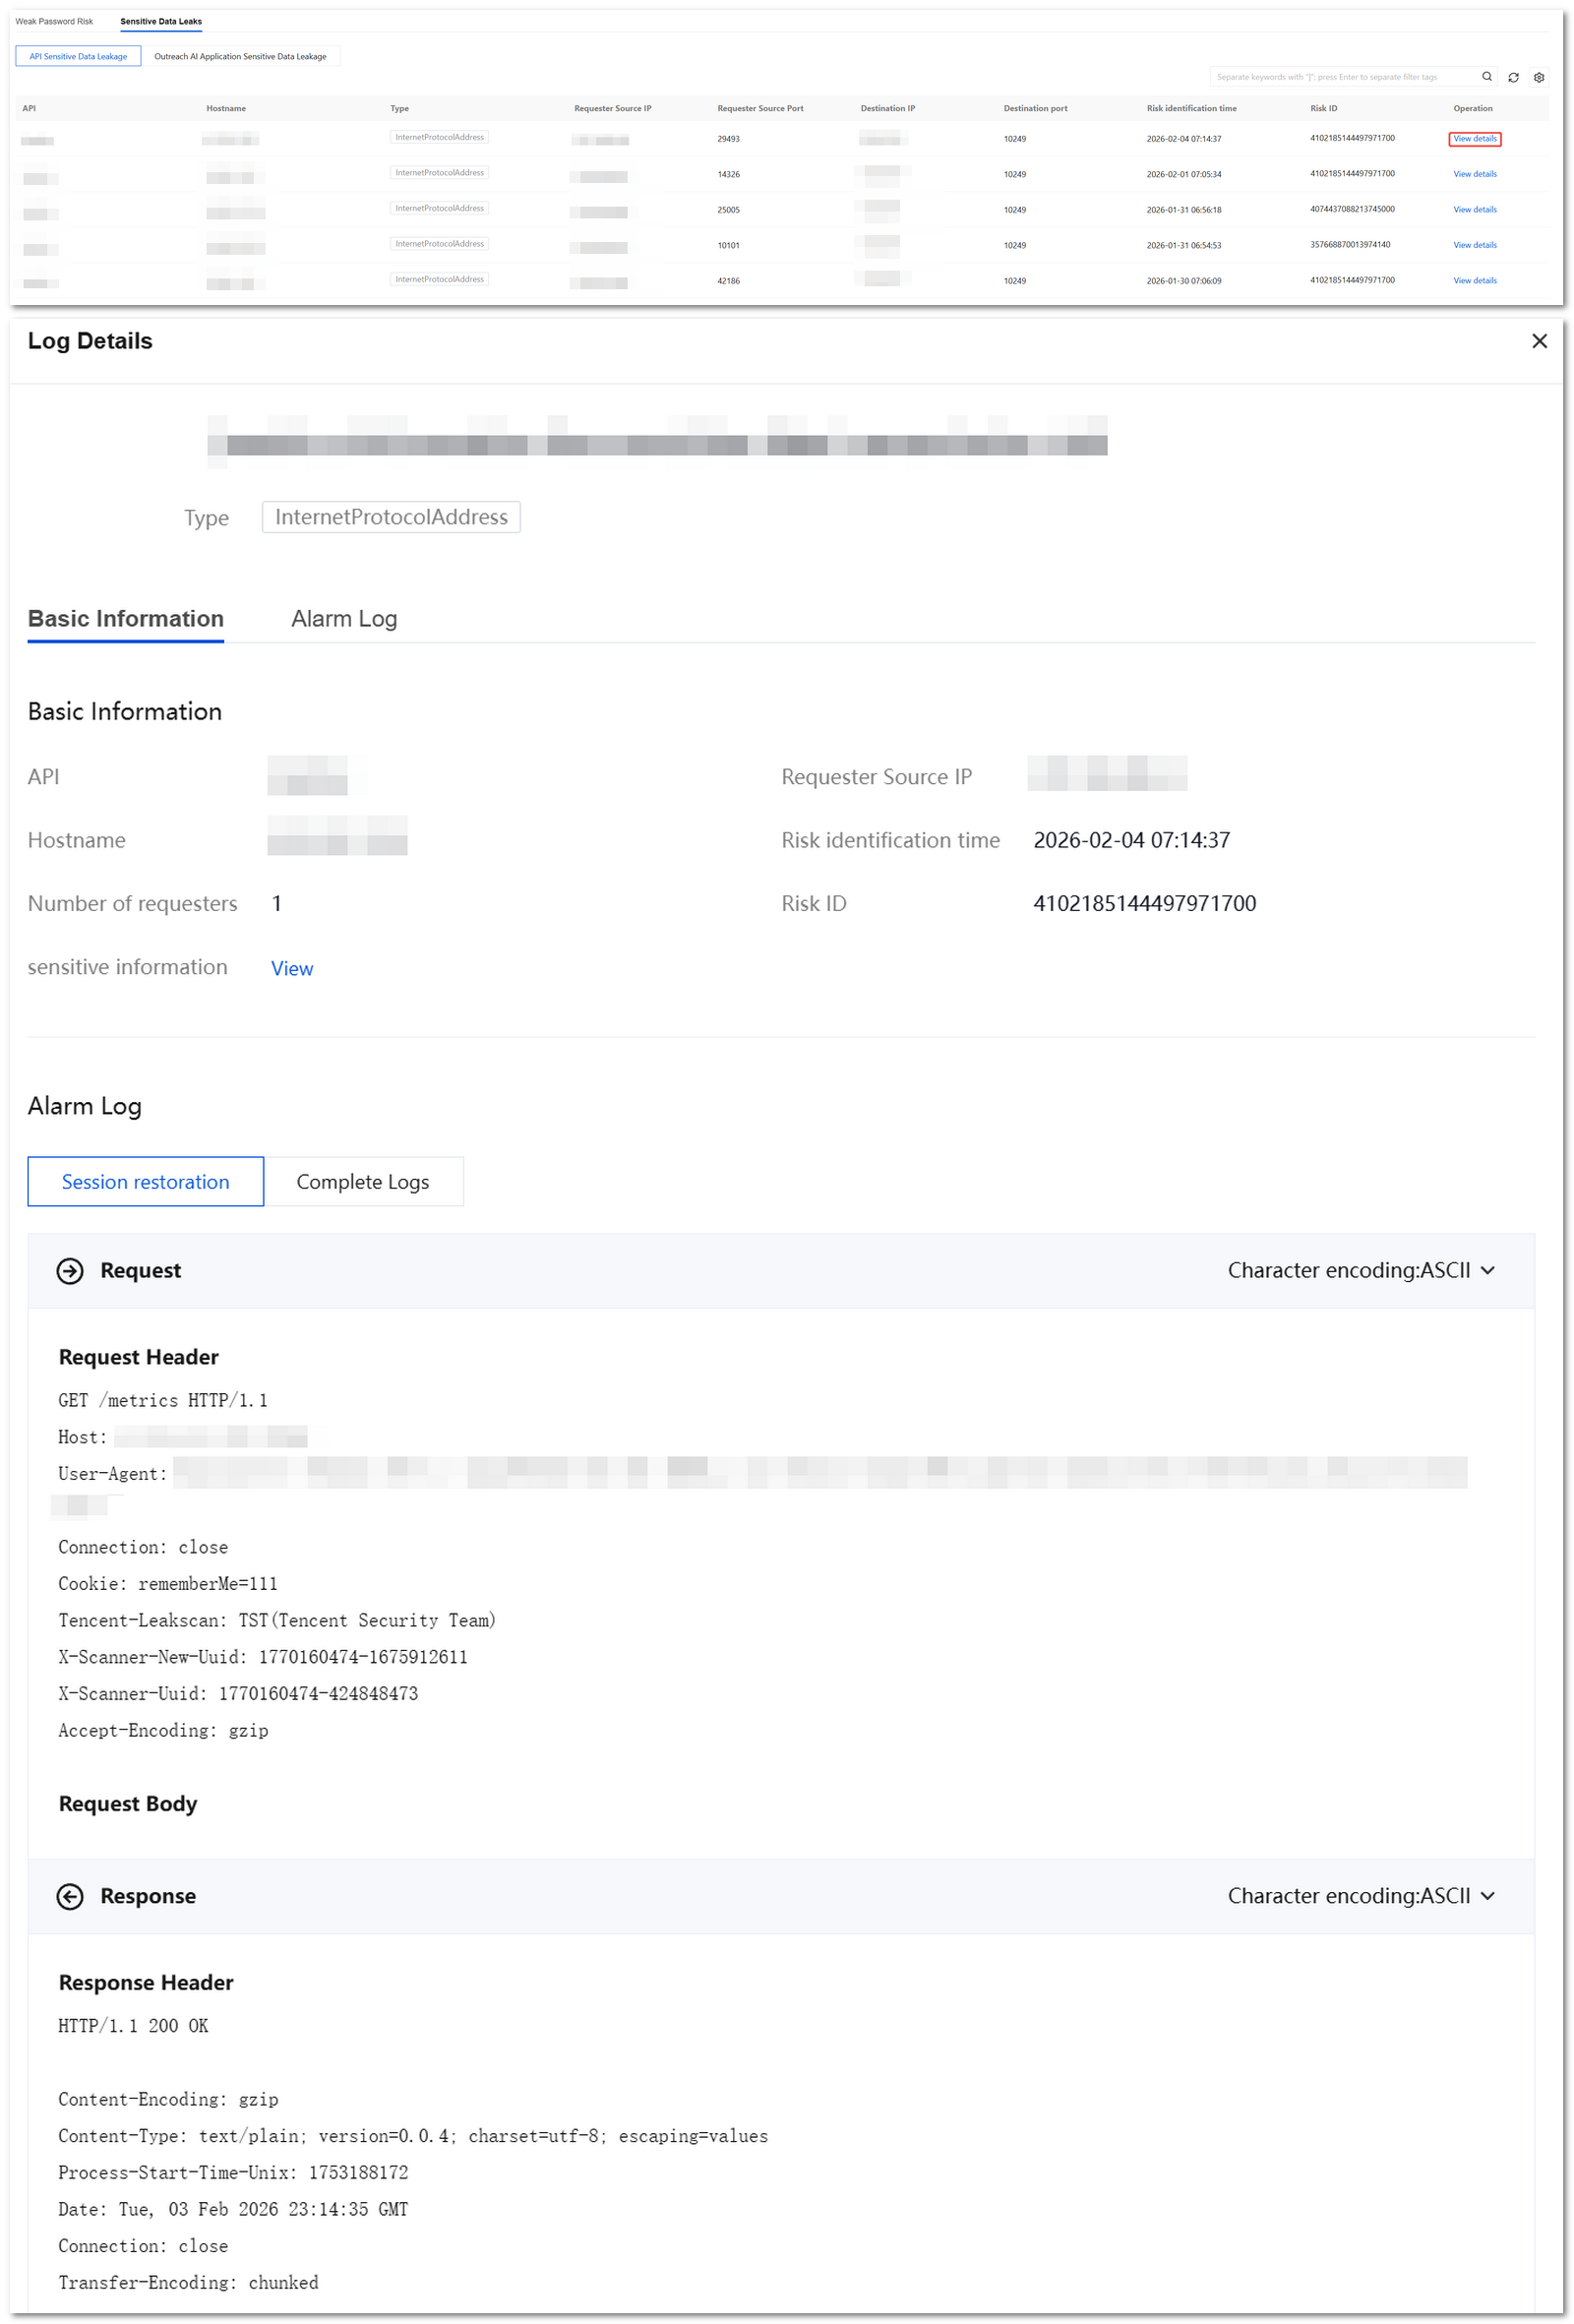
Traffic Risk Log: Support viewing NDR risk logs, including Weak Password Risk and Sensitive Data Leaks.
On the Sensitive Data Leaks page, you can click API Sensitive Data Leakage or Outreach AI Application Sensitive Data Leakage to view the corresponding risk logs.
Click View Details to view details of traffic risk logs.
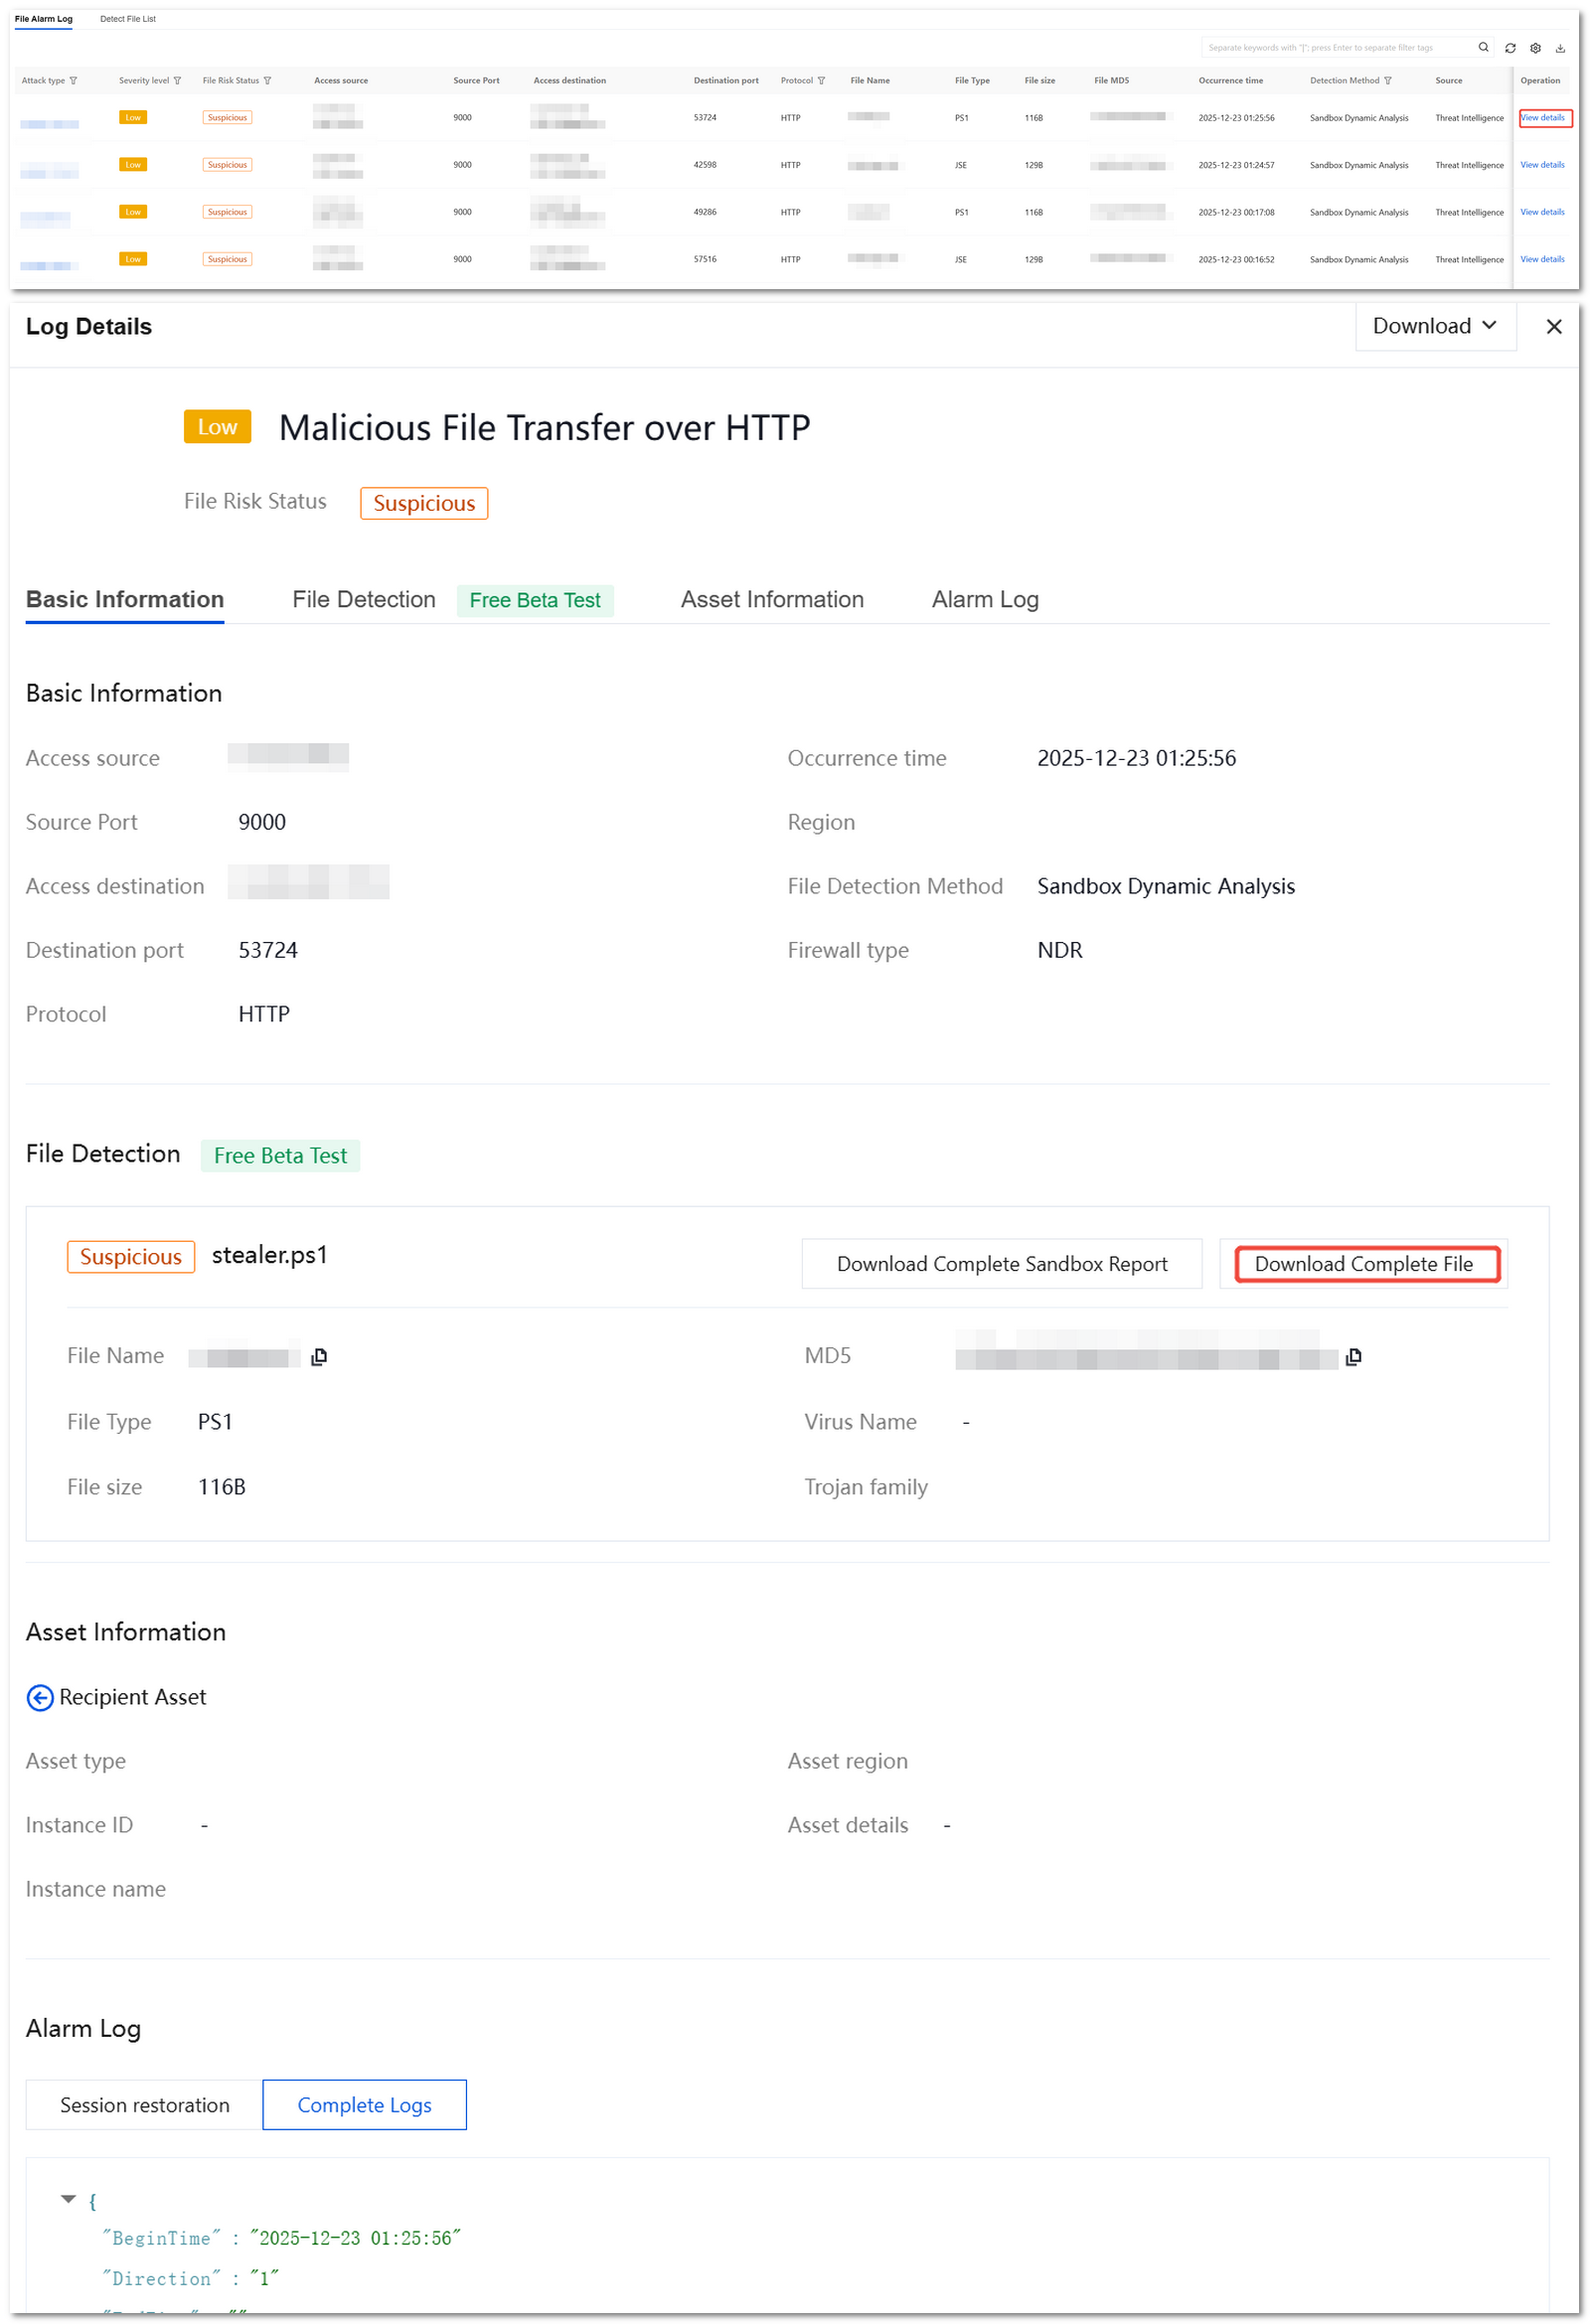
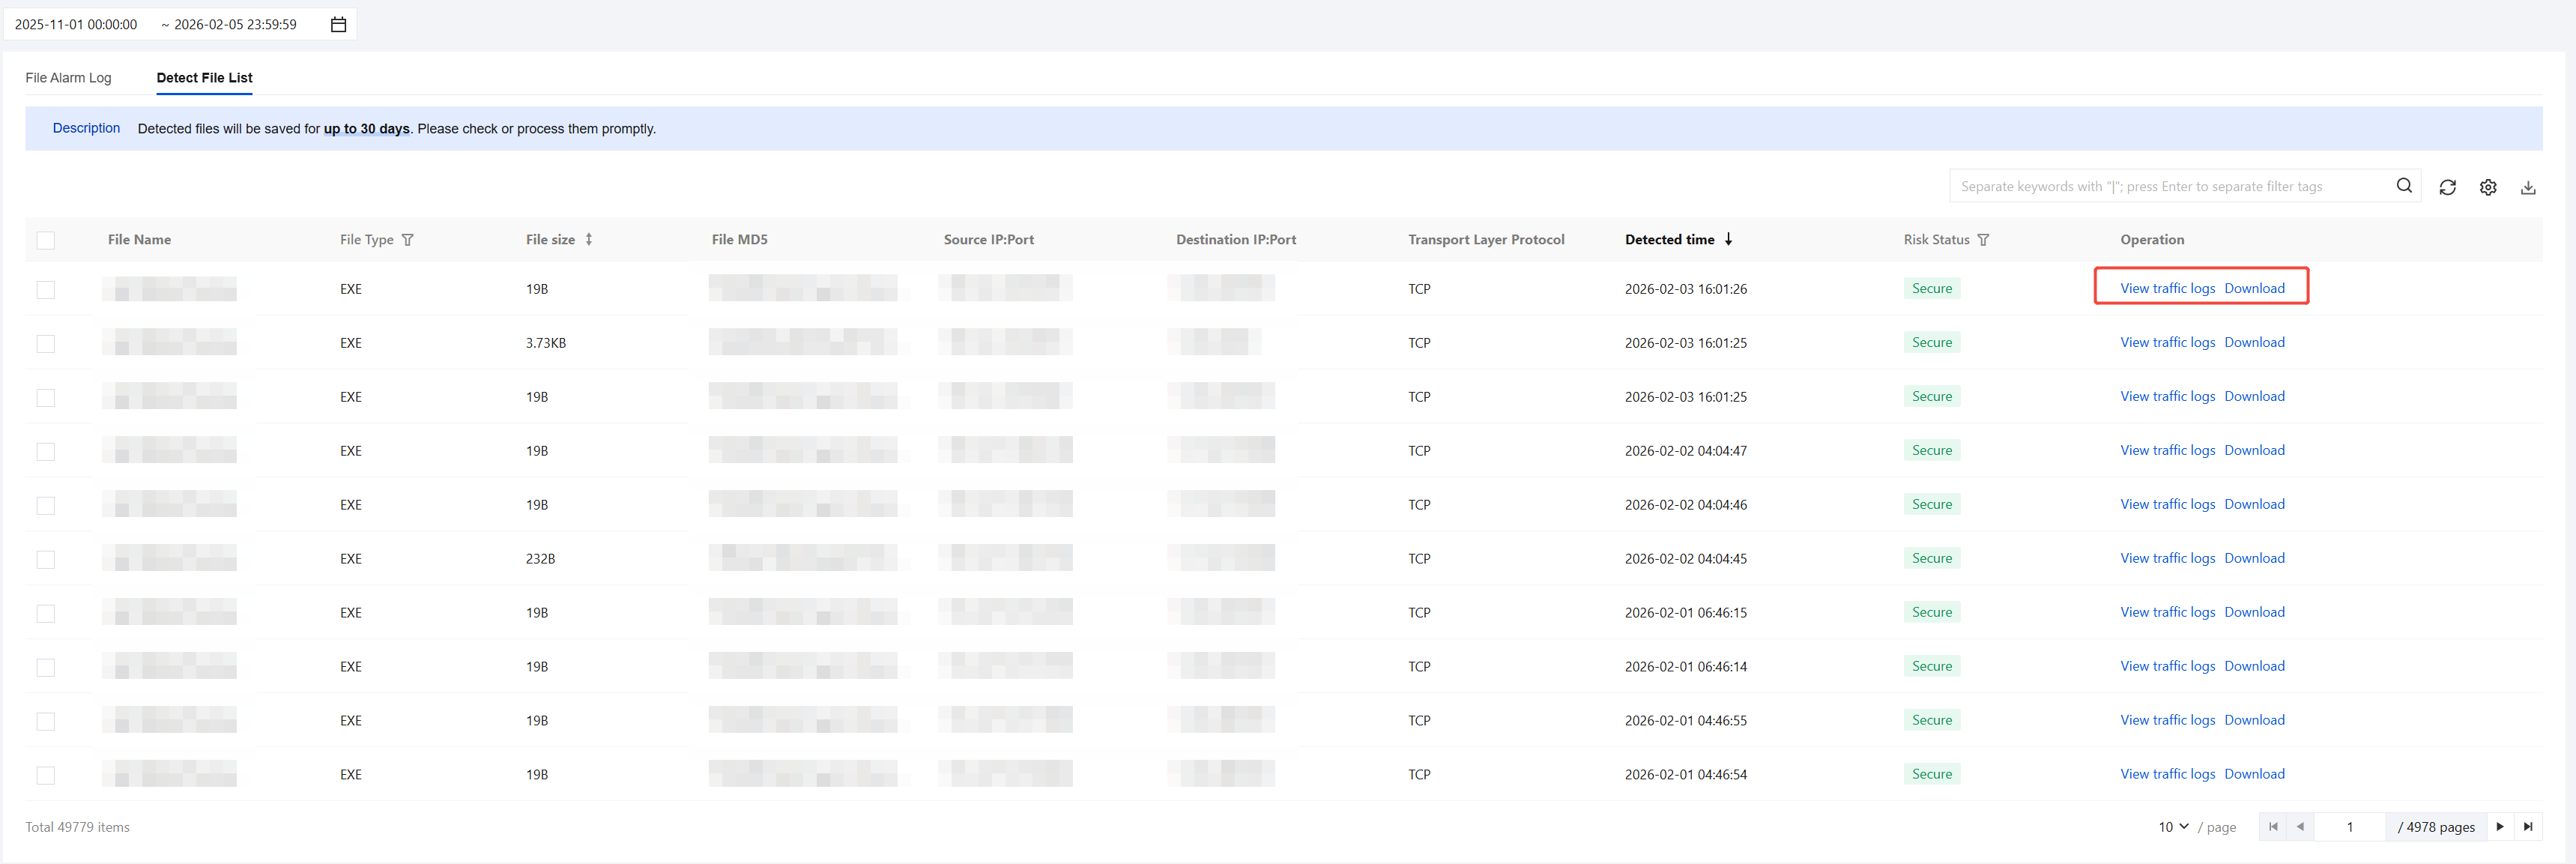
File Detection Log: Support viewing NDR file detection logs, including File Alarm Log and Detect File List.
File Alarm Log: Click View Details to view file alarm log details and download the complete file.
Detected File List: Supports viewing file details. Click View traffic logs or View alarm logs to navigate to the corresponding log page; or click Download to download the file.
Note:
Detected files will be retained for up to 30 days; please view or process them promptly.
Viewing Traffic log
1. Log in to the CFW console, and in the left sidebar, choose Log Auditing > Traffic Log. 2. On the Traffic Logs page, you can view the 10-tuple information of north-south traffic generated by inbound and outbound Internet Firewall and NAT Firewall, as well as the east-west traffic between VPCs.
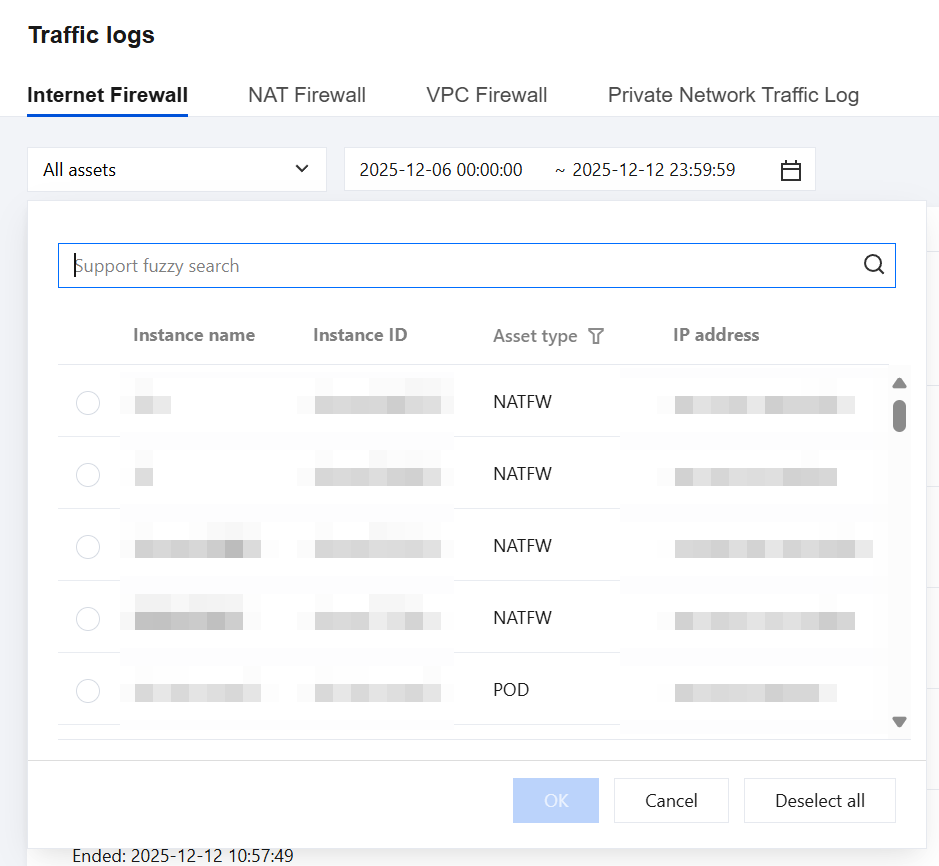
3. Use asset instance names to query and filter logs. To holistically view traffic from the asset perspective, click All Assets in the upper-left corner of the Traffic Logs page, then filter logs by entering an asset instance name in the search dropdown to query all traffic logs for that asset.
4. To further speed up log search and filtering, click the next to the access source or access destination to view all traffic between these two IP addresses. Viewing Operation Log
1. Log in to the CFW console, and in the left sidebar, choose Log Auditing > Operation Log. 2. On the Operation Log page, view all operations you performed on the security policy page and the firewall toggles page within the current account, as well as their details.
|
Firewall Toggle | Records the status of the firewall switch and users' operation details on the instance configuration. |
Asset Management | Records users' operations in the Asset Center module. |
Access Control | Records users' operations for adding, editing, and deleting access control rules. |
Intrusion Defense | Records users' operations in the intrusion prevention module. |
Common Tool | Records users' operation details on Common Tool. |
Network Honeypot | Records users' operations on honeypot services and exposure probes. |
Log Operation | Records users' operation details on different log types. |
Setting Operation | Records users' operation details on settings of various modules. |
Logins | Records the login activities of the user's accounts. |
System Log | Records the system events. |
Related Information
If you encounter issues related to Log Auditing, refer to the Log-Related documentation. 


