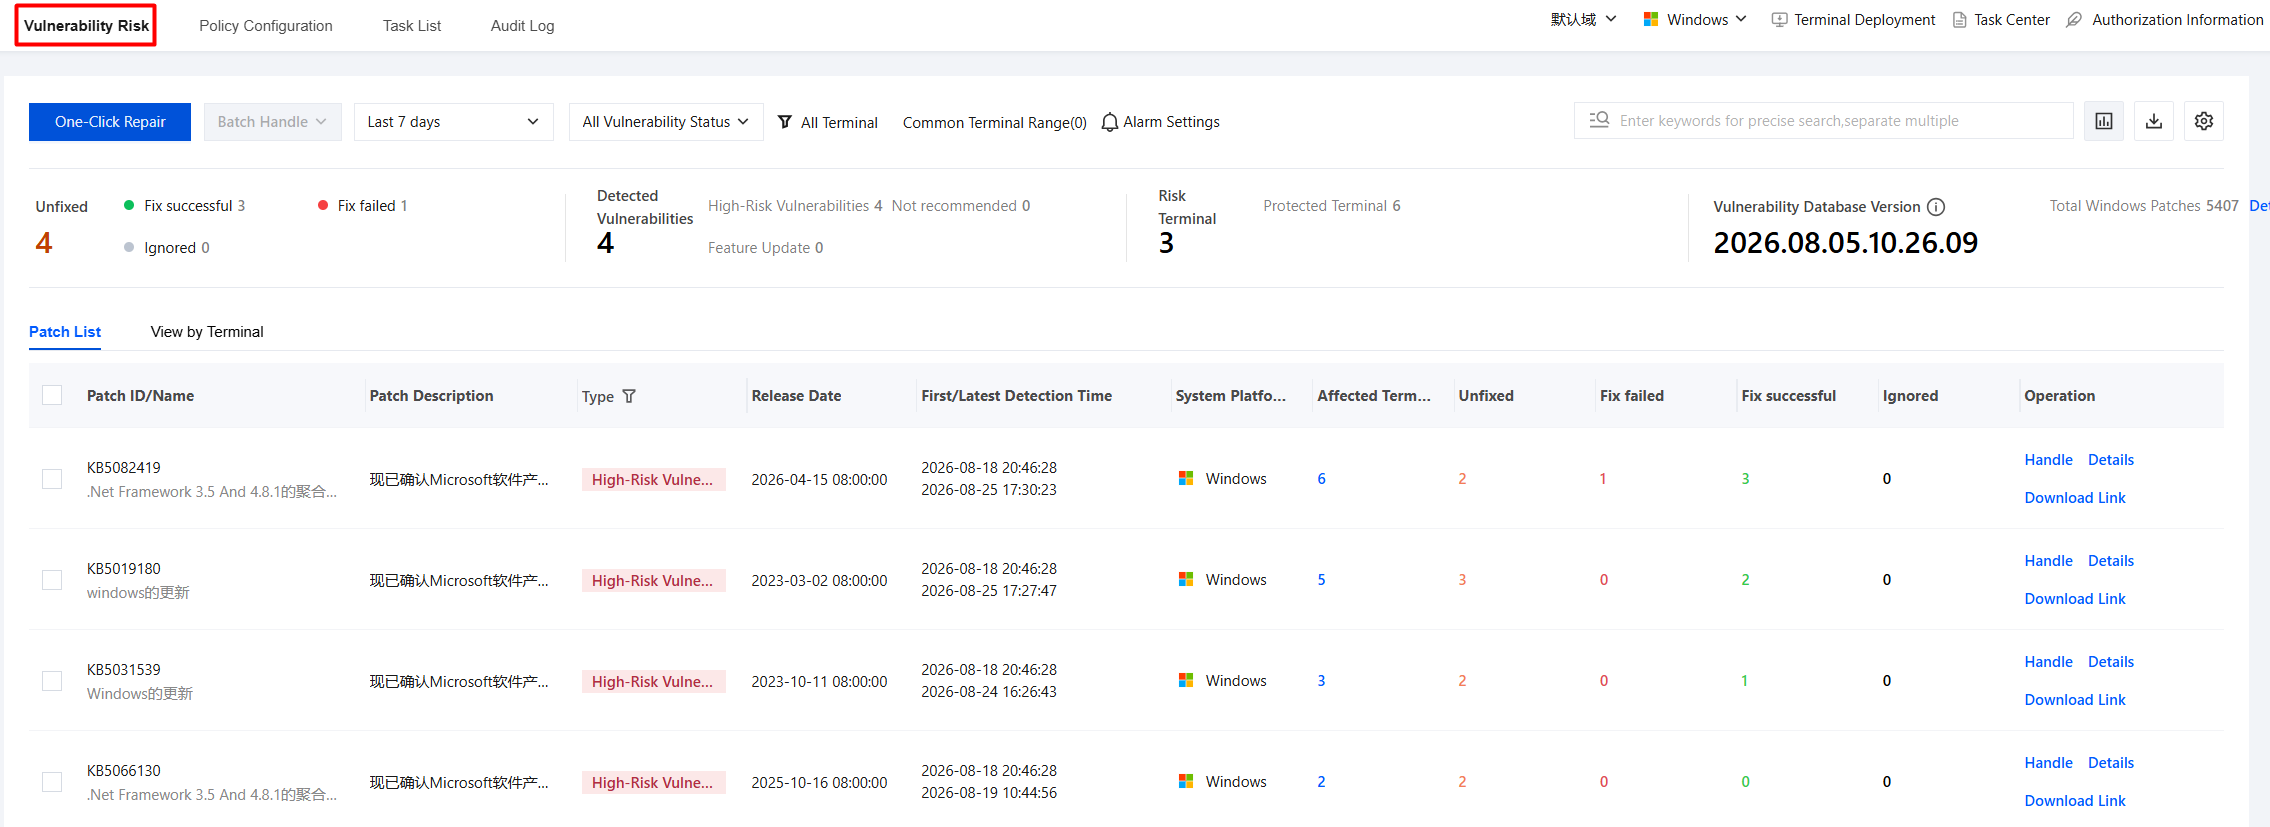
2. On the Vulnerability Risk page, the detected vulnerability details are displayed, and data filtering and statistics are supported.
Time filtering: 7 days by default, and users can customize the filtering range.
Vulnerability status: supports filtering by Pending, Remediation Succeeded, Remediation Failed, and Ignored.
Terminal scope: Click to display the terminal filtering component, which shows vulnerability-related data for the target terminals. All terminals are selected by default.
Common terminal scope: a general preset capability for saving and managing terminal filtering criteria that users frequently query, facilitating quick access.
Supports viewing by patch list perspective and terminal perspective.
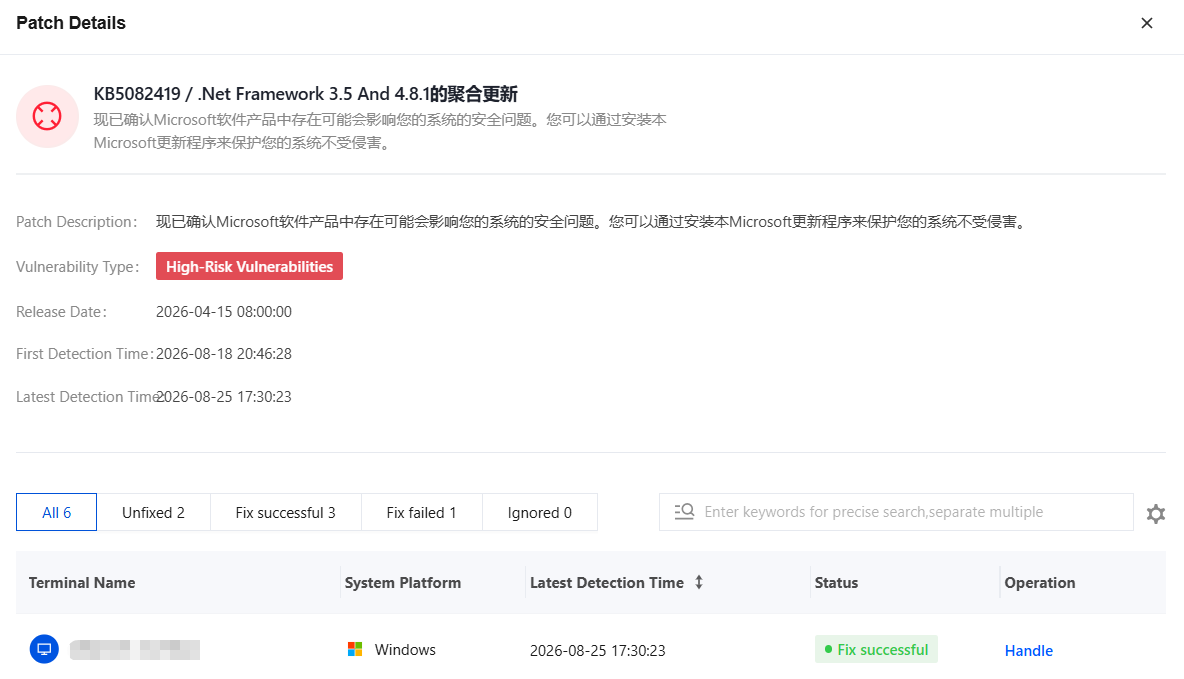
3. Select the target patch and click Details to view specific vulnerability information.
One-Click Remediation
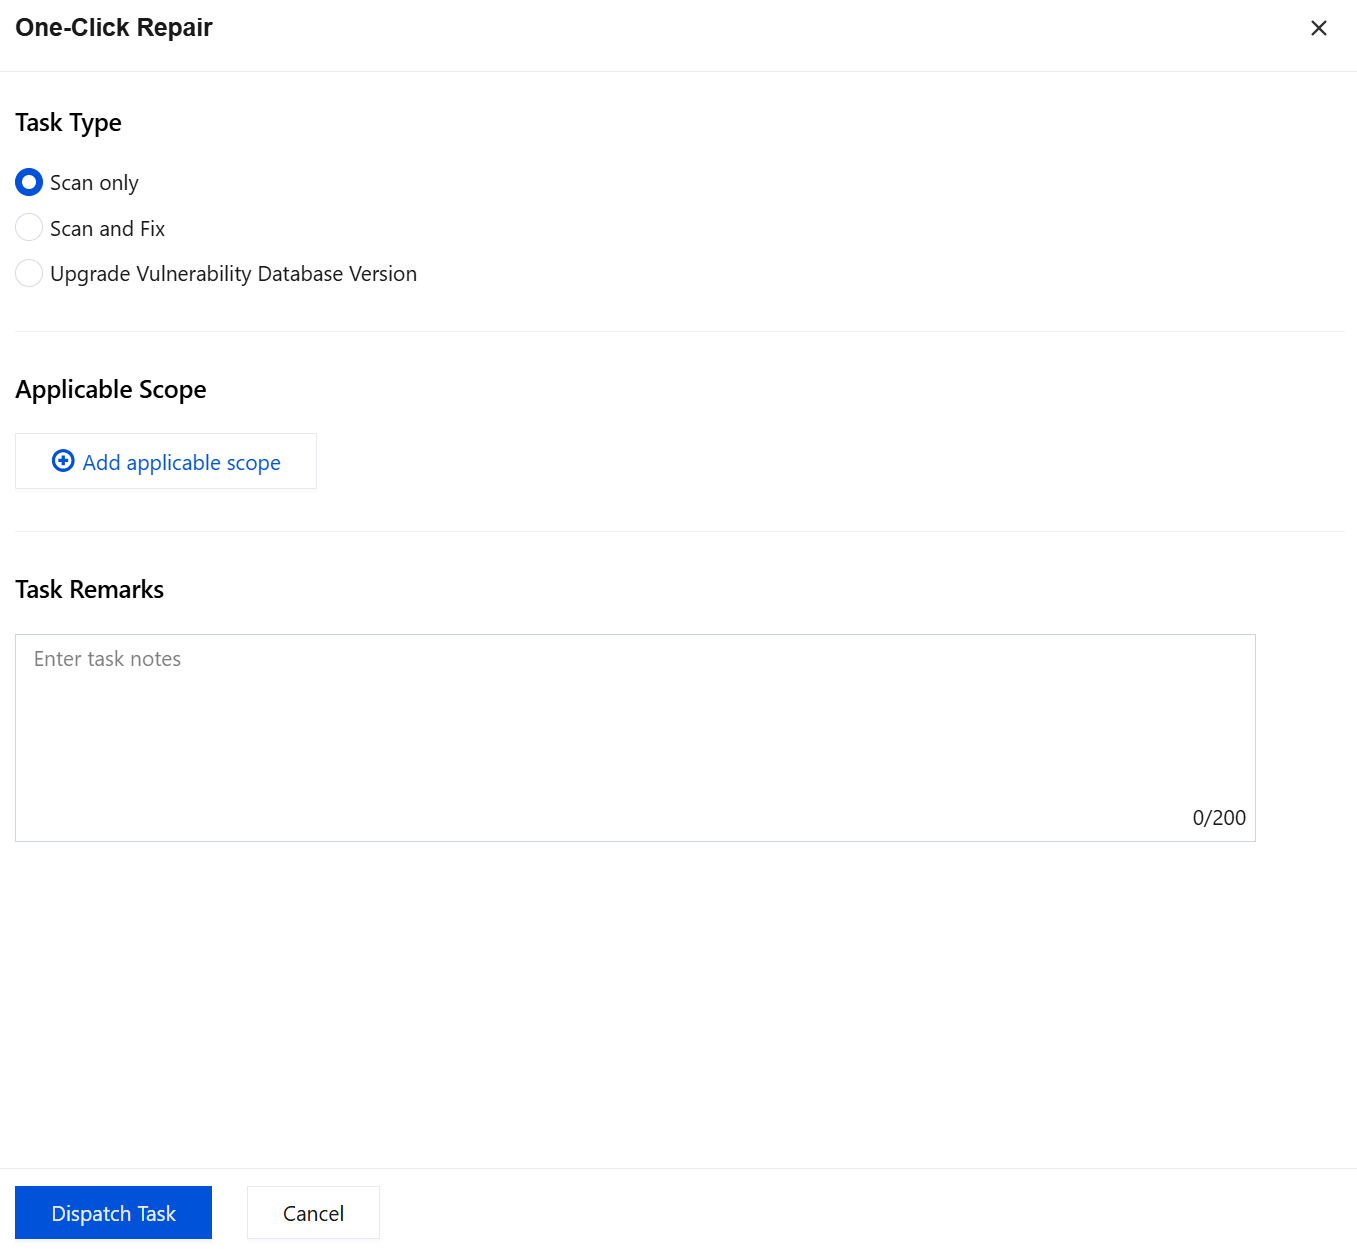
1. On the Vulnerability Risk page, click One-Click Repair.
2. On the One-Click Remediation page, configure parameters such as task type, applicable scope, and task remarks, and click Dispatch Task.
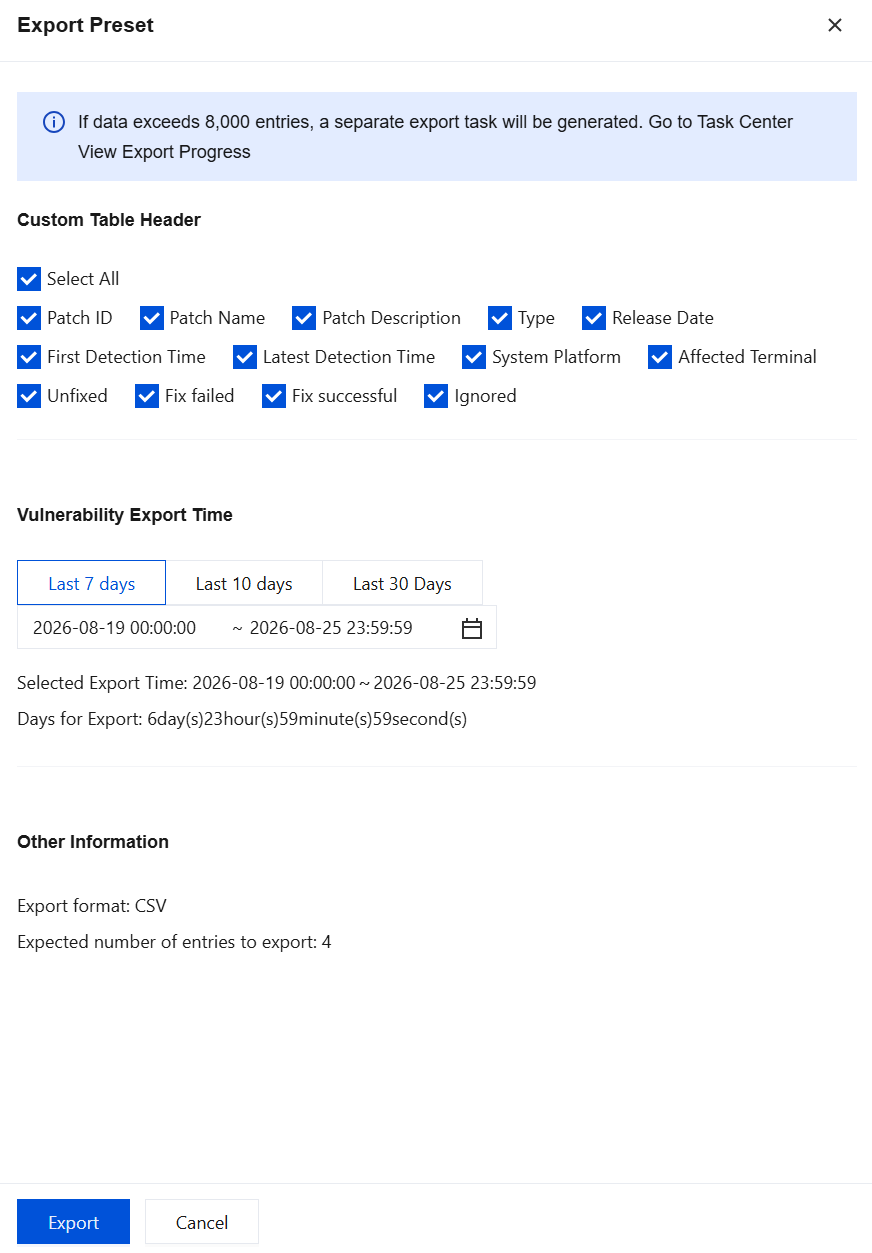
Exporting data
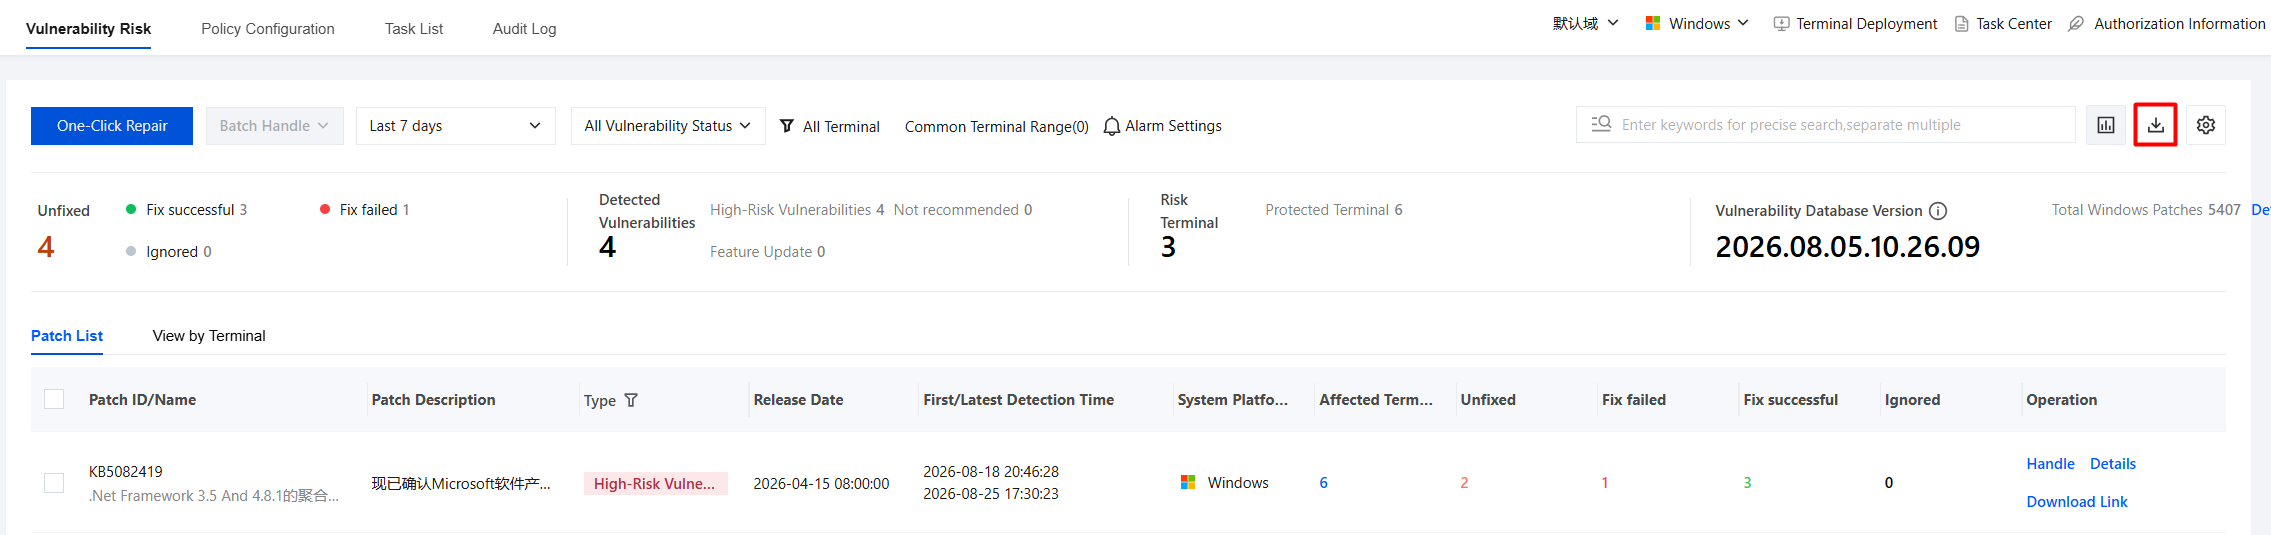
1. On the Vulnerability Remediation page, click the
button in the upper-right corner.
2. Select the custom header and export time parameters, and then click Export.