Querying and Downloading Blocking and Deadlock Events
Download
Focus Mode
Font Size
Last updated: 2026-07-30 17:20:57
TencentDB for SQL Server supports recording blocking events and deadlock events. Through these records, you can identify the detailed information of the SQL statements causing blocking and deadlock for optimization purposes.
This article describes how to query and download blocking events and deadlock events.
Note:
Blocking events and deadlock events are supported only in the Enterprise editions of 2012, 2014, 2016, 2017, 2019, 2022, and 2025. They are not supported in the 2008 R2 Enterprise edition.
The log time defaults to Beijing time. If the default time zone is modified, the storage time of log data will be displayed in the time zone of the instance server, while the console will show Beijing (UTC+8) time.
Prerequisites
Querying and Downloading blocking and deadlock events requires enabling the collection of blocking and deadlock events first.
Background
In databases, to maintain data consistency, when a session modifies a specific resource without completing the modification, the system will not release this specific resource. This prevents other concurrent sessions from accessing or modifying the same resource. When slow SQL or other exceptions occur, resources may be occupied for extended periods, severely impacting other sessions and causing blocking events.
On the other hand, if multiple transactions compete for resources—for example, the first transaction holds resource A and attempts to acquire resource B held by the second transaction, while the second transaction holds resource B and attempts to acquire resource A held by the first transaction—a deadlock event occurs.
To address these issues, TencentDB for SQL Server provides a feature in the console to record blocking and deadlock events. Once enabled, this feature helps quickly locate blocking and deadlock events in the database, allowing you to identify and optimize the detailed information of the executed SQL statements causing these issues.
Related Information on Blocking and Deadlock Events
The collection of blocking and deadlock events is disabled by default. You can enable it manually. Once enabled, blocking and deadlock events will be collected, and the file will record detailed SQL information causing the blocking and deadlock.
After the collection of blocking and deadlock events is enabled, the default collection threshold is 1000 ms (1000 ms = 1 second). SQL executions exceeding 1000 ms will be recorded as blocking SQL and deadlock SQL. The collection threshold can be customized in the range of 1000 ms - 86400000 ms.
Blocking and deadlock event files are collected every 5 minutes by default. That is, within every 5-minute interval, SQL executions exceeding 1 second will be recorded.
The retention period for blocking and deadlock events defaults to 7 days, after which they are automatically deleted.
Blocking and Deadlock Events File Generation and Download Policy
You can download blocking event or deadlock event files to view the corresponding log data for troubleshooting. Before downloading files, you can understand the file generation and download policy through the following description to query and download files more efficiently.
When the instance reaches the collection frequency for blocking or deadlock events and blocking or deadlock event log data is generated, the console will generate blocking or deadlock event log files and support downloading them.
When the instance reaches the collection frequency for blocking or deadlock events but no blocking or deadlock event log data is generated, the console will not generate blocking or deadlock event log files and does not support downloading them.
When the instance has not reached the collection frequency for blocking or deadlock events but blocking or deadlock event log data is generated, you can click the Download button to generate blocking or deadlock event log files and download them.
When the instance has not reached the collection frequency for blocking or deadlock events and no blocking or deadlock event log data is generated, you cannot generate blocking or deadlock event log files by clicking the Download button, nor is downloading supported.
Enable Collection of Blocking and Deadlock Events
Note:
The collection of blocking and deadlock events can only be enabled or disabled together; currently, separate collection settings are not supported.
2. Select a region at the top, find the target instance, click Instance ID or click Manage in its Operation column to go to the instance management page.
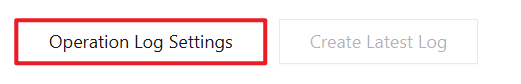
3. On the instance management page, select the Operation Log tab.
4. Click Operation Log Settings.
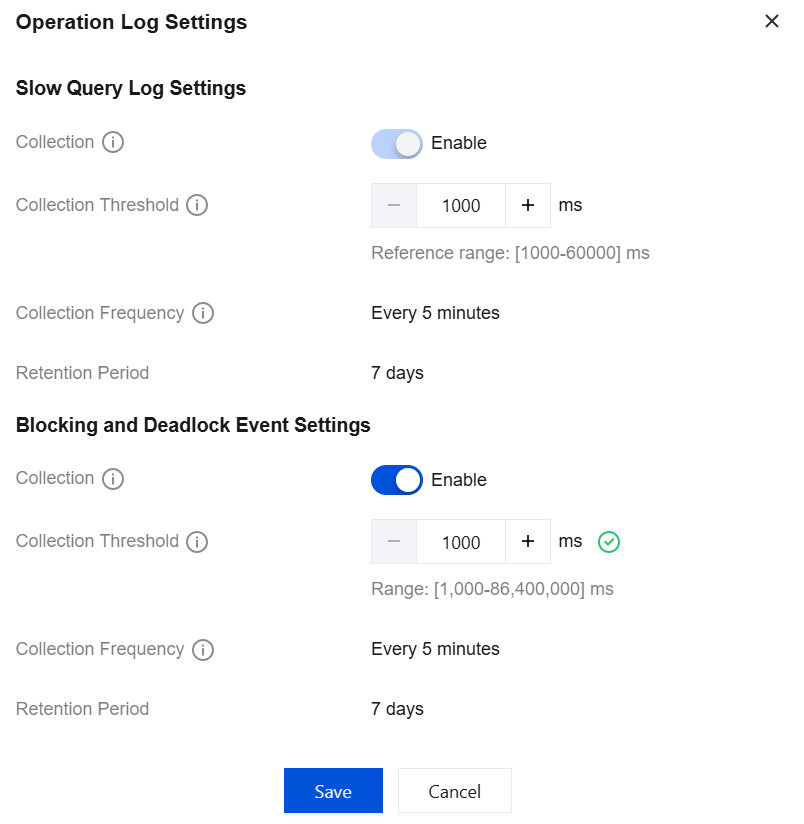
5. Complete the following configuration in the pop-up window and click Save.
Parameter
Description
Collection
Enable this feature button.
Collection Threshold
Set the collection threshold. Reference range: 1000 - 86400000 milliseconds.
Collection Frequency
By default, it is set to every 5 minutes and cannot be modified.
Retention Period
Retained for 7 days by default and automatically deleted upon expiration.
Method 2: Enable by setting the blocked process threshold parameter value
1. Log in to the SQL Server console, click the Instance ID in the instance list to go to the instance management page.
2. On the instance management page, choose Parameter Configuration > Parameter Settings, locate the row for parameter blocked process threshold. In the Current Running Parameter Value column, click
to set the value to a non-zero number.
Note:
The blocked process threshold parameter defaults to 0, indicating that blocking and deadlock events are not collected.
The blocked process threshold parameter value range: 0 - 86400, unit: seconds.
When the current running value of the blocked process threshold parameter is not 0, it indicates that blocking and deadlock events are collected, and the corresponding collection switch in Operation Log Settings will be enabled.
Querying and Downloading Blocking and Deadlock Events
1. On the instance management page, choose Operation Log > Blocking Event or Operation Log > Deadlock Event to view the corresponding event lists.
The supported fields include: File Name, Start Time, Last Updated Time, File Size, Operation (Download).
Logs can be searched based on time ranges: Last 5 minutes, Last 15 minutes, Last 30 minutes, Last 1 hour, Last 3 hours, Last 24 hours, Today, Yesterday, Last 3 days, Last 7 days, Last 30 days, and Custom time range.
2. In the Operation column, click Download to download the blocking event or deadlock event file.
Note:
When Download is clicked, the following scenarios may occur.
If the file status is "Completed", after
If the file status is "Writing", when the file is not ready, clicking Download will display a message "Log file is being prepared" and downloading is unavailable. When the file is ready, you can copy the private network address and run the command to download it. The command format is: wget -c 'File download address' -O 'Custom filename', or download it locally.