- Release Notes and Announcements
- User Guide
- Product Introduction
- Purchase Guide
- Getting Started
- Operation Guide
- Access Management
- Instance Management
- Node Management
- Version Upgrade
- Monitoring
- Backup and Rollback
- Data Security
- SSL Authentication
- Database Management
- Multi-AZ Deployment
- Public Network Access
- Disaster Recovery/Read-Only Instances
- Parameter Configuration
- Recycle Bin
- Task Management
- Performance Optimization
- Data Migration Guide
- Best Practice
- Optimizing Indexes to Break Through Read/Write Performance Bottlenecks
- Troubleshooting Mongos Load Imbalance in Sharded Cluster
- Troubleshooting Excessive Slow Queries
- Fixing High CPU Utilization in MongoDB Instance Based on DBbrain
- Troubleshooting Excessive Connections
- Troubleshooting High Request Latency Based on Slow Log
- Troubleshooting High CPU Utilization
- Considerations for Using Shard Clusters
- Sample of Reading and Writing Data in MongoDB Instance
- Export and Import
- Troubleshooting MongoDB Connection Failures
- Performance Fine-Tuning
- Ops and Development Guide
- Troubleshooting
- API Documentation
- History
- Introduction
- API Category
- Making API Requests
- Instance APIs
- RenameInstance
- OfflineIsolatedDBInstance
- ModifyDBInstanceSpec
- IsolateDBInstance
- DescribeSpecInfo
- DescribeDBInstances
- DescribeClientConnections
- CreateDBInstanceHour
- AssignProject
- RenewDBInstances
- DescribeSlowLogs
- DescribeSlowLogPatterns
- InquirePriceRenewDBInstances
- InquirePriceModifyDBInstanceSpec
- InquirePriceCreateDBInstances
- DescribeDBInstanceDeal
- DescribeSecurityGroup
- DescribeInstanceParams
- ModifyDBInstanceSecurityGroup
- ModifyDBInstanceNetworkAddress
- Backup APIs
- Account APIs
- Task APIs
- Other APIs
- Data Types
- Error Codes
- Instance Connection
- FAQs
- Service Agreement
- Glossary
- Contact Us
If you find the request latency becomes obviously longer when using TencentDB for MongoDB, you can troubleshoot the problem in the following steps:
1. Check whether the "Latency" monitoring metric for instances is exceptional.
Log in to the TencentDB for MongoDB console, click an instance ID to enter the management page, and check the instance monitoring data on the System Monitoring tab. The "Latency" metric mainly reflects the time from a request arriving at the access layer to it returning to the client after being processed. If the request latency is high, check whether there are slow logs on mongod.
2. Check whether there are slow logs on mongod.
Log in to the TencentDB for MongoDB console, click an instance ID to enter the management page, and view the slow logs of the instance by using "Query statistics" on the Database Management > Slow Log Query tab.
Pay attention to keywords such as
command, COLLSCAN, IXSCAN, keysExamined, and docsExamined. For more log descriptions, see Log Messages.
The keywords that require attention include the following:command indicates an operation recorded in a slow log.COLLSCAN indicates that a full-collection scan is performed. IXSCAN indicates that an index scan is performed. For descriptions of other fields, see Explain Results.keysExamined refers to the number of index entries scanned. docsExamined refers to the number of documents scanned. Larger keysExamined and docsExamined values indicate that no index is created or the created index is less distinctive. Check the fields for which an index is created.3. Check whether the request is locked due to an index created in the foreground.
If there is no problem with the index used for business queries, check whether an index is created in the foreground during peak business hours. An index is created in the foreground by default for a collection (the
background option is false), which will block all other operations until the index is created in the foreground. If you choose to create an index in the background, MongoDB can still provide read/write services during the creation of the index. However, it takes more time to create the index in this way. For options to create an index, see db.collection.createIndex().
You can view the progress of index creation by running the currentOp command as shown below:db.currentOp({$or: [{ op: "command", "query.createIndexes": { $exists: true } },{ op: "insert", ns: /\\.system\\.indexes\\b/ }]})
The returned result is shown as follows. The
msg field indicates the progress of index creation. The locks field indicates the lock type of the operation. For more information on locks, see Database Profiler Output.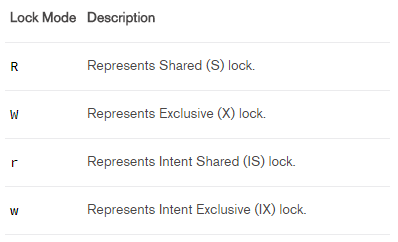
4. Check whether the mongos load is too high.
The "Latency" metric mainly reflects the time from a request arriving at the access layer to it returning to the client after being processed. If there are no slow logs on mongod, but the request latency is high, it may result from high mongos load. There are many reasons for this; for example, a large number of connections are established in a short time, or data in multiple shards needs to be aggregated. In these cases, you can restart mongos in the console.
Note:
All instance connections will be interrupted at the moment of restarting mongos, but the business can be directly reconnected. Therefore, restarting mongos will not continuously affect the business.

 Yes
Yes
 No
No
Was this page helpful?