The Tencent Cloud Observability Platform App plugin runs on Grafana versions greater than or equal to 7.3 and below 8.0. Please start by setting up a Grafana environment. For more information, please see Download Grafana.
Step 1. Install and Update
Installation directions
The Tencent Cloud Observability Platform App plugin can be installed in a variety of ways. Please choose one of the following ways to install it.
The only reliable installation method is installation by using Grafana CLI. Any other approach should be considered as a solution and does not provide any guarantee of backward compatibility.
Using GitHub releases
Download the latest version of the Tencent Cloud Observability Platform App plugin code in GitHub Releases (the resource name is tencentcloud-monitor-app-[x.x.x].zip) and place the decompressed code in the plugin directory of Grafana, which is ${GRAFANA_HOME}/plugins by default. You can configure the plugin directory in ${GRAFANA_HOME}/conf/grafana.ini (Linux/macOS) or ${GRAFANA_HOME}/conf/custom.ini (Windows/MacOS). For more information on the plugin directory, please see here. After installation, restart Grafana.
Using source code
If you want to build the software package yourself or provide help, please see here.
After the upgrade, you need to delete the old data source and configure a new one.
More options
If you need more help, please see Grafana CLI or run the following command:
grafana-cli plugins --help
Step 2. Enable the Plugin
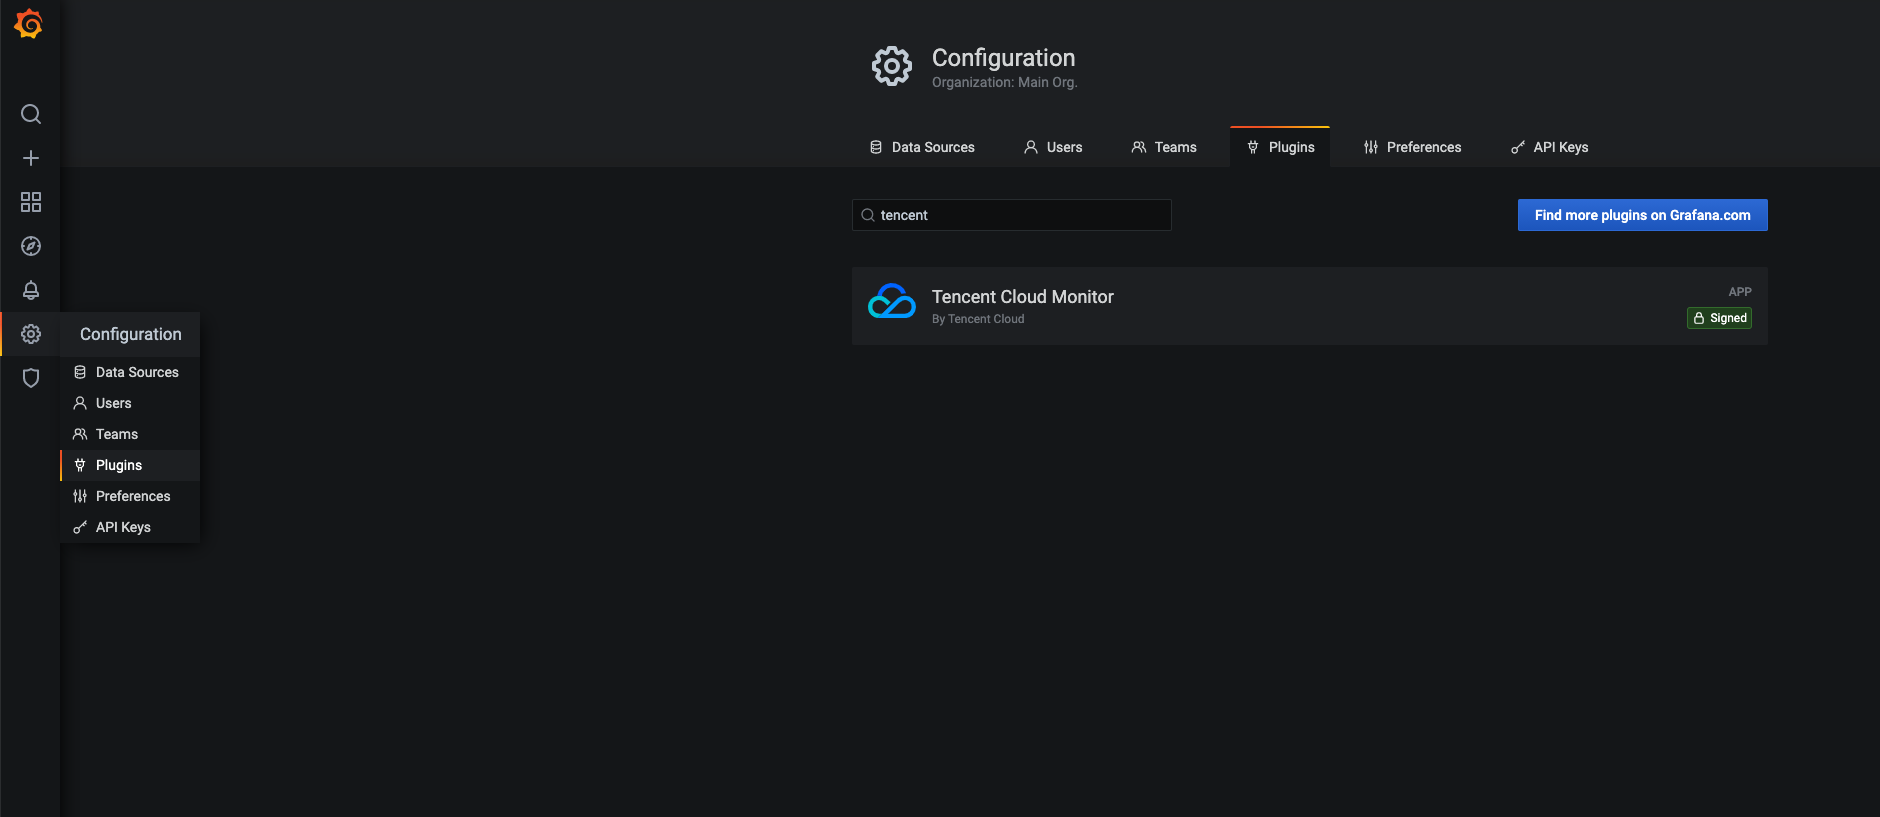
1. Hover over the gear icon on the left sidebar and click Plugins to go to the plugin management page. If the Tencent Cloud Observability Platform App plugin is displayed in the plugin list, it indicates that the plugin has been installed successfully.
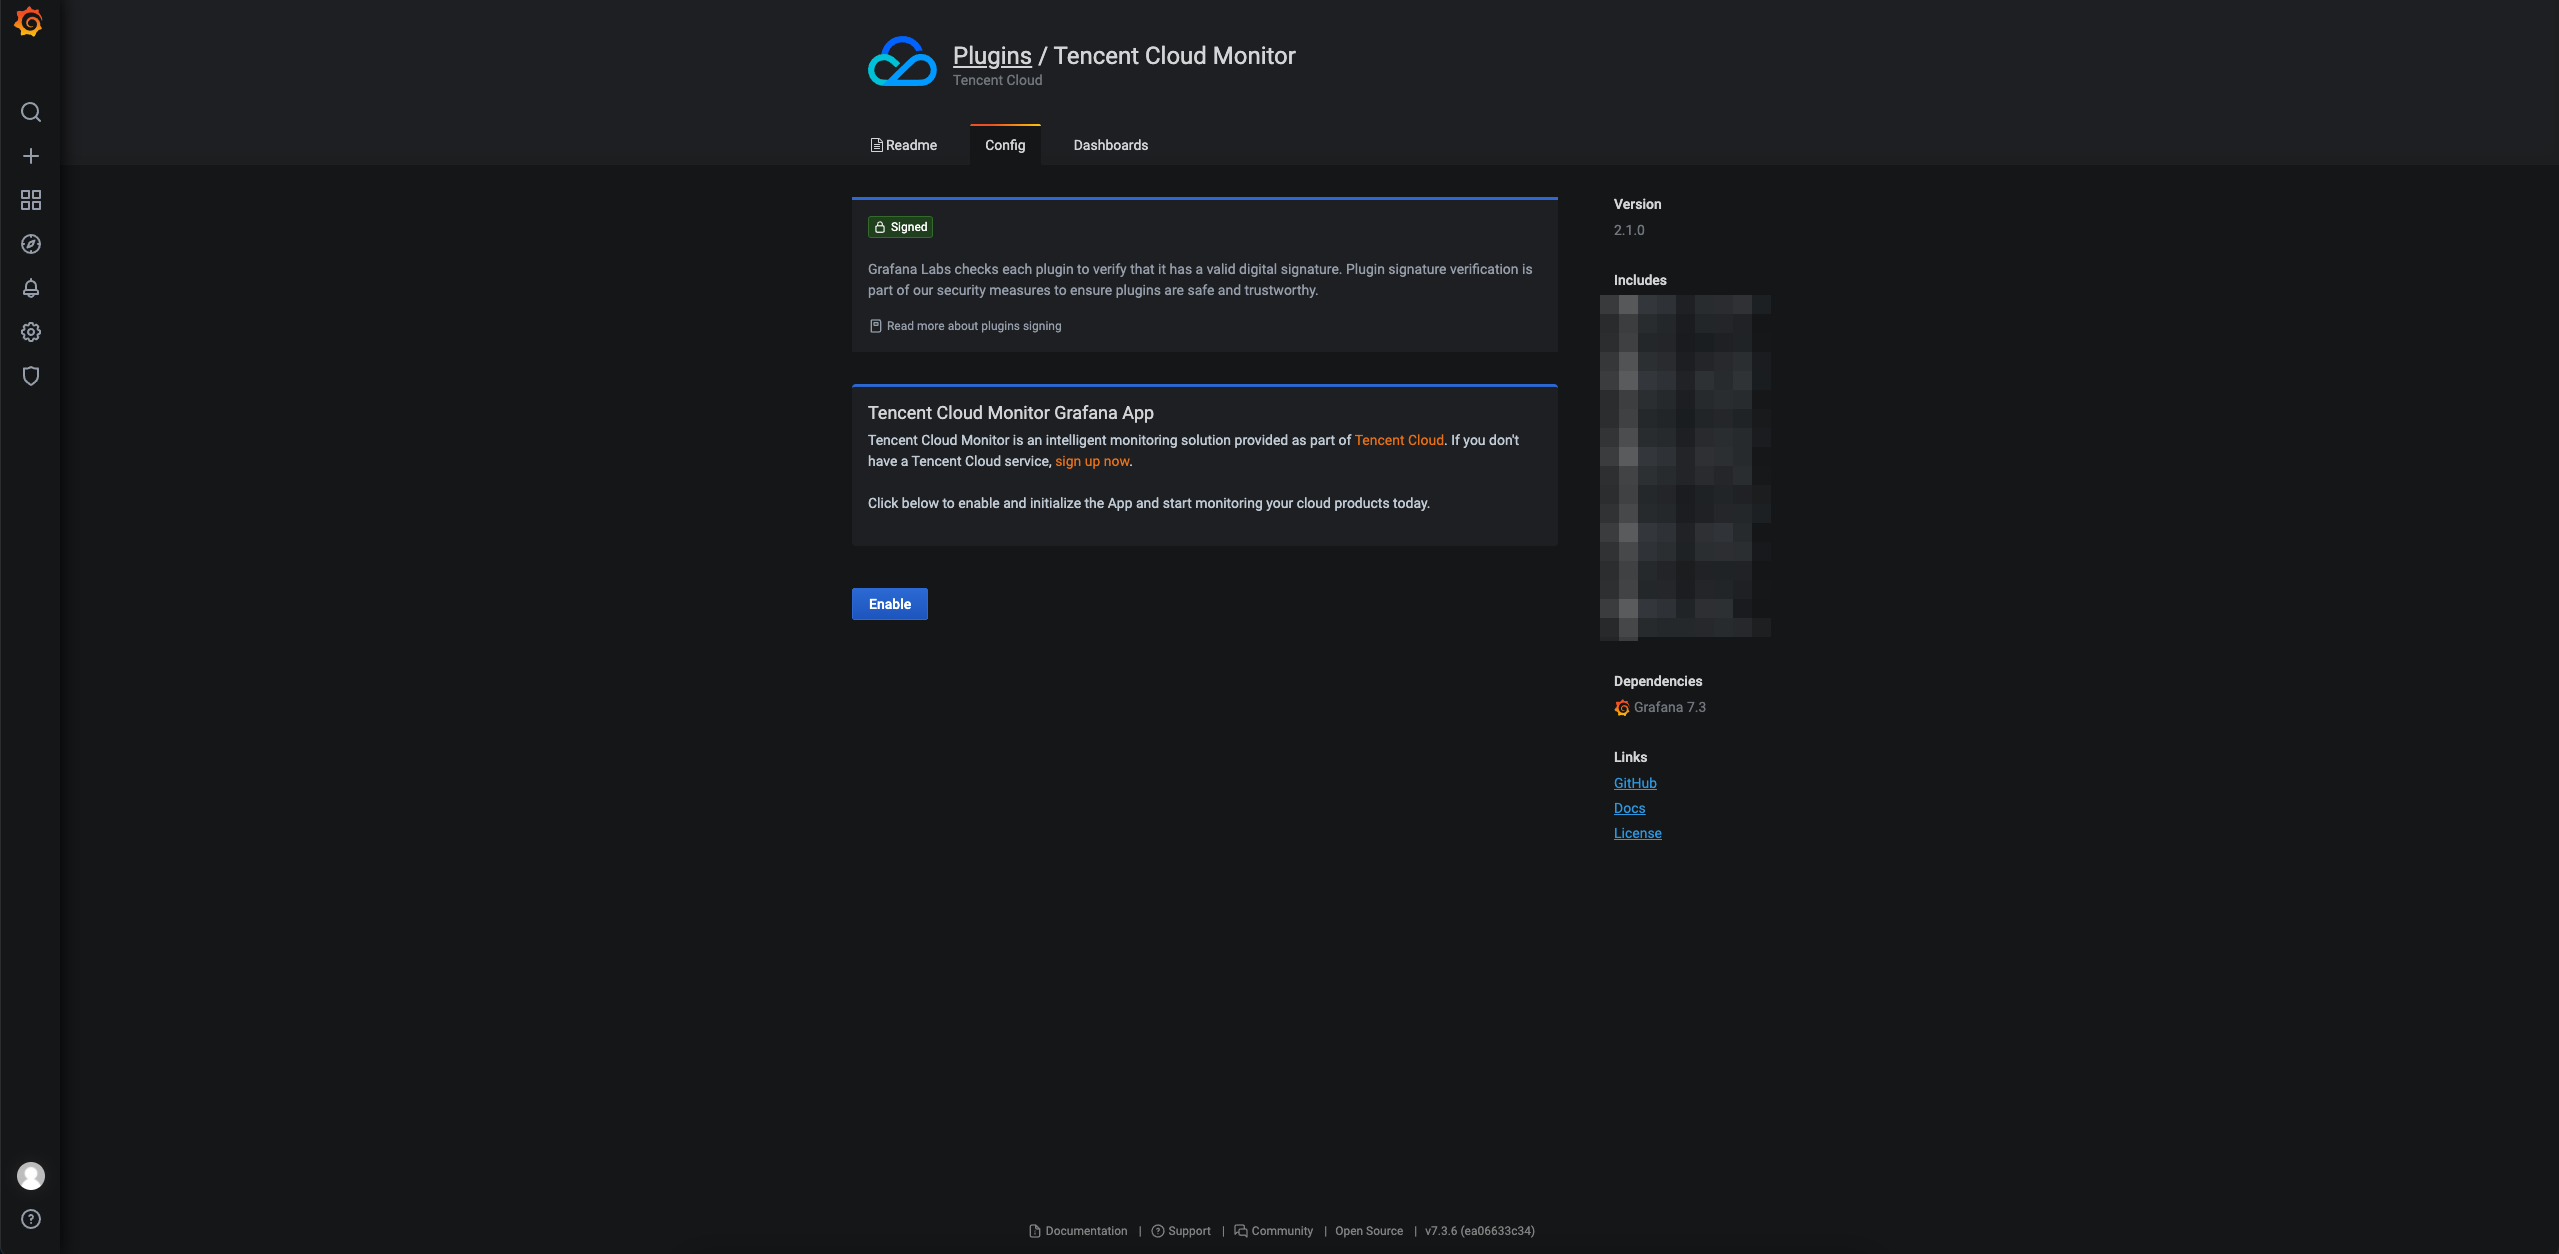
2. Enter the app details page and click Enable. After the Tencent Cloud Observability Platform App plugin is enabled successfully, you can use it in Grafana.
Step 3. Configure the Data Source
The Tencent Cloud Observability Platform App plugin gets the monitoring metric data of Tencent Cloud services by calling TCOP APIs. You can configure the data sources of the corresponding Tencent Cloud services in the following steps.
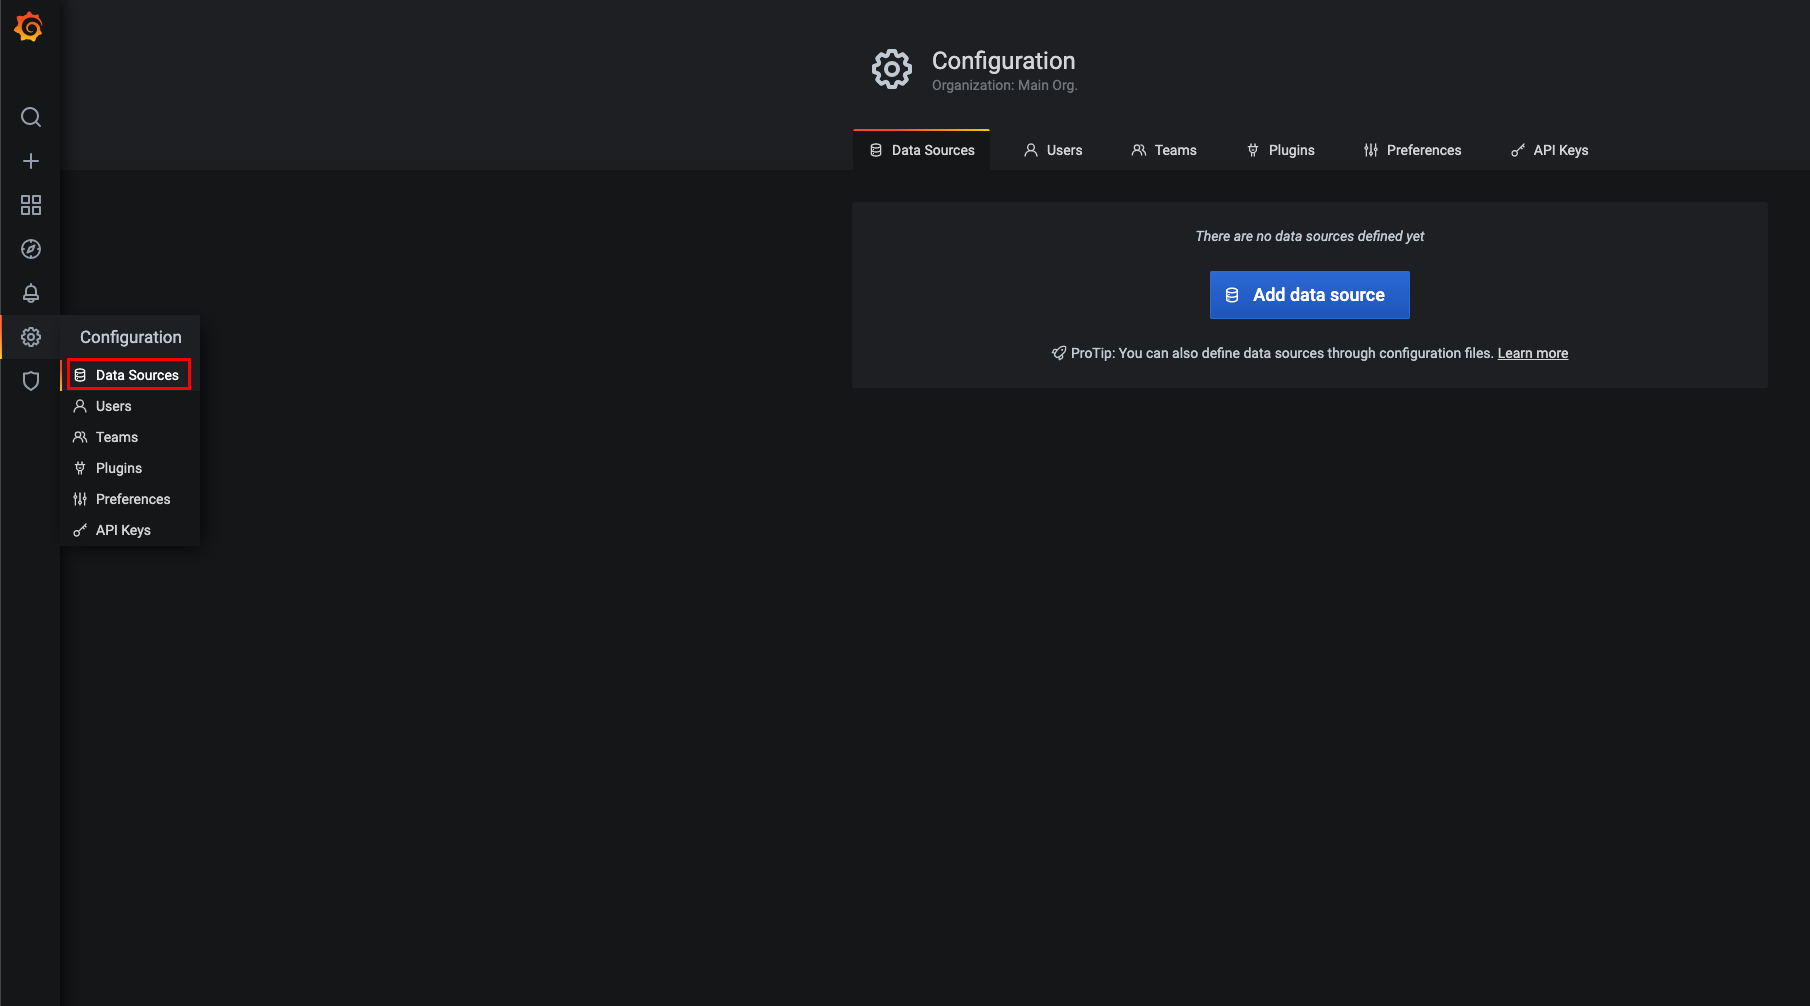
1. Hover over the gear icon on the left sidebar and click Data Sources to go to the data source management page.
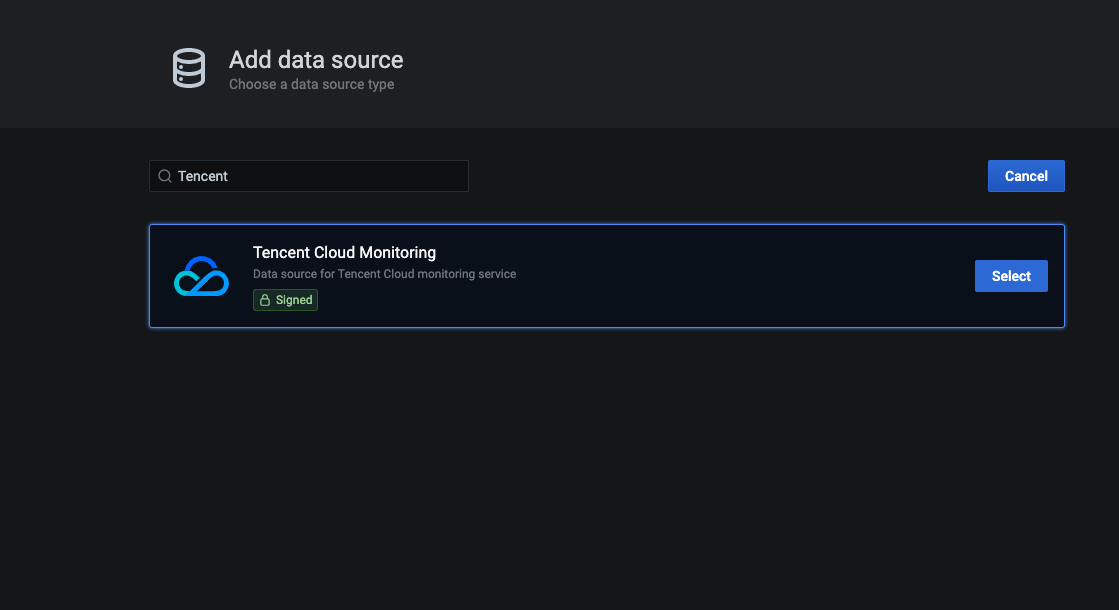
2. Click Add data source in the top-right corner and then click Tencent Cloud Observability Platform to go to the data source configuration page.
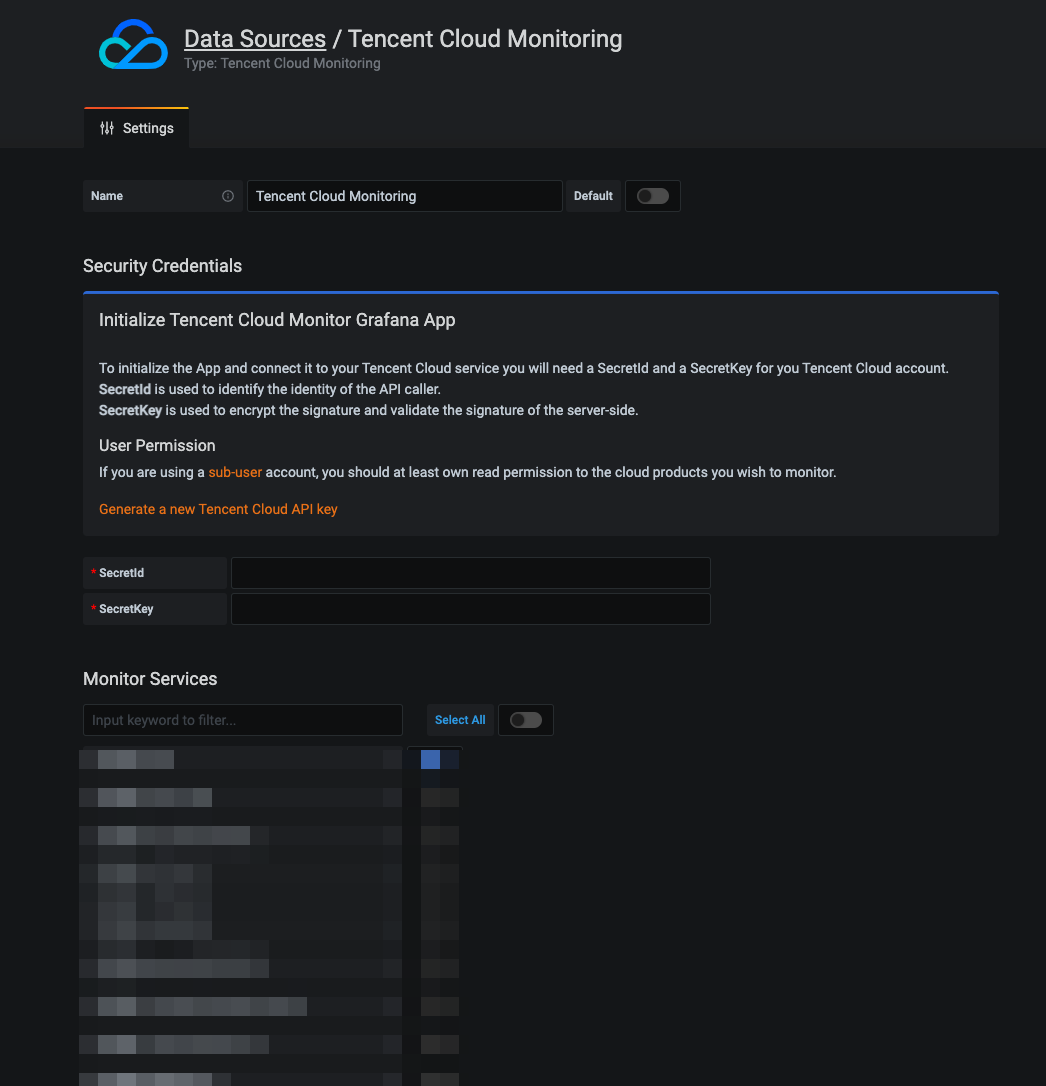
3. Set Name: select a data source name, which can be customized and is Tencent Cloud Observability Platform by default.
4. Set SecretId and SecretKey: security certificate information required for TCOP API calls, which can be obtained on the TencentCloud API Key page in the Tencent Cloud console.
5. Select Tencent Cloud services whose monitoring data you want to get.
6. Click Save & Test to test whether the data source is configured correctly, and if so, you can use it in the dashboard.
Step 4. Create a Dashboard
You can create a dashboard in any of the following ways:
Quick creation
Hover over the plus sign on the left sidebar and click +Dashboard to create a dashboard.
Management page
Hover over the grid icon on the left sidebar and click Manage to go to the dashboard management page. Click New Dashboard to create a dashboard. You can also perform various dashboard management operations on this page, such as creating folders, moving dashboards, or importing dashboards.
Template import
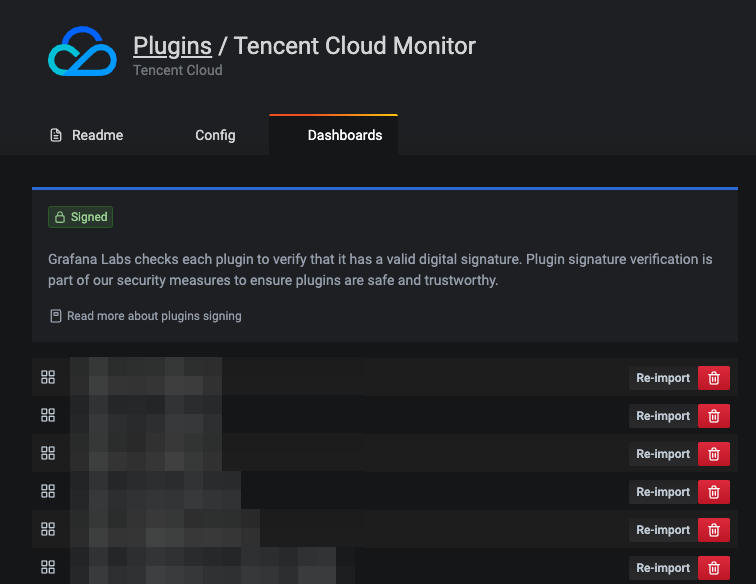
Hover over the gear icon on the left sidebar and click Plugins to go to the plugin management page. Click Tencent Cloud Observability Platform to go to the application details page, switch to the Dashboards tab, and select a dashboard template to import.
Step 5. Configure Panel Data
After creating a dashboard, you can configure the panel information to get the monitoring data from Tencent Cloud Observability Platform. The following describes how to do so by taking Graph as an example.
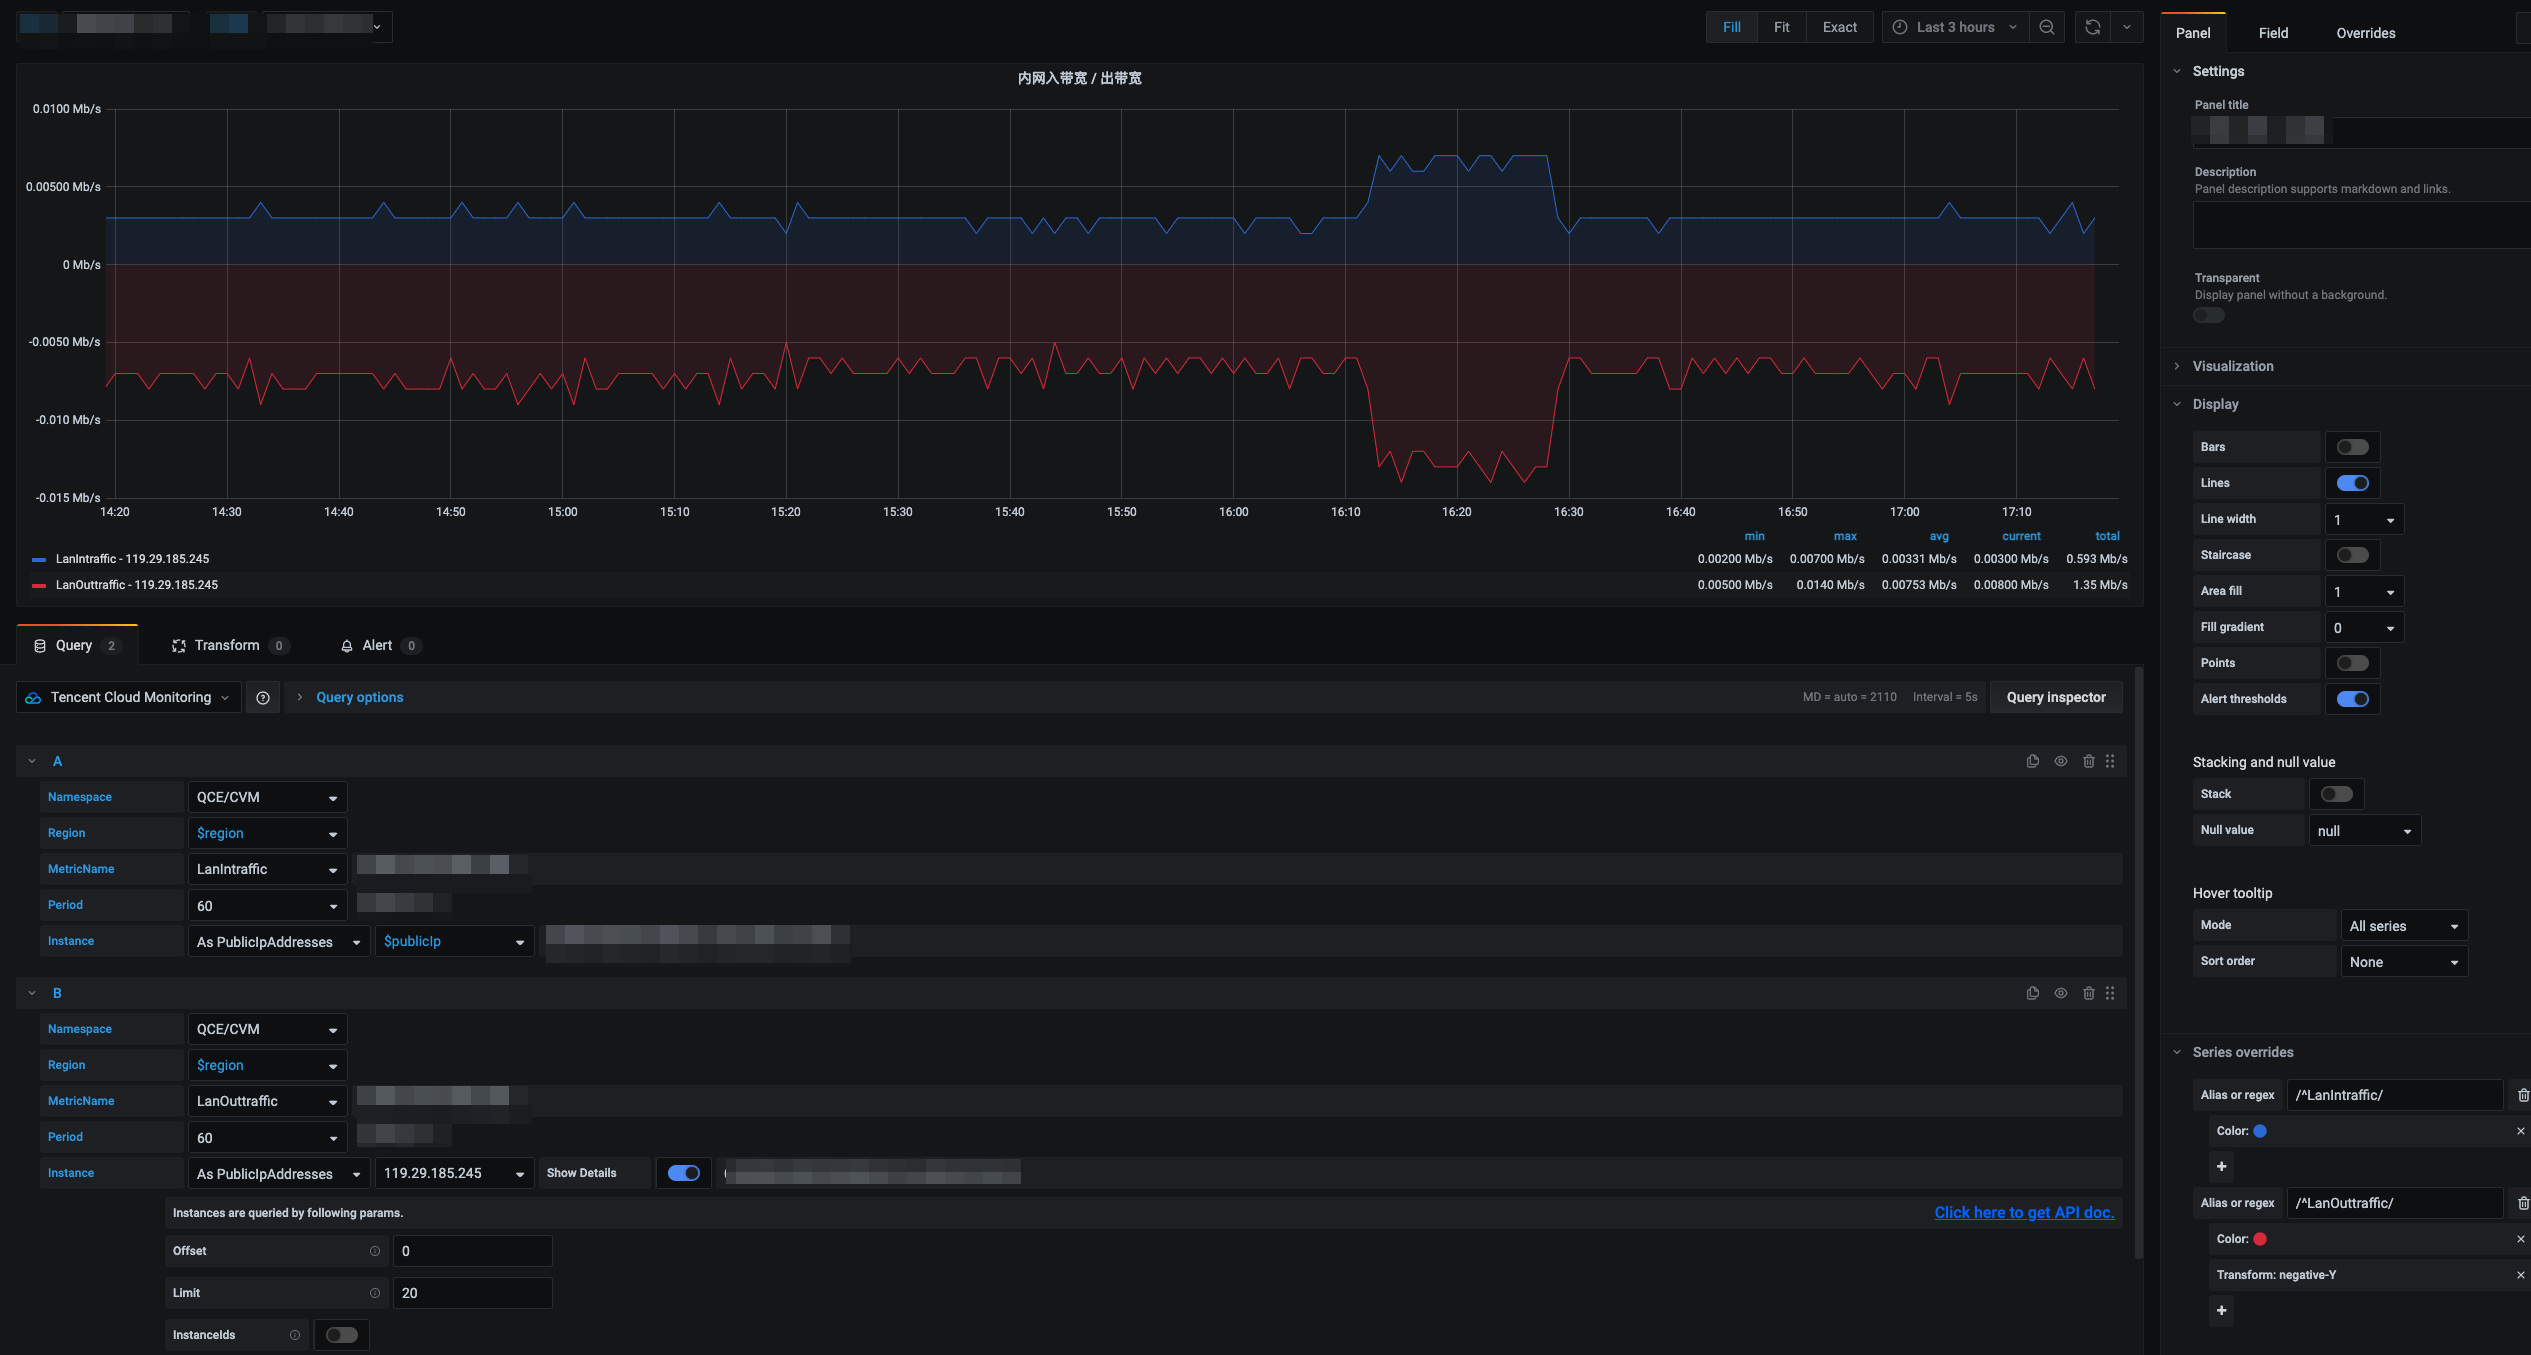
1. Click Add Query in New Panel to go to the panel configuration page. On the Query tab on the left, select the Tencent Cloud Observability Platform data source configured above.
2. Set Namespace: select a namespace. For example, the namespace of CVM monitoring is QCE/CVM. Click here to view the namespaces of other Tencent Cloud services.
3. Set Region: select a region. The region list will be automatically obtained according to the Namespace option.
4. Set MetricName: select a metric name. The metric list will be automatically obtained according to the Namespace and Region options. Click here to view the metric documents of different Tencent Cloud services.
5. Set Period: select a statistical granularity. The period list will be automatically obtained according to the MetricName option.
6. Set Instance: select an instance, which corresponds to the Instances.N field of the input parameter. The instance list will be automatically obtained. Click here to view the instance list API documents of different Tencent Cloud services.
To adapt to the habits of different users, the instance list is displayed as different fields, which is the ID of the corresponding service by default.
The Show Details button is visible only when you select a non-template variable. You can toggle Show Details to true to display the instance request parameters, which are Offset = 0 and Limit = 20 by default. If you need to change the instance query criteria, you can configure corresponding parameters as instructed in the API documentation.
Note: in this application, a single query to get the monitoring data is an atomic operation, i.e., querying the monitoring data of a certain metric of a certain instance. Therefore, you can select only one instance at a time. If you need to query the monitoring data of multiple instances, you can click + Query at the bottom to add new queries.

 Yes
Yes
 No
No
Was this page helpful?