Exception Monitoring
Baixar
Modo Foco
Tamanho da Fonte
This document describes how to view and analyze an application exception.
Prerequisites
Exception list
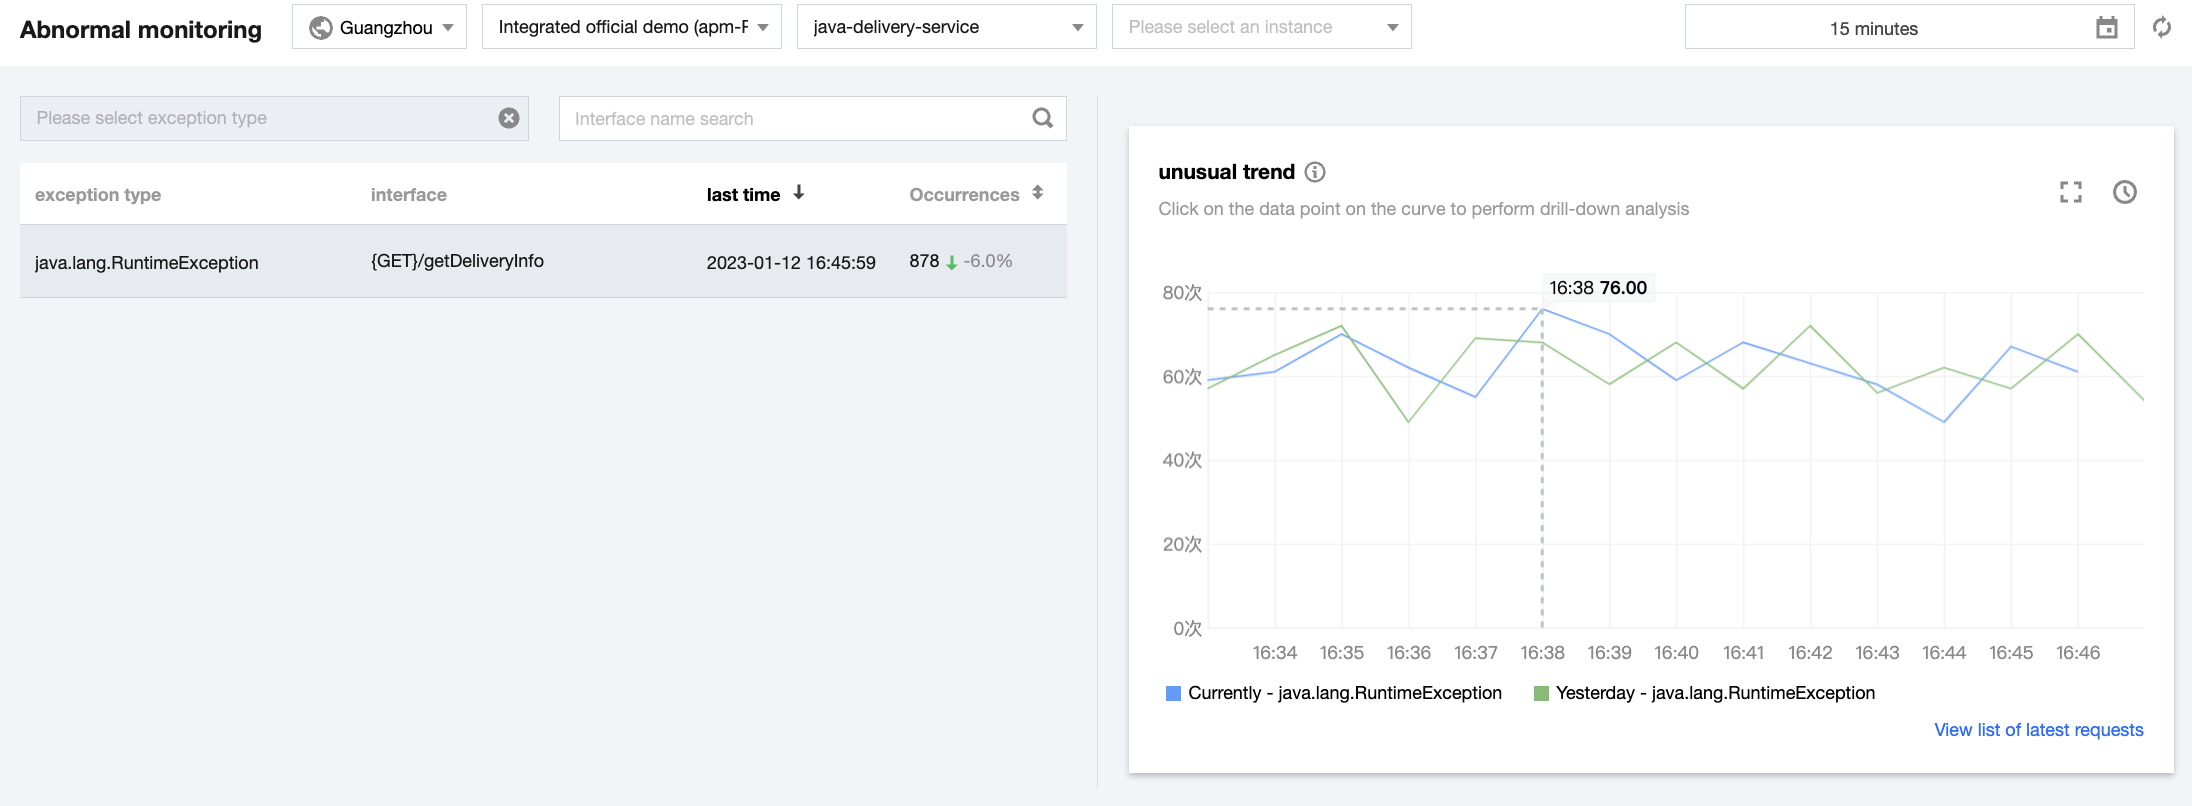
It displays all exceptions within the specified time range on the left of the Exception monitoring page, including the service exception type, API, and number of occurrences.
Exception trend
The chart on the right displays the exception trend, i.e., number of exception occurrences per minute.
Exception analysis
Click the target application. Then, the number of occurrences of the exception and day-over-day comparison will be displayed as curves on the right of the Exception monitoring page.
Note:
You can click Select comparison curve above the chart to add a month-over-month comparison curve. You can also click a data point in the curve to view the list of related requests. In the list, click Request details to drill down to call trace details for exception analysis.
Ajuda e Suporte
Esta página foi útil?
Você também pode entrar em contato com a Equipe de vendas ou Enviar um tíquete em caso de ajuda.
comentários