An alarm trigger condition is a semantic condition consisting of metrics, comparison relationships, thresholds, statistical granularity, and N consecutive monitoring data point(s). Users can set alarm trigger conditions based on the changing trend of metrics in charts. For example, if the metric is CPU utilization, the comparison relationship is greater than, the threshold is 80%, the statistical granularity is 5 minutes, and the consecutive monitoring data points are set to 2, then CPU utilization data is collected every 5 minutes. If a CVM’s CPU utilization exceeds 80% for two consecutive times, an alarm is triggered.
Tencent Cloud Observability Platform (TCOP) supports custom configuration of metric alarms and event alarms and offers the alarm trigger condition template feature, enabling users to reuse preset alarm trigger conditions quickly.
Description of Alarm Trigger Logic
Alarm Lifecycle Analysis
When a metric reaches the threshold for N consecutive data points, it initiates an alarm lifecycle. Until the alarm recovers, alarm notifications are sent at the configured frequency. (If the alarm remains unrecovered for 24 hours, the system will send alarms at the specified frequency, such as every 1 or 2 hours; if it is unrecovered beyond 24 hours, the system will send one alarm in a day.) When the alarm recovers, a recovery notification is sent, indicating the end of the alarm lifecycle. If the alarm is triggered again, a new alarm lifecycle will be started.
Alarm Lifecycle Diagram
Static Threshold
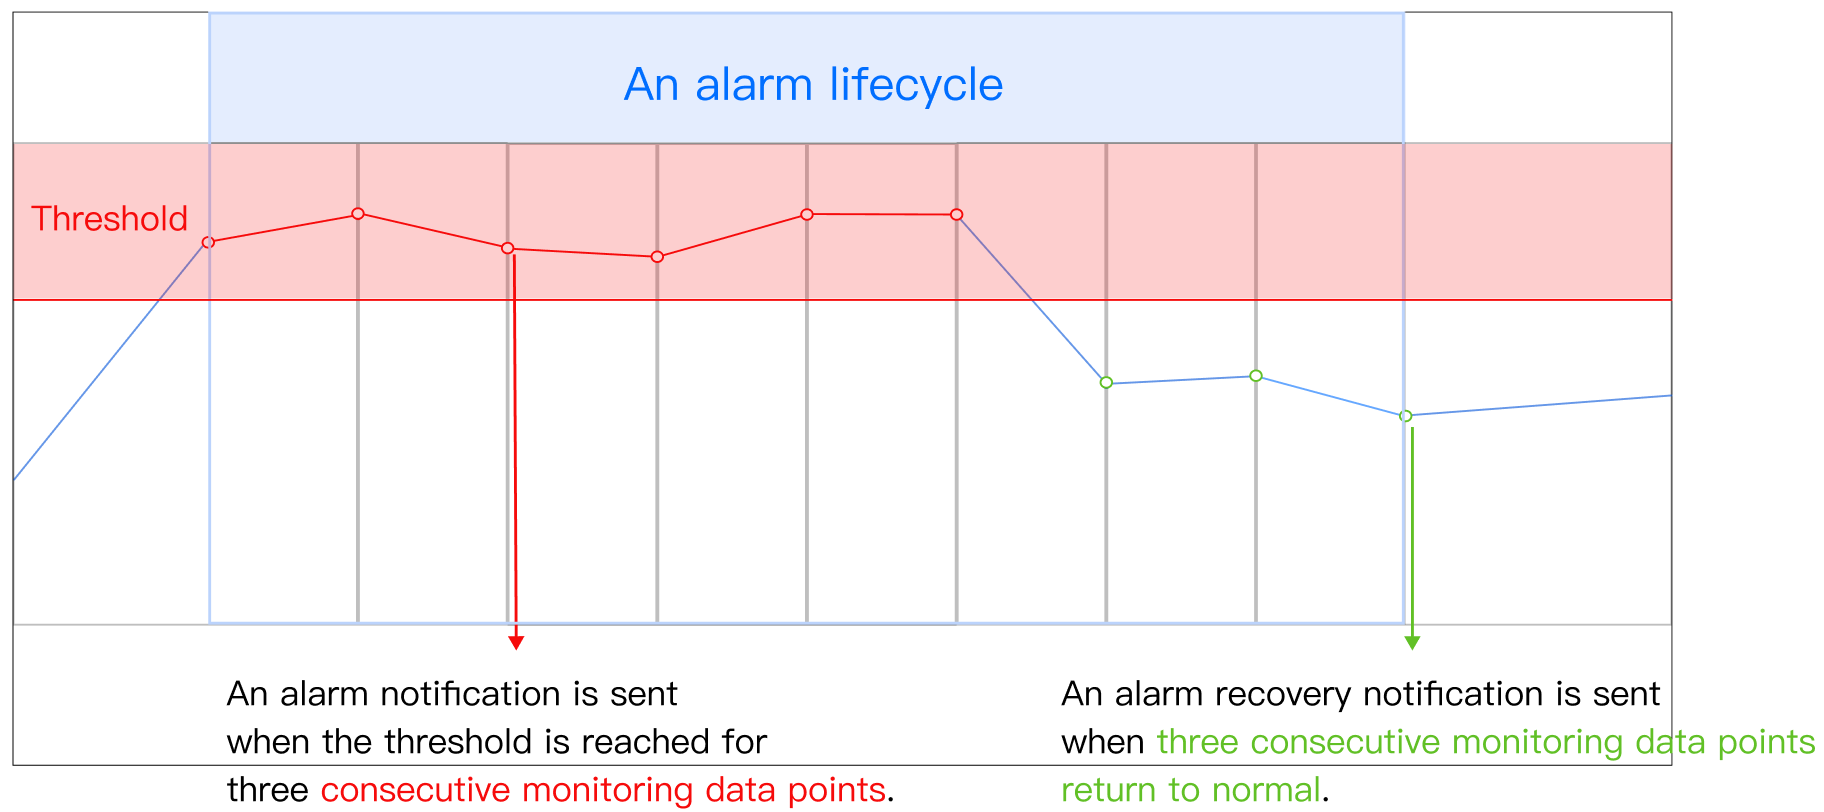
For example, if the alarm is triggered when the threshold is exceeded for three consecutive monitoring data points:
The following diagram illustrates an alarm lifecycle. When the threshold is reached for three consecutive data points (represented by three red points in the diagram), an alarm is triggered. The red line segment indicates the alarm duration, during which notifications are sent at the configured frequency. Once three consecutive data points (represented by three green points in the diagram) return to normal, the alarm is recovered, and notifications are not sent, marking the end of this alarm lifecycle. A new alarm will only be triggered if the threshold is reached for three consecutive monitoring data points.
Static Threshold (Over the Previous Statistical Period)
Static threshold (Over the Previous Statistical Period) includes three types of comparison relationships: Threshold increase, Threshold decrease, and Threshold fluctuation, calculated as follows:
Threshold Increase: Compared to the previous monitoring data point, the growth rate for n consecutive data points exceeds the threshold, where Growth rate = (Current data value - Previous data value) / Previous data value.
Threshold Decrease: Compared to the previous monitoring data point, the decrease rate for n consecutive data points exceeds the threshold, where Decrease rate = (Previous data value - Current data value) / Previous data value.
Threshold Fluctuation: Compared to the previous monitoring data point, the absolute fluctuation rate for n consecutive data points exceeds the threshold, where the Absolute fluctuation rate = | (Current data value - Previous data value) / Previous data value |
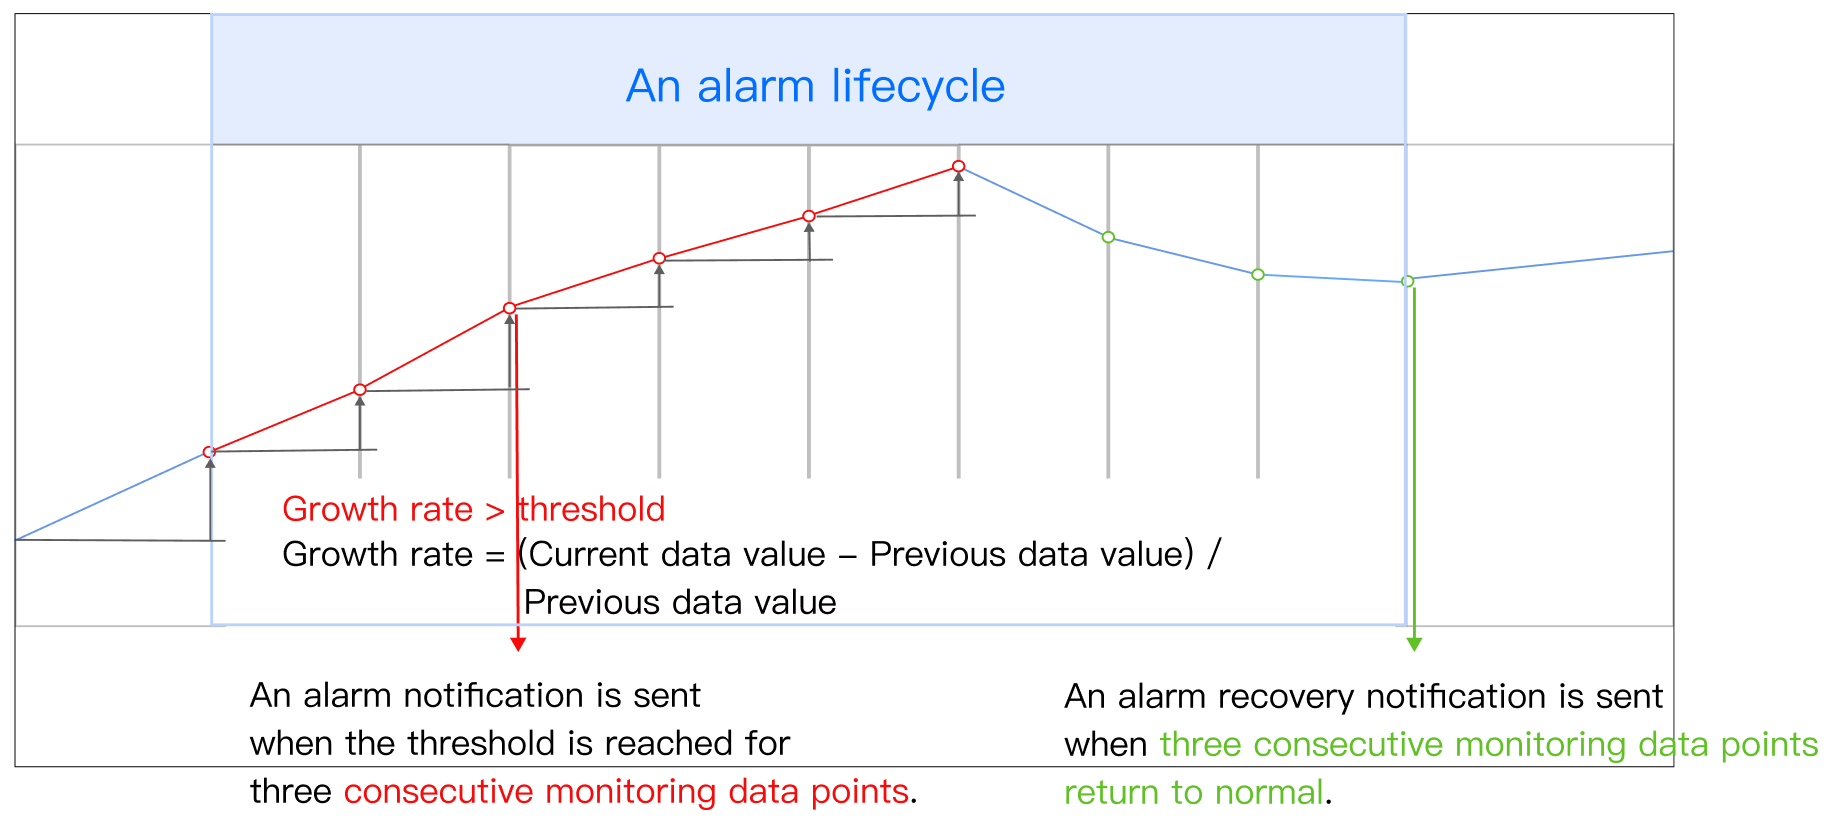
For example, if an alarm is triggered when the threshold increase reaches the threshold for three consecutive monitoring data points:
A threshold increase means that the performance in the current statistical period is better than that of the previous statistical period. An alarm is triggered when the growth rate exceeds the threshold for three consecutive monitoring data points compared to the previous point (as shown in the diagram, where the first red point shows an increase of N% compared to the previous blue point, and so forth).
The red line segment indicates a period where the condition of threshold increase is continuously met, representing the alarm period. When three consecutive monitoring data points do not satisfy the threshold increase condition (such as when the first and third green points show a decreasing trend compared to the previous data point) or when the threshold growth rate does not reach the threshold, the alarm is recovered, and alarm notifications are not sent.
Static Threshold (Over the Last Day or Week)
Static threshold (Over the Last Day or Week) includes six types of comparison relationships: Threshold fluctuation compared to yesterday, Threshold increase compared to yesterday, Threshold decrease compared to yesterday, Threshold fluctuation compared to the last week, Threshold increase compared to last week, and Threshold decrease compared to last week. The calculation methods are as follows:
Threshold increase compared to yesterday: Compared to the data point at the same time yesterday, the growth rate for n consecutive data points exceeds the threshold, where the Growth rate = (Current data value - Data value at the same time yesterday) / Data value at the same time yesterday.
Threshold decrease compared to yesterday: Compared to the data point at the same time yesterday, the decrease rate for n consecutive data points exceeds the threshold, where the Decrease rate = (Data value at the same time yesterday - Current data value) / Data value at the same time yesterday.
Threshold fluctuation compared to yesterday: Compared to the data point at the same time yesterday, the absolute fluctuation rate for n consecutive data points exceeds the threshold, where the Absolute fluctuation rate = | (Current data value - Data value at the same time yesterday) / Data value at the same time yesterday |.
Threshold increase compared to last week: Compared to the data point at the same time last week, the growth rate for n consecutive data points exceeds the threshold, where the Growth rate = (Current data value - Data value at the same time last week) / Data value at the same time last week.
Threshold decrease compared to last week: Compared to the data point at the same time last week, the decrease rate for n consecutive data points exceeds the threshold, where the Decrease rate = (Data value at the same time last week - Current data value) / Data value at the same time last week.
Threshold fluctuation compared to last week: Compared to the data point at the same time last week, the absolute fluctuation rate for sustained n data points exceeds the threshold, where the Absolute fluctuation rate = | (Current data value - Data value at the same time last week) / Data value at the same time last week | .
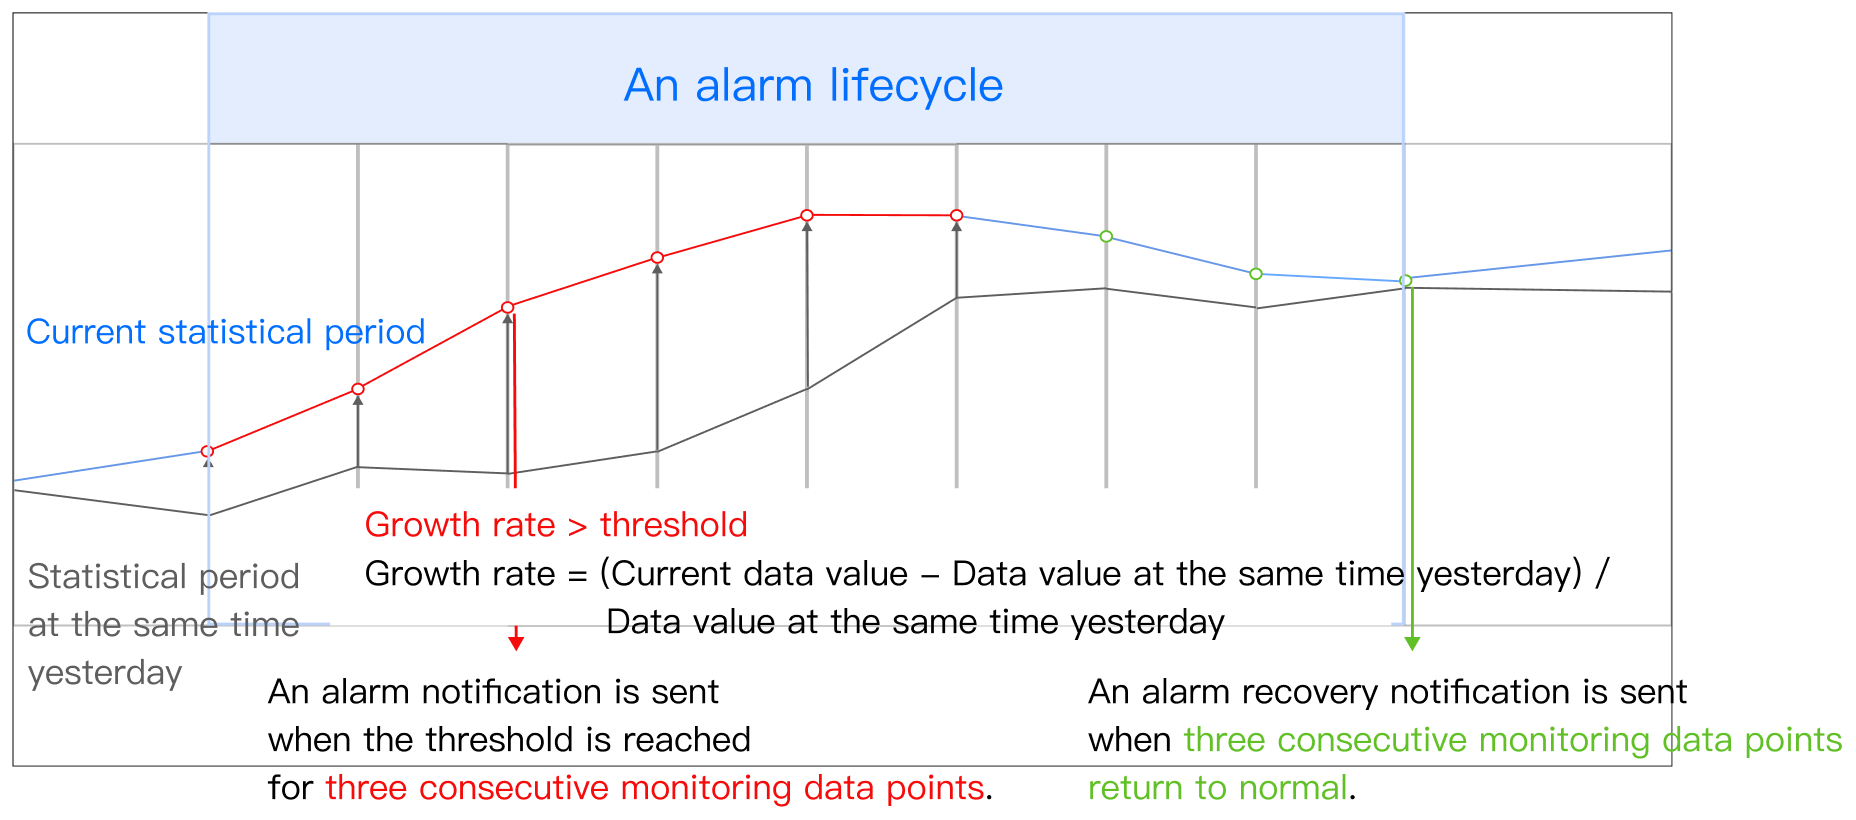
For example, if an alarm is triggered when the threshold increase exceeds the threshold for three consecutive monitoring data points compared to the same time yesterday:
Here, the threshold increase means that the performance in this statistical period is better than that at the same time yesterday. An alarm is triggered when the growth rate exceeds the threshold for three consecutive monitoring data points compared to the data points from the same time yesterday (as shown in the diagram, where the first red point shows an increase of N% compared to the data point at the same time yesterday, and so forth).
The red line segment indicates a period where the condition of threshold increase compared to yesterday is continuously met, representing the alarm period. When three consecutive monitoring data points do not satisfy the threshold increase condition compared to the same time yesterday (such as when the first and third green points show a decreasing trend compared to the data point at the same time yesterday) or when the threshold growth rate does not reach the threshold, the alarm is recovered, and alarm notifications are not sent.
Dynamic Threshold
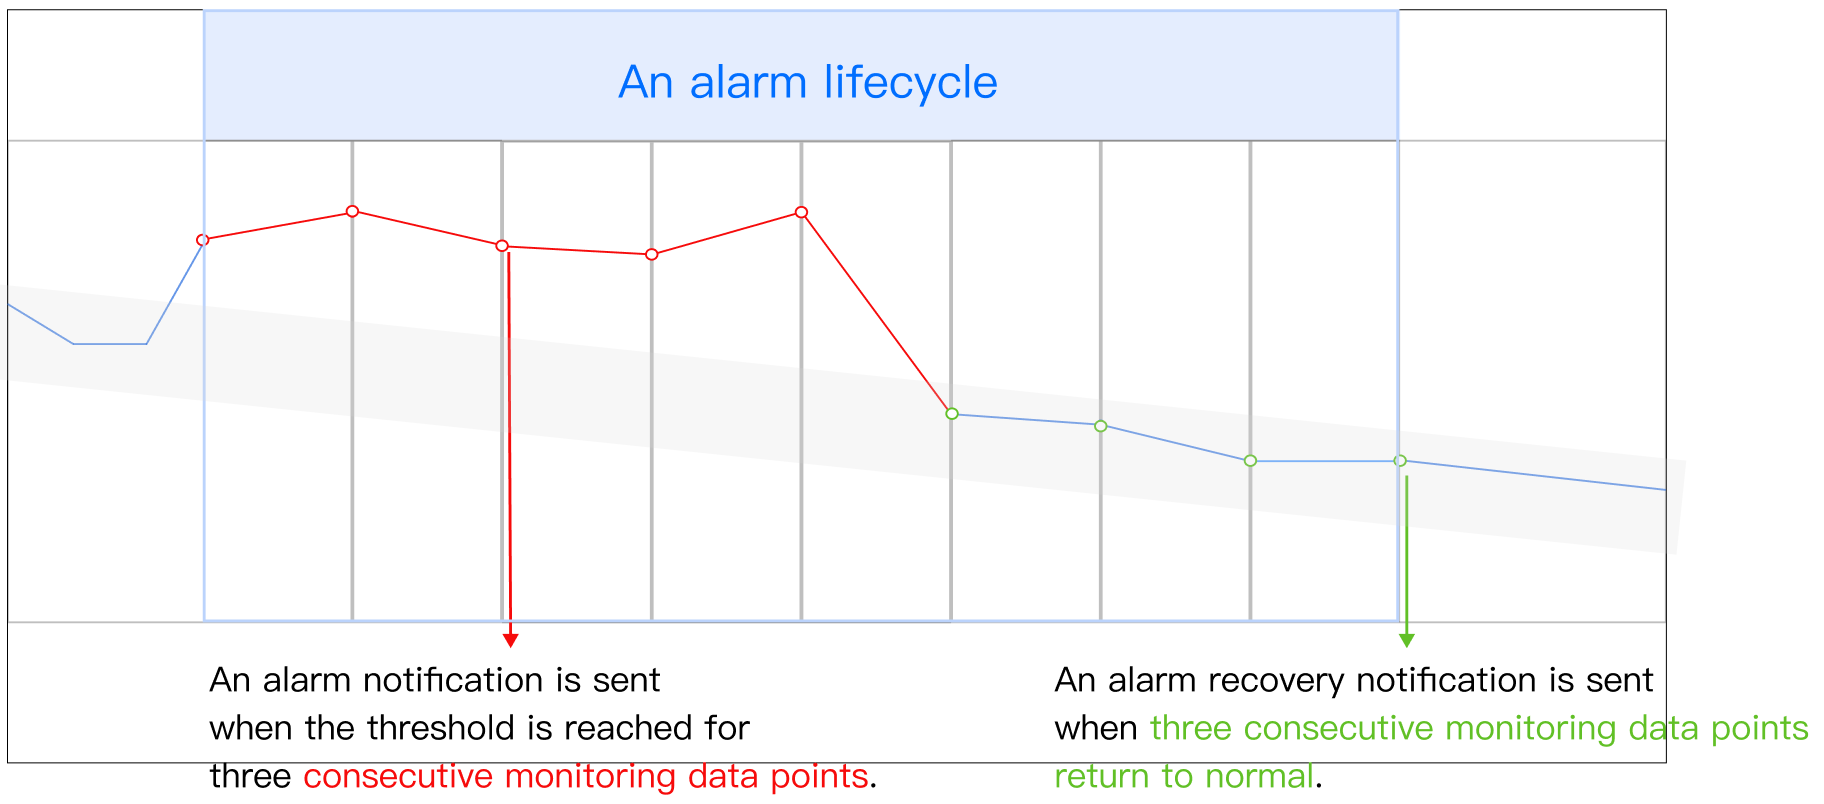
For example, if an alarm is triggered when the threshold is reached for three consecutive monitoring data points:
As shown in the diagram below, an alarm is triggered when three consecutive monitoring data points deviate from the historical trend. The red line segment indicates the period when the deviation continues, marking the alarm period. When three consecutive data points return to the normal historical trend, the alarm is recovered, and alarm notifications are not sent.