- Release Notes and Announcements
- Announcements
- Billing Content Adjustment for Cloud Streaming Services Standard Transcoding and Top Speed Codec Transcoding
- Announcement on the Price Adjustment of CSS Audio/Video Enhancement Feature
- Announcement on the Official Billing for CSS Standby Streams Feature
- CSS to Support H.265 8K and AV1 8K Transcoding
- CSS Adds Support for AV1 Codec and Audio/Video Enhancement
- Notice: CSS to Adjust Prices of Basic Services
- CSS to Adjust Pricing of Third-Party Relay
- Delayed Playback to Become Paid Feature
- Announcements
- User Guide
- Product Introduction
- Purchase Guide
- Pricing Overview
- Basic Services
- Value-Added Services
- Live Transcoding (Watermarking, Stream Mixing, subtitles)
- Live Audio and Video Enhancement
- Live Recording
- Time Shifting (New)
- Live Screencapture
- Live Stream Moderation
- Intelligent Porn Detection
- Live Video Caster
- Relay
- Overview of Basic Fees for Value-Added Features
- Delayed Playback
- Standby Streams
- Real-Time Log Shipping
- Prepaid plan
- Purchase Process
- Changing Billing Modes
- Refund Policy
- Viewing Bills
- Renewal
- Processing for Overdue Payments
- Billing FAQs
- Live Video Broadcasting (LVB)
- Live Event Broadcasting (LEB)
- Live Video Caster
- Console Guide
- Console Overview
- Overview
- Domain Management
- Adding Domain Names
- Push Domain Name Management
- Push Configuration
- Recording Configuration
- Time Shifting Configuration
- Screencapture and Porn Detection Configuration
- Watermark Configuration
- Callback Configuration
- Standby Stream Configuration
- Latency Control
- IP Blocklist/Allowlist Configuration
- Delayed Playback
- Moderation Configuration
- Remote Authentication Configuration
- Playback Domain Name Management
- Playback Configuration
- Playback Authentication Configuration
- Referer Configuration
- Template Configuration
- HTTPS Configuration
- Region Configuration
- Origin Server Configuration
- Bandwidth Cap Configuration
- IP Blocklist/Allowlist Configuration
- Blocking Playback by Protocol
- Latency Control
- HTTP Response Header Configuration
- Access control by region Configuration
- Remote Authentication Configuration
- Certificate Management
- Stream Management
- Package Management
- Feature Configuration
- Relay
- Billing Usage Statistics
- Monitoring
- Toolkit
- CAM-Based Access Control
- Feature Guide
- Push and Playback
- Features
- Live Streaming Security
- Global CSS Service
- Callback Notifications
- How to Receive Event Notification
- Stream Pushing Notification
- Recording Event Notification
- Recording Status Event Notification
- Screencapturing Event Notification
- Live Broadcasting Image Audit Event Notification
- Live Streaming Audio Auditing Service Event Notification
- Push Error Event Notifications
- Relay Event Notification
- User Guides for Common Third-Party Tools
- SDK Guide
- API Documentation
- History
- Introduction
- API Category
- Making API Requests
- Live Transcoding APIs
- Delayed Playback Management APIs
- Domain Name Management APIs
- Watermark Management APIs
- Certificate Management APIs
- Live Stream Mix APIs
- Stream Pulling APIs
- Recording Management APIs
- Time Shifting APIs
- Live Callback APIs
- Screencapturing and Porn Detection APIs
- Authentication Management APIs
- Monitoring Data Query APIs
- DescribeAllStreamPlayInfoList
- DescribeGroupProIspPlayInfoList
- DescribeHttpStatusInfoList
- DescribeLiveDomainPlayInfoList
- DescribeLiveStreamPushInfoList
- DescribeLiveTranscodeDetailInfo
- DescribePlayErrorCodeDetailInfoList
- DescribePlayErrorCodeSumInfoList
- DescribeProIspPlaySumInfoList
- DescribeProvinceIspPlayInfoList
- DescribeStreamDayPlayInfoList
- DescribeStreamPlayInfoList
- DescribeStreamPushInfoList
- DescribeTopClientIpSumInfoList
- DescribeVisitTopSumInfoList
- Billing Data Query APIs
- Live Stream Management APIs
- Data Types
- Error Codes
- Ops Guide
- Troubleshooting
- About Pushing
- Playing Method
- Live Streaming Quiz
- FAQs
- SLA
- CSS Policy
- Glossary
In the CSS console, you can manage domains and streams, configure transcoding, recording, and acceleration, as well as push streams (web) and monitor resources.
Prerequisites
- You have activated CSS.
- You have logged in to the CSS console.
Overview
Click Overview on the left sidebar to view data including the current downstream bandwidth, today’s downstream bandwidth, the current number of push channels, the number of concurrent connections, as well as bandwidth usage, traffic usage, and push channels trends in the last 30 days. You can change the granularity of the data. On the same page, you can also change the billing mode or click Beginner's Guide in the top-right corner to read instructions to get started with CSS.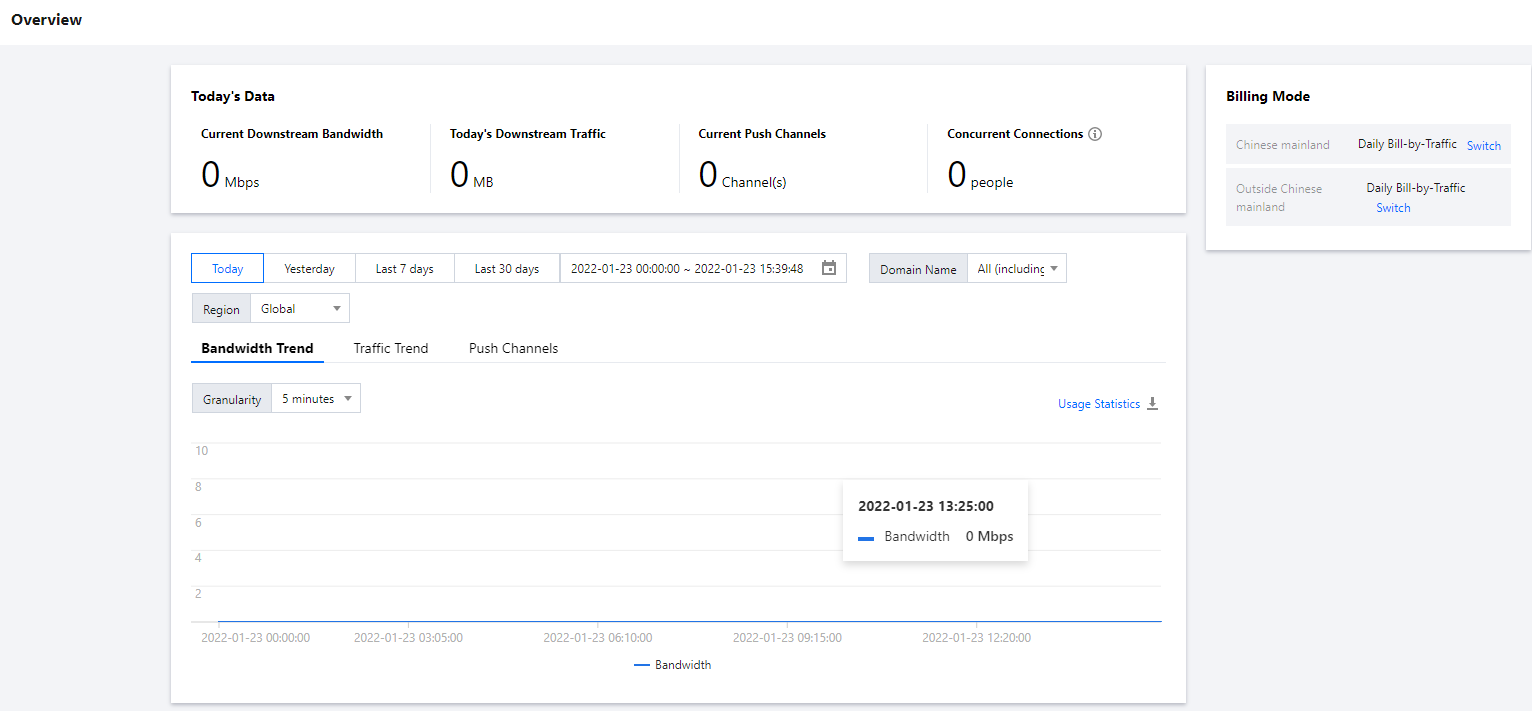
Today's Data
This section displays the downstream peak bandwidth, downstream traffic usage, the current number of push channels, and the number of concurrent connections of the day.
| Item | Description |
|---|---|
| Current Downstream Bandwidth | The peak bandwidth consumed for acceleration by all playback domains. |
| Today's Downstream Traffic | The total traffic consumed for acceleration by all playback domains on the current day. |
| Current Push Channels | The number of current push channels. |
| Concurrent connections |
Usage trends
This section displays usage trends (Bandwidth Trend, Traffic Trend, and Push Channels) for today, yesterday, the last 7 days, and the last 30 days.
| Item | Description |
|---|---|
| Bandwidth Trend | The sum of the peak bandwidth consumed for acceleration by all playback domains in the query period. |
| Traffic Trend | The total traffic consumed for acceleration by all playback domains in the query period. |
| Push Channels | The number of push channels under the selected domains in the query period. |
Changing the granularity
You can click the drop-down list box next to Granularity to change the granularity of the usage trend data.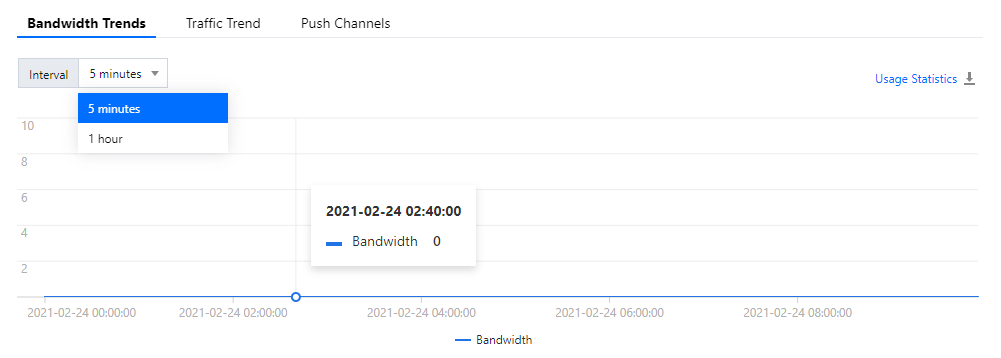
Billing details
- Billing mode
This section shows your billing modes inside and outside the Chinese mainland. If you use the same billing mode for LEB and LEB, you can click Price calculator to estimate your cost. - Switching the billing mode
Click Switch, check the information in the pop-up window, and click Confirm to change the billing mode. For more information, see Changing Billing Modes. If you want to use different billing modes for LEB and LVB, please submit a ticket. - Viewing package usage
Click Details in the Packages area to go to the Resource Package/Plugin Management page and view the usage, creation time, expiration time, and status of your traffic and transcoding packages. - Buying packages
On the CSS package purchase page, click Buy in the Packages area to buy a package.Note:For more information, see Pricing Overview.
Get Started with LEB
Click Start Now in the Get Started with LEB area to read the instructions to quickly get started with LEB.

 Yes
Yes
 No
No
Was this page helpful?