- Updates and Announcements
- Product Introduction
- New/Legacy Anti-DDoS Advanced Version Differences
- Comparison of Anti-DDoS Protection Schemes
- Purchase Guide
- Getting Started
- Operation Guide
- Best Practice
- API Documentation
- FAQs
- Troubleshooting
- Anti-DDoS Advanced (Global Enterprise Edition)
- Legacy Anti-DDoS Advanced (Legacy)
- Service Level Agreement
- Contact Us
- Glossary
Protection Overview
After connecting your application to and routing its traffic to the Anti-DDoS Advanced (Global Enterprise Edition) service, you can check the application traffic status and Anti-DDoS protection status in the console. Attack packet data can be downloaded for source tracing and analysis.
Viewing attack statistics
Log in to the Anti-DDoS Advanced (Global Enterprise Edition) console and select Overview > Protection Overview.
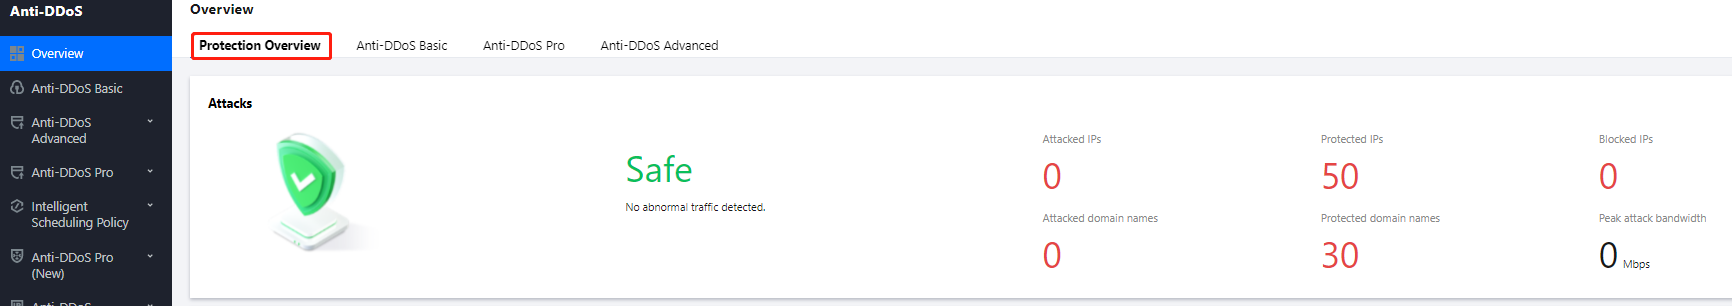
In the "Attacks" module, you can view the application security status, the latest attack and the attack type. To obtain higher protection, you can click Upgrade Protection.
This module also displays the details of the following data.
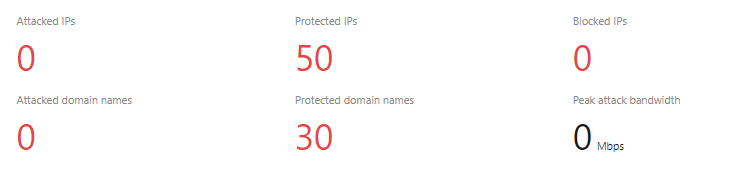
Field description:- Attacked IPs: The total number of attacked application IPs of basic protection, Anti-DDoS Pro and Anti-DDoS Advanced.
- Protected IPs: The total number of protected application IPs of Anti-DDoS Pro and Anti-DDoS Advanced.
- Blocked IPs: The total number of blocked IPs of basic protection, Anti-DDoS Pro and Anti-DDoS Advanced.
- Attacked domain names: The total number of domain names of attacked Anti-DDoS Advanced instances and ports.
- Protected domain names: The number of domain names connected to Anti-DDoS Advanced instances.
- Peak attack bandwidth: The maximum attack bandwidth of the current attack events.
Viewing defense statistics
- Log in to the Anti-DDoS Advanced (Global Enterprise Edition) console and select Overview > Protection Overview.
- In the "Defense" module, you can easily see the application IP security status.
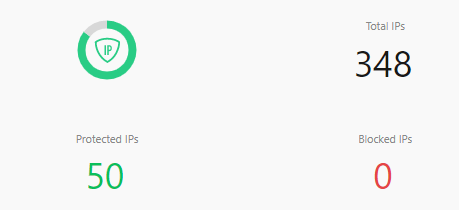
Field description:- Total IPs: The total number of application IPs, including IPs of basic protection, Anti-DDoS Pro and Anti-DDoS Advanced.
- Protected IPs: The total number of protected application IPs of Anti-DDoS Pro and Anti-DDoS Advanced.
- Blocked IPs: The total number of blocked IPs of basic protection, Anti-DDoS Pro and Anti-DDoS Advanced.
- This module also displays the total number of attacks on your applications, giving you a picture of the distribution of attacks.
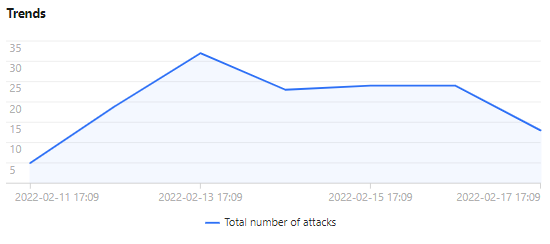
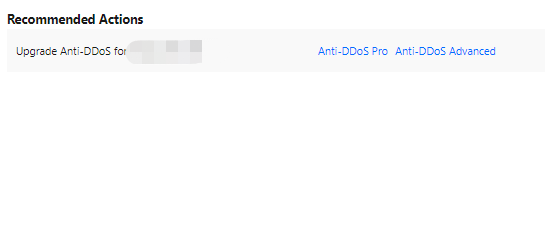
- Meanwhile, this module provides recommended actions for the attacked IPs connected to basic protection, allowing you to quickly upgrade your Anti-DDoS service.
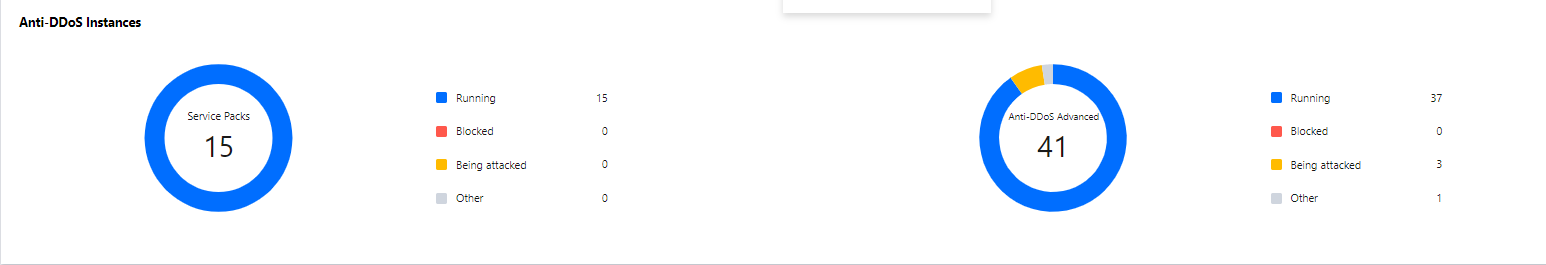
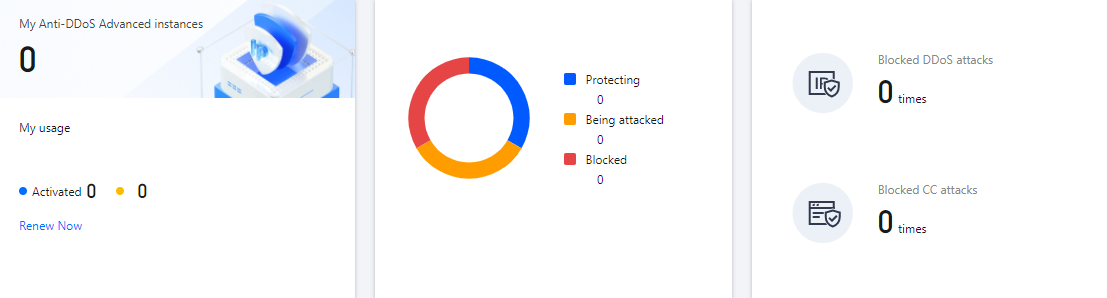
Viewing Anti-DDoS Advanced instance statistics
- Log in to the Anti-DDoS Advanced (Global Enterprise Edition) console and select Overview > Protection Overview.
- The "Anti-DDoS Instances" module visualizes the Anti-DDoS instance status data, providing an easy and complete way to know the distribution of insecure applications.
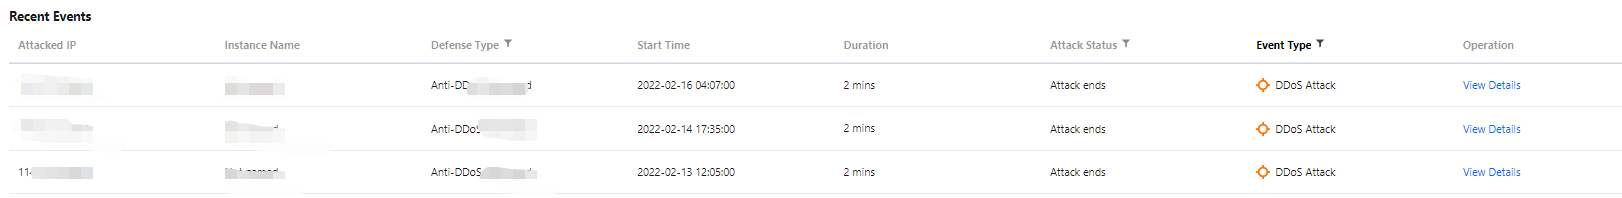
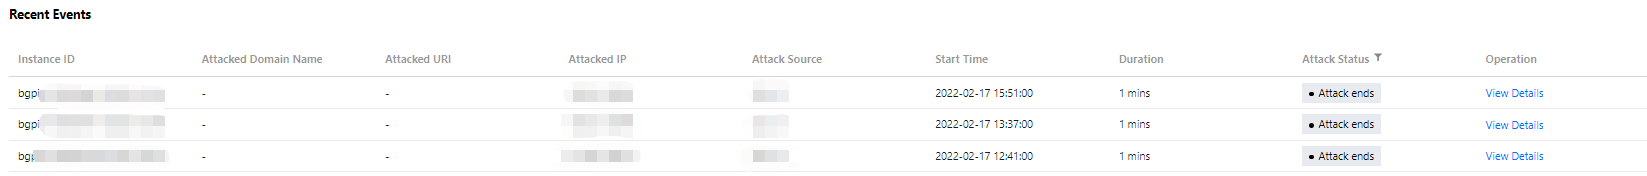
Viewing recent events
- Log in to the Anti-DDoS Advanced (Global Enterprise Edition) console and select Overview > Protection Overview.
- The "Recent Events" module shows you all the recent attack events. For attack analysis and source tracing, click View Details to enter the event details page.
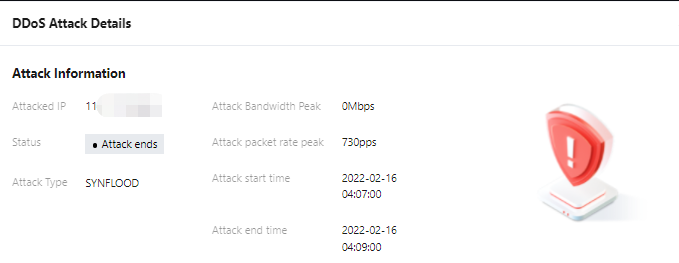
- In the "Attack Information" module of the event details page, you can view the detailed attack information for the selected period, including the attacked IP, status, attack type (which is sampled data), peak attack bandwidth and attack packet rate, and attack start and end time.
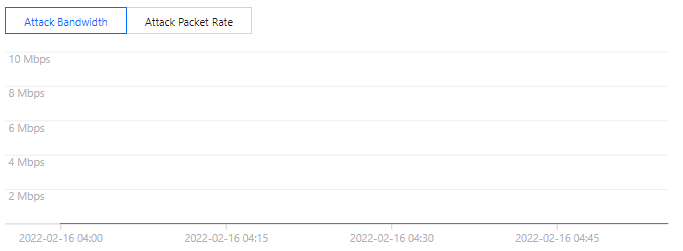
- In the "Attack Trend" module of the event details page, you can view the trend of attack bandwidth and attack packet rate and easily find the peak spikes.
Note:
This module provides complete, real-time data in the attack period.
5. In the "Attack Statistics" module of the event details page, you can view how attacks distribute over different attack traffic protocols and attack types.
Note:This module provides sampled data in the attack period.
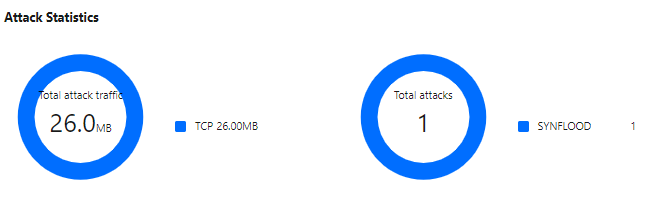
Field description:
- Attack traffic protocol distribution: It displays how attacks on the selected Anti-DDoS Advanced instance distribute over different attack traffic protocols within the queried period.
- Attack type distribution: It displays how attacks on the selected Anti-DDoS Advanced instance distribute over different attack types within the queried period.
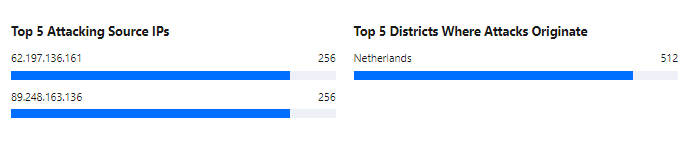
- The "Top 5" modules of the event details page displays the top 5 attacker IP addresses and the top 5 attacker regions, which is helpful to precise protection configuration.
Note:
This module provides sampled data in the attack period.
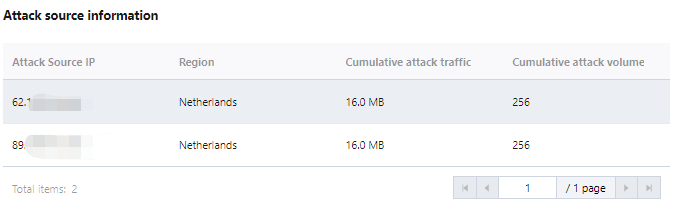
7. In the "Attacker Information" module of the event details page, you can view the sampled data of the attack period, including the attacker IP, region, total attack traffic, and total attack packets.
Note:This module provides sampled data in the attack period.
Anti-DDoS Advanced Overview
After an IP address is bound to an Anti-DDoS Advanced instance, when you receive a DDoS attack alarm message or notice any issue with your business, you need to view the attack details in the console, including the attack traffic and current protection effect. Enough information is critical for you to take measures to keep your business running smoothly.
Viewing DDoS protection details
- Log in to the Anti-DDoS Advanced (Global Enterprise Edition) console and select Overview > Protection Overview.
- On the DDoS Protection tab, set a query period, and select All Lines > Anycast to check whether there are attacks. The complete attack data is displayed by default.
Note:
You can query attack traffic and DDoS attack events in the past 180 days.

2. View the information of attacks suffered by the selected Anti-DDoS Advanced instance within the queried period, such as the trends of attack traffic bandwidth/attack packet rate.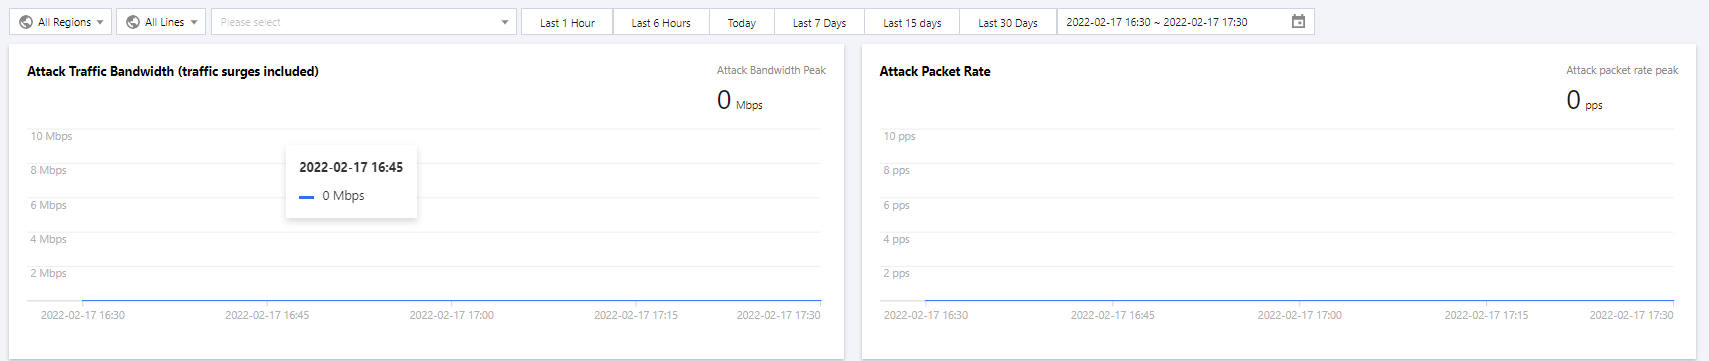
3. You can view the recent DDoS attacks in the Recent Events section. To view event details, you can click View Details.
- Information including attacker IP, attack source region, generated attack traffic, and attack packet size will be displayed for source analysis and tracing.
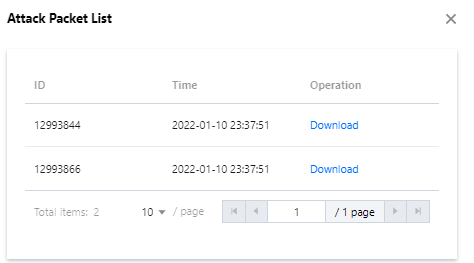
- To view sampled attack data within a specified period, click Packet Download.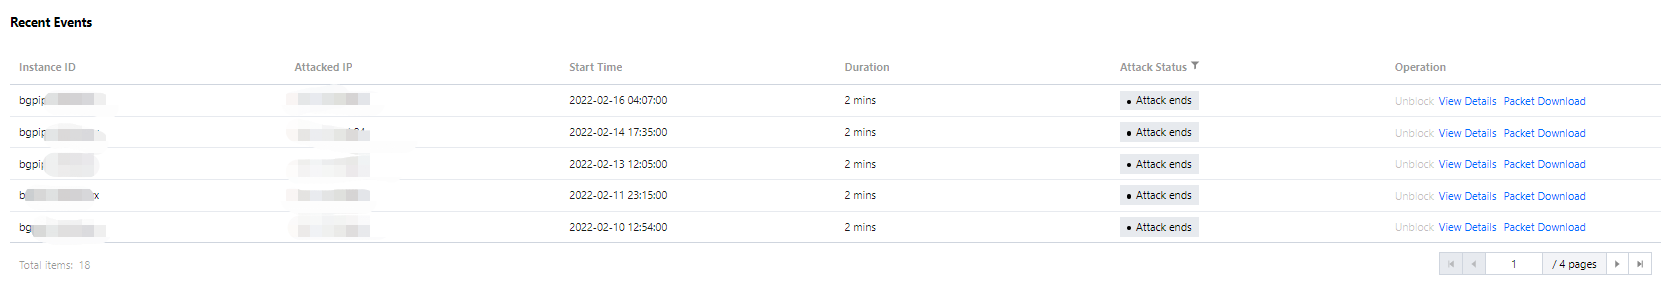
- The sampled attack packet data can be downloaded to help customize a protection plan.
4. In the Attack Statistics section, you can view how the attacks distribute across different attack traffic protocols, attack packet protocols, and attack types.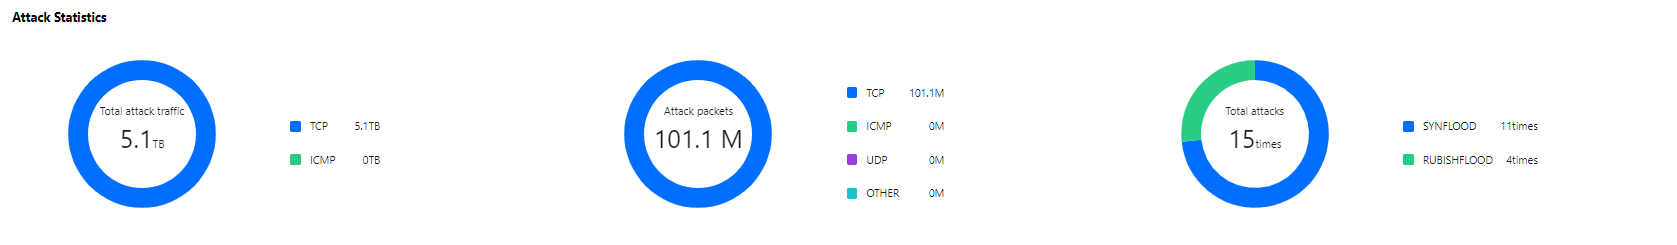
Field description:
- Attack traffic protocol distribution: It displays how attacks on the selected Anti-DDoS Advanced instance distribute over different attack traffic protocols within the queried period.
- Attack packet protocol distribution: It displays how the attacks suffered by the selected Anti-DDoS Advanced instance distribute across different attack packet protocols within the queried period.
- Attack type distribution: It displays how attacks on the selected Anti-DDoS Advanced instance distribute over different attack types within the queried period.
5. In the attack source section, you can view the distribution of DDoS attack sources in and outside the Chinese mainland within the queried period, so that you can take further protective measures.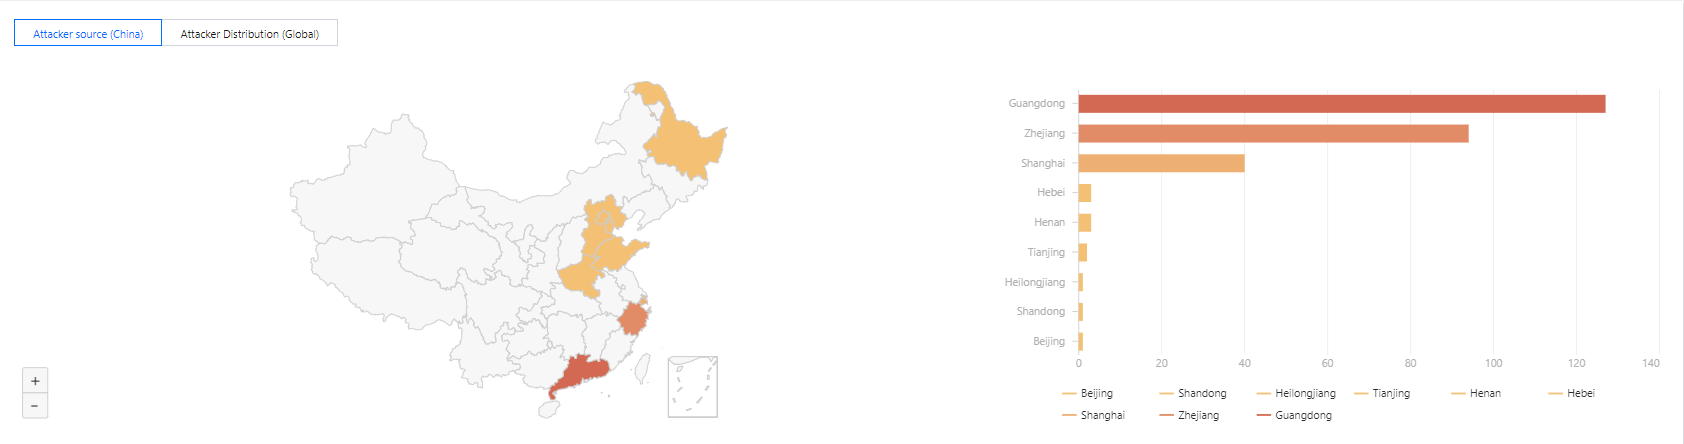
Viewing CC protection details
- On the CC Protection tab, set a query period, and select All Lines > Anycast to check whether there are attacks.

- You can select Today to view the following data to identify the impact of attacks on your business.
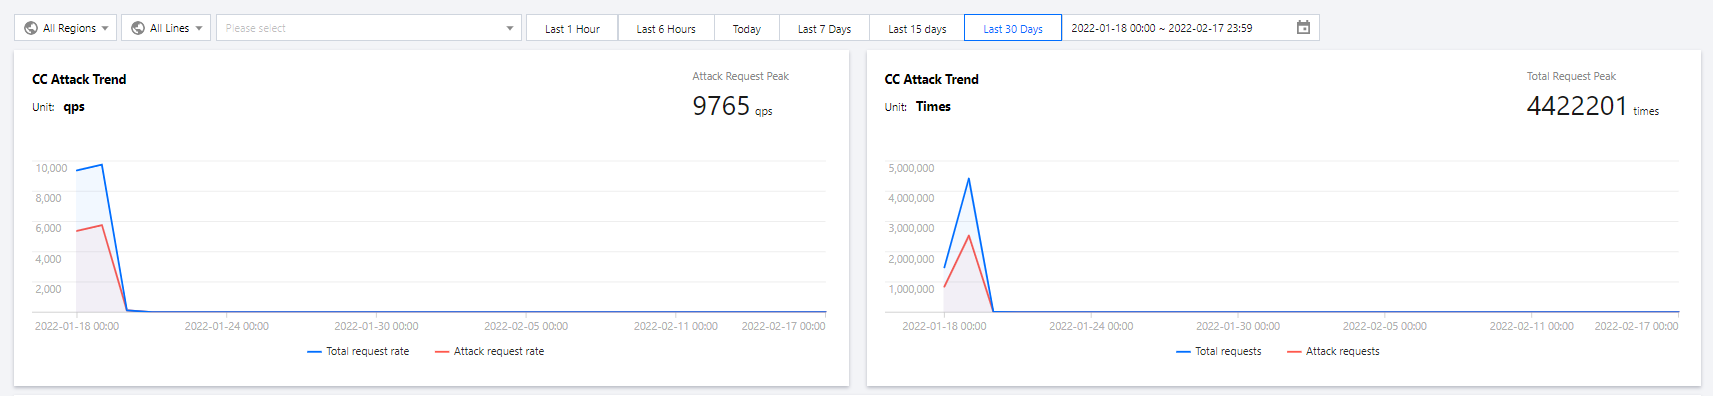
Field description:- Total request rate: The rate of total traffic (in QPS).
- Attack request rate: The rate of attack traffic (in QPS).
- Total requests: The total number of requests received.
- Attack requests: The number of attack requests received.
- You can view recent CC attacks in the Recent Events section. Click View Details on the right of an event to display the attack start and end time, attacked domain name, attacked URI, total request peak, attack request peak, and attacker IP. You can also check the attack information, attack trends, and detailed CC records.

 Yes
Yes
 No
No
Was this page helpful?