- Release Notes and Announcements
- Release Notes
- Announcements
- qGPU Service Adjustment
- Version Upgrade of Master Add-On of TKE Managed Cluster
- Upgrading tke-monitor-agent
- Discontinuing TKE API 2.0
- Instructions on Cluster Resource Quota Adjustment
- Discontinuing Kubernetes v1.14 and Earlier Versions
- Deactivation of Scaling Group Feature
- Notice on TPS Discontinuation on May 16, 2022 at 10:00 (UTC +8)
- Basic Monitoring Architecture Upgrade
- Starting Charging on Managed Clusters
- Instructions on Stopping Delivering the Kubeconfig File to Nodes
- Security Vulnerability Fix Description
- Release Notes
- Product Introduction
- Purchase Guide
- Quick Start
- TKE General Cluster Guide
- TKE General Cluster Overview
- Purchase a TKE General Cluster
- High-risk Operations of Container Service
- Deploying Containerized Applications in the Cloud
- Kubernetes API Operation Guide
- Open Source Components
- Permission Management
- Cluster Management
- Cluster Overview
- Cluster Hosting Modes Introduction
- Cluster Lifecycle
- Creating a Cluster
- Deleting a Cluster
- Cluster Scaling
- Changing the Cluster Operating System
- Connecting to a Cluster
- Upgrading a Cluster
- Enabling IPVS for a Cluster
- Enabling GPU Scheduling for a Cluster
- Custom Kubernetes Component Launch Parameters
- Using KMS for Kubernetes Data Source Encryption
- Images
- Worker node introduction
- Normal Node Management
- Native Node Management
- Overview
- Purchasing Native Nodes
- Lifecycle of a Native Node
- Native Node Parameters
- Creating Native Nodes
- Deleting Native Nodes
- Self-Heal Rules
- Declarative Operation Practice
- Native Node Scaling
- In-place Pod Configuration Adjustment
- Enabling SSH Key Login for a Native Node
- Management Parameters
- Enabling Public Network Access for a Native Node
- Supernode management
- Registered Node Management
- GPU Share
- Kubernetes Object Management
- Overview
- Namespace
- Workload
- Deployment Management
- StatefulSet Management
- DaemonSet Management
- Job Management
- CronJob Management
- Setting the Resource Limit of Workload
- Setting the Scheduling Rule for a Workload
- Setting the Health Check for a Workload
- Setting the Run Command and Parameter for a Workload
- Using a Container Image in a TCR Enterprise Instance to Create a Workload
- Auto Scaling
- Configuration
- Register node management
- Service Management
- Ingress Management
- Storage Management
- Application and Add-On Feature Management Description
- Add-On Management
- Add-on Overview
- Add-On Lifecycle Management
- CBS-CSI Description
- UserGroupAccessControl
- COS-CSI
- CFS-CSI
- P2P
- OOMGuard
- TCR Introduction
- TCR Hosts Updater
- DNSAutoscaler
- NodeProblemDetectorPlus Add-on
- NodeLocalDNSCache
- Network Policy
- DynamicScheduler
- DeScheduler
- Nginx-ingress
- HPC
- Description of tke-monitor-agent
- GPU-Manager Add-on
- CFSTURBO-CSI
- tke-log-agent
- Helm Application
- Application Market
- Network Management
- Container Network Overview
- GlobalRouter Mode
- VPC-CNI Mode
- VPC-CNI Mode
- Multiple Pods with Shared ENI Mode
- Pods with Exclusive ENI Mode
- Static IP Address Mode Instructions
- Non-static IP Address Mode Instructions
- Interconnection Between VPC-CNI and Other Cloud Resources/IDC Resources
- Security Group of VPC-CNI Mode
- Instructions on Binding an EIP to a Pod
- VPC-CNI Component Description
- Limits on the Number of Pods in VPC-CNI Mode
- Cilium-Overlay Mode
- OPS Center
- Log Management
- Backup Center
- Cloud Native Monitoring
- Remote Terminals
- TKE Serverless Cluster Guide
- TKE Edge Cluster Guide
- TKE Registered Cluster Guide
- TKE Container Instance Guide
- Cloud Native Service Guide
- Best Practices
- Cluster
- Cluster Migration
- Serverless Cluster
- Edge Cluster
- Security
- Service Deployment
- Hybrid Cloud
- Network
- DNS
- Using Network Policy for Network Access Control
- Deploying NGINX Ingress on TKE
- Nginx Ingress High-Concurrency Practices
- Nginx Ingress Best Practices
- Limiting the bandwidth on pods in TKE
- Directly connecting TKE to the CLB of pods based on the ENI
- Use CLB-Pod Direct Connection on TKE
- Obtaining the Real Client Source IP in TKE
- Using Traefik Ingress in TKE
- Release
- Logs
- Monitoring
- OPS
- Removing and Re-adding Nodes from and to Cluster
- Using Ansible to Batch Operate TKE Nodes
- Using Cluster Audit for Troubleshooting
- Renewing a TKE Ingress Certificate
- Using cert-manager to Issue Free Certificates
- Using cert-manager to Issue Free Certificate for DNSPod Domain Name
- Using the TKE NPDPlus Plug-In to Enhance the Self-Healing Capability of Nodes
- Using kubecm to Manage Multiple Clusters kubeconfig
- Quick Troubleshooting Using TKE Audit and Event Services
- Customizing RBAC Authorization in TKE
- Clearing De-registered Tencent Cloud Account Resources
- Terraform
- DevOps
- Auto Scaling
- Cluster Auto Scaling Practices
- Using tke-autoscaling-placeholder to Implement Auto Scaling in Seconds
- Installing metrics-server on TKE
- Using Custom Metrics for Auto Scaling in TKE
- Utilizing HPA to Auto Scale Businesses on TKE
- Using VPA to Realize Pod Scaling up and Scaling down in TKE
- Adjusting HPA Scaling Sensitivity Based on Different Business Scenarios
- Storage
- Containerization
- Microservice
- Cost Management
- Fault Handling
- Disk Full
- High Workload
- Memory Fragmentation
- Cluster DNS Troubleshooting
- Cluster kube-proxy Troubleshooting
- Cluster API Server Inaccessibility Troubleshooting
- Service and Ingress Inaccessibility Troubleshooting
- Troubleshooting for Pod Network Inaccessibility
- Pod Status Exception and Handling
- Authorizing Tencent Cloud OPS Team for Troubleshooting
- Engel Ingres appears in Connechtin Reverside
- CLB Loopback
- CLB Ingress Creation Error
- API Documentation
- History
- Introduction
- API Category
- Making API Requests
- Cluster APIs
- DescribeEncryptionStatus
- DisableEncryptionProtection
- EnableEncryptionProtection
- AcquireClusterAdminRole
- CreateClusterEndpoint
- CreateClusterEndpointVip
- DeleteCluster
- DeleteClusterEndpoint
- DeleteClusterEndpointVip
- DescribeAvailableClusterVersion
- DescribeClusterAuthenticationOptions
- DescribeClusterCommonNames
- DescribeClusterEndpointStatus
- DescribeClusterEndpointVipStatus
- DescribeClusterEndpoints
- DescribeClusterKubeconfig
- DescribeClusterLevelAttribute
- DescribeClusterLevelChangeRecords
- DescribeClusterSecurity
- DescribeClusterStatus
- DescribeClusters
- DescribeEdgeAvailableExtraArgs
- DescribeEdgeClusterExtraArgs
- DescribeResourceUsage
- DisableClusterDeletionProtection
- EnableClusterDeletionProtection
- GetClusterLevelPrice
- GetUpgradeInstanceProgress
- ModifyClusterAttribute
- ModifyClusterAuthenticationOptions
- ModifyClusterEndpointSP
- UpgradeClusterInstances
- CreateCluster
- UpdateClusterVersion
- UpdateClusterKubeconfig
- DescribeBackupStorageLocations
- DeleteBackupStorageLocation
- CreateBackupStorageLocation
- Add-on APIs
- Network APIs
- Node APIs
- Node Pool APIs
- TKE Edge Cluster APIs
- DescribeTKEEdgeScript
- DescribeTKEEdgeExternalKubeconfig
- DescribeTKEEdgeClusters
- DescribeTKEEdgeClusterStatus
- DescribeTKEEdgeClusterCredential
- DescribeEdgeClusterInstances
- DescribeEdgeCVMInstances
- DescribeECMInstances
- DescribeAvailableTKEEdgeVersion
- DeleteTKEEdgeCluster
- DeleteEdgeClusterInstances
- DeleteEdgeCVMInstances
- DeleteECMInstances
- CreateTKEEdgeCluster
- CreateECMInstances
- CheckEdgeClusterCIDR
- ForwardTKEEdgeApplicationRequestV3
- UninstallEdgeLogAgent
- InstallEdgeLogAgent
- DescribeEdgeLogSwitches
- CreateEdgeLogConfig
- CreateEdgeCVMInstances
- UpdateEdgeClusterVersion
- DescribeEdgeClusterUpgradeInfo
- Cloud Native Monitoring APIs
- Virtual node APIs
- Other APIs
- Scaling group APIs
- Data Types
- Error Codes
- API Mapping Guide
- TKE Insight
- TKE Scheduling
- FAQs
- Service Agreement
- Contact Us
- Purchase Channels
- Glossary
- User Guide(Old)
Self-built ELK Log Service Best Practices
Last updated: 2019-11-01 10:06:23
This document is currently invalid. Please refer to the documentation page of the product.
Operation Scenario
In large-scale distributed applications, or when the workloads of a service are distributed across multiple servers, you can use Linux commands to view application logs one by one. However, this method is highly inefficient, and it is even more complicated when using container deployment services rather than normal distributed applications. Because containers are managed by an upper-level orchestration system, their associated connections with the server are variable. Without a single service to collect and display the application logs, exploring the logs becomes even more difficult.
That’s why TKE is integrated with Tencent Cloud Log Service (CLS), which supports the configuration of collection rules to automatically collect and report logs. It also supports using the log collection and visualization service ELK (Elasticsearch + Logstash + Kibana). This document introduces the application of basic templates provided by Tencent Cloud TKE to create an ELK deployment that uses log data read from Kafka.
Prerequisites
- Create a cluster. For more information, please see Creating a Cluster.
- Ensure the cluster has enough resources before deployment.
- Log into the node.
Steps
Deploying Elasticsearch + Kibana for Log Retrieval and Display
Elasticsearch is an open source, distributed search engine based on Apache Lucene (TM) that provides a RESTful API. Within the framework of ELK, Elasticsearch provides quick data storage and query capabilities. Kibana is an open source data analysis and visualization platform for Elasticsearch. It is used to search and display data stored in the Elasticsearch search engine.
The following steps use the ELK basic template provided by TKE to build an Elasticsearch cluster and Kibana.
If the node does not have Git, first executes the
yum install gitcommand to install Git.
Execute the following command to download the required YAML files to nodes in a TKE cluster.
git clone https://github.com/tencentyun/ccs-elasticsearch-template.git /tmp/kubernetes-elasticsearchExecute the following commands to create an Elasticsearch deployment.
cd /tmp/kubernetes-elasticsearch
kubectl create -f es-svc.yaml
kubectl create -f es-client.yaml
kubectl create -f es-data.yaml
kubectl create -f es-discovery-svc.yaml
kubectl create -f es-master.yaml
Execute the following commands to create a Kibana deployment.
cd /tmp/kubernetes-elasticsearch
kubectl create -f kibana-svc.yaml
kubectl create -f kibana.yaml
Deploying Logstash to Collect Data Specified by a Kafka Topic
Logstash is an open source log analysis and processing program that can collect and transform data from a variety of sources, including Syslog, Filebeat, Kafka, etc. It also supports sending collected data to Elasticsearch.
The Logstash deployed in this example reads data from the configured Kafka by default, and then sends it to the deployed Elasticsearch service.
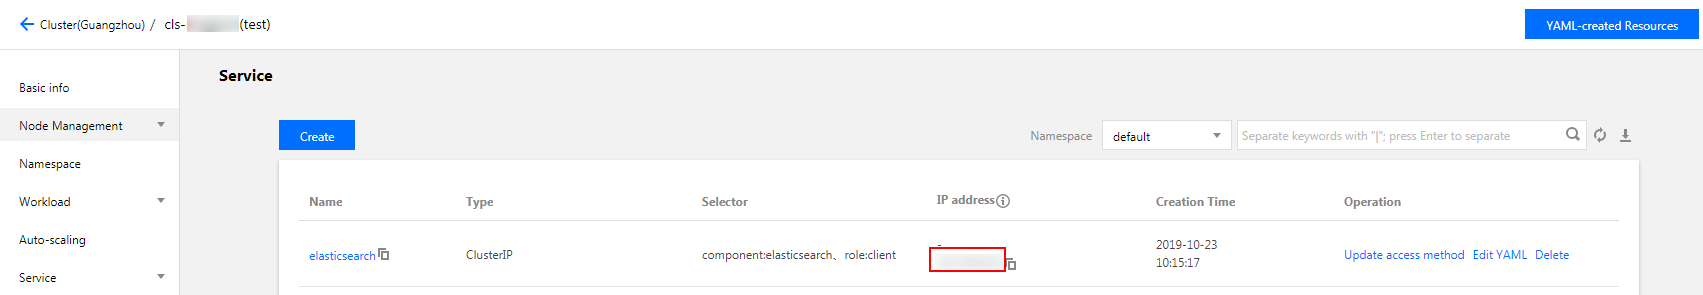
- Log in to TKE console and click on the cluster with Elasticsearch + Kibana already deployed to go to the cluster deployment page.
- Select Service > Service to go to the service details page and view the IP of the created Elasticsearch service. See the figure below:
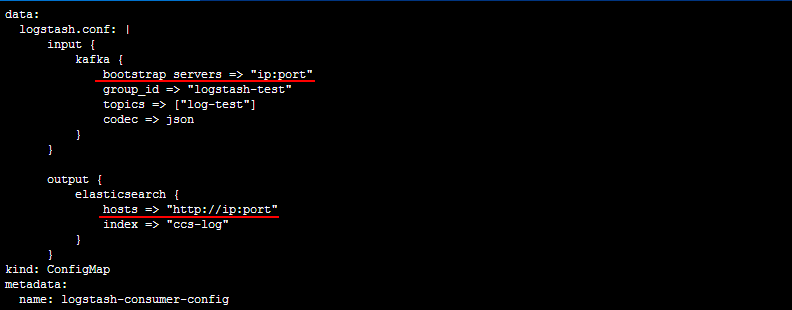
- Execute the following commands to modify
/tmp/kubernetes-elasticsearch/logstash-config.yaml.cd /tmp/kubernetes-elasticsearch vim logstash-config.yaml - Press i or Insert to switch to editing mode, then modify the Kafka and Elasticsearch addresses. See the figure below:
- After modifying the address, press Esc and enter :wq to save the file and go back.
- Execute the following commands to deploy Logstash.
kubectl create -f logstash-config.yaml
kubectl create -f logstash-consumer.yaml
Log Data in Kibana
This text takes ELK deployment in a TKE cluster and log data read from Kafka as an example. For more instructions on using and troubleshooting ELK, check online.
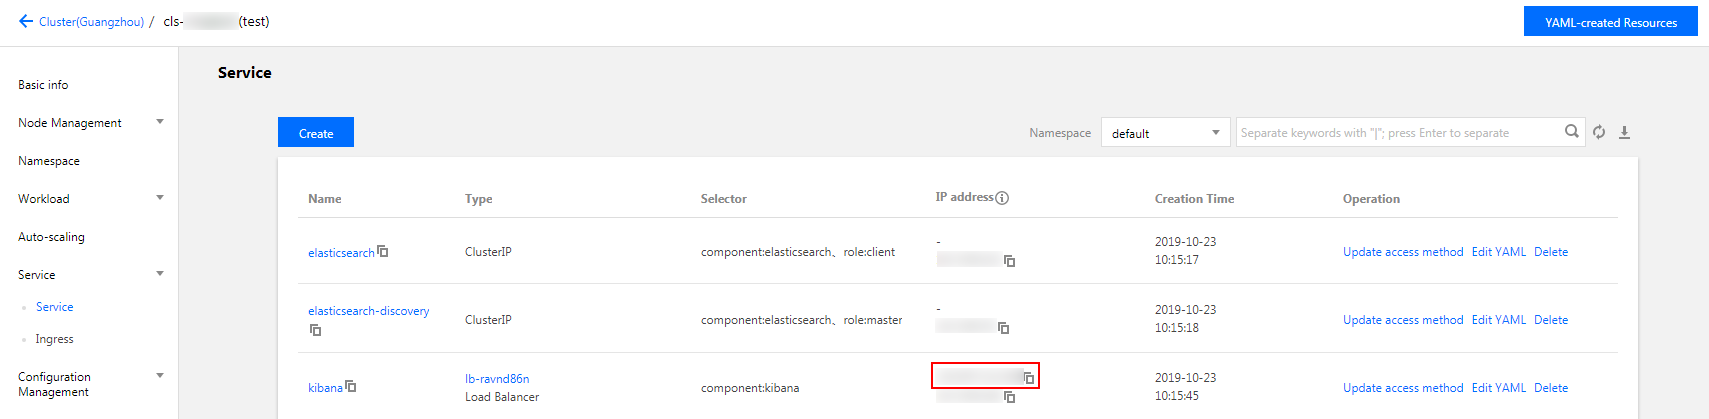
- Log in to TKE console and click the deployed cluster to go to the cluster deployment page.
- Select Service > Service to go to the service details page and obtain the Load Balancer IP of the Kibana service that has already been created. See the figure below:
- Access its public Load Balancer IP to open a Kibana dashboard and explore the logs. See the figure below:
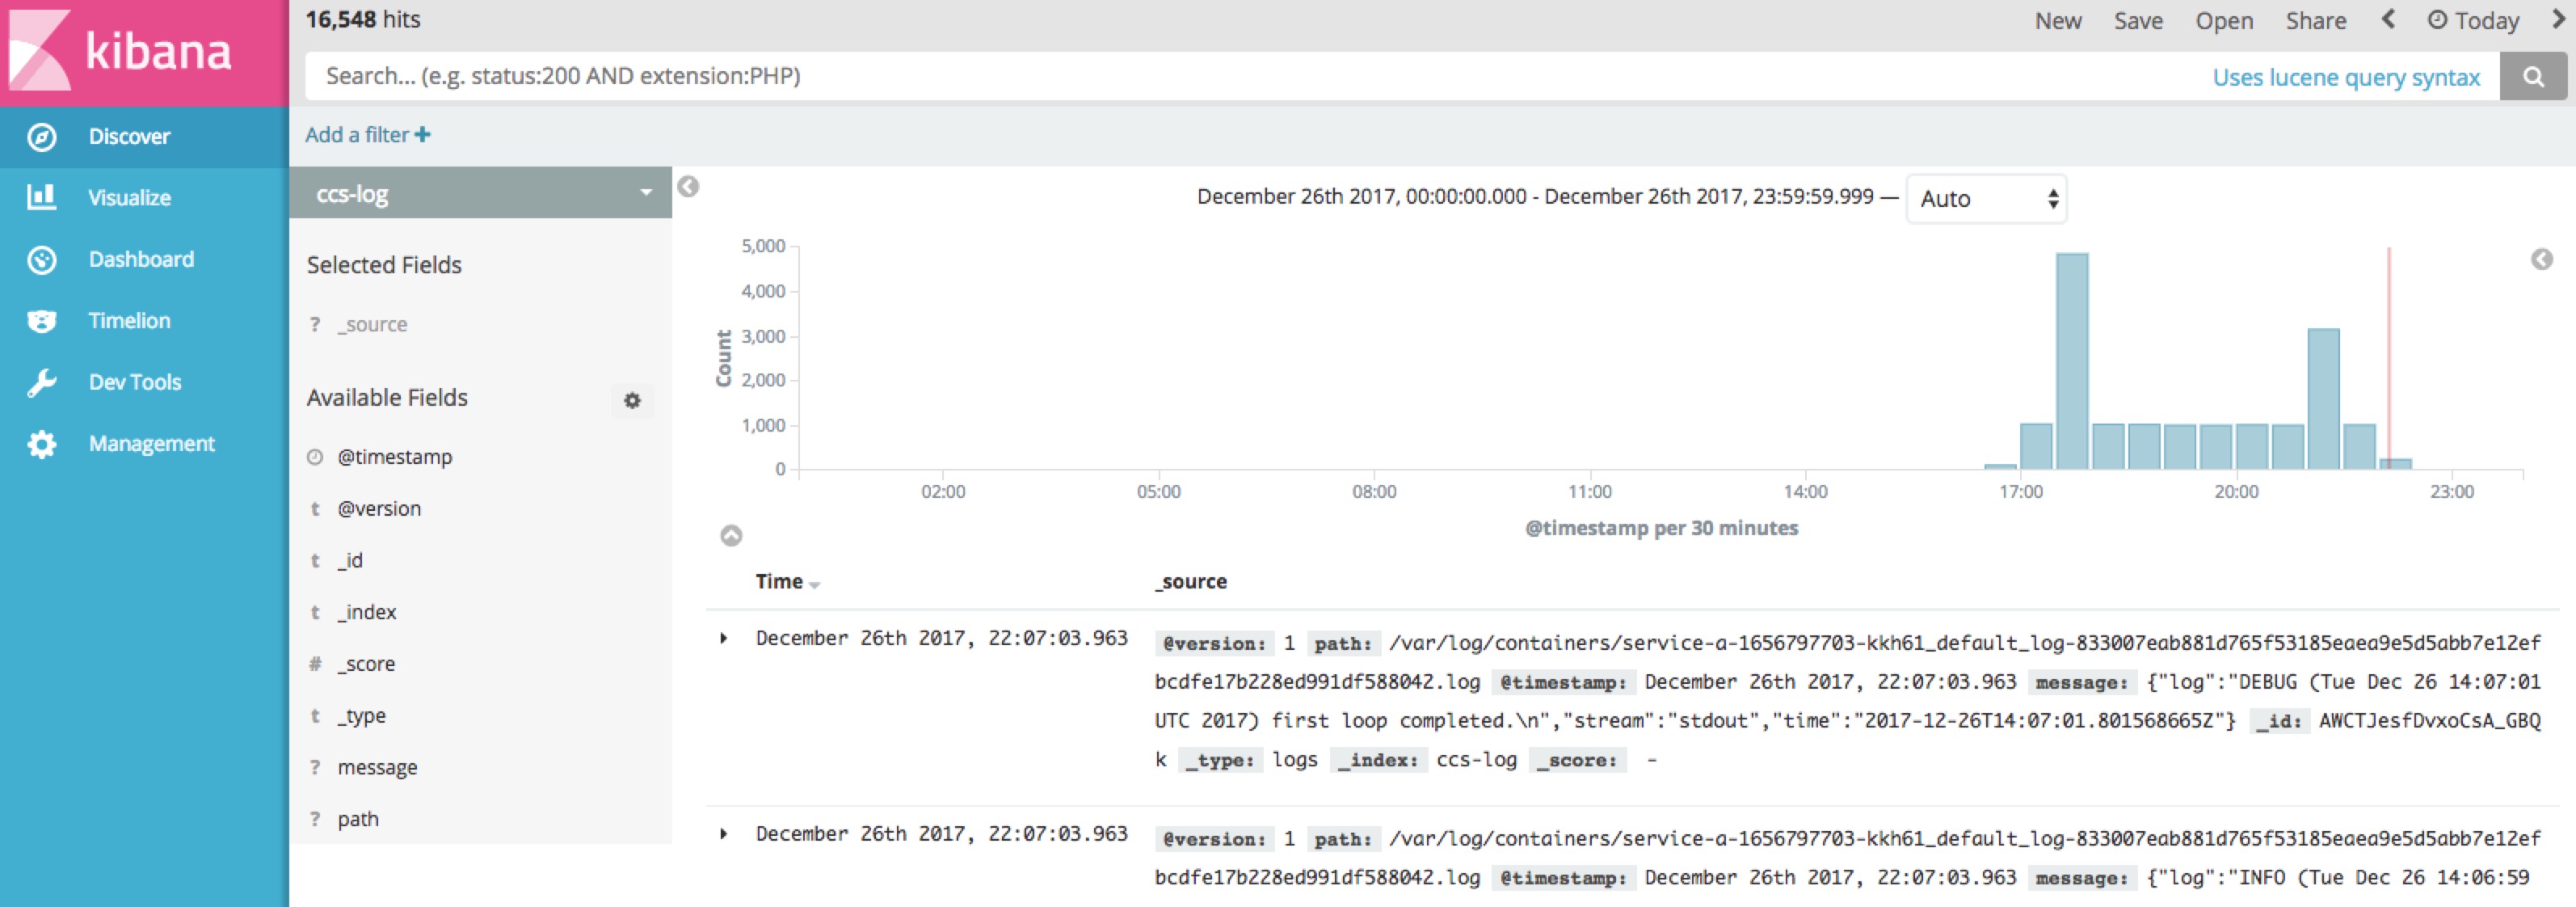
Before using Kibana to retrieve logs, you must ensure that there is a corresponding index pattern configured in Elasticsearch. See the figure below: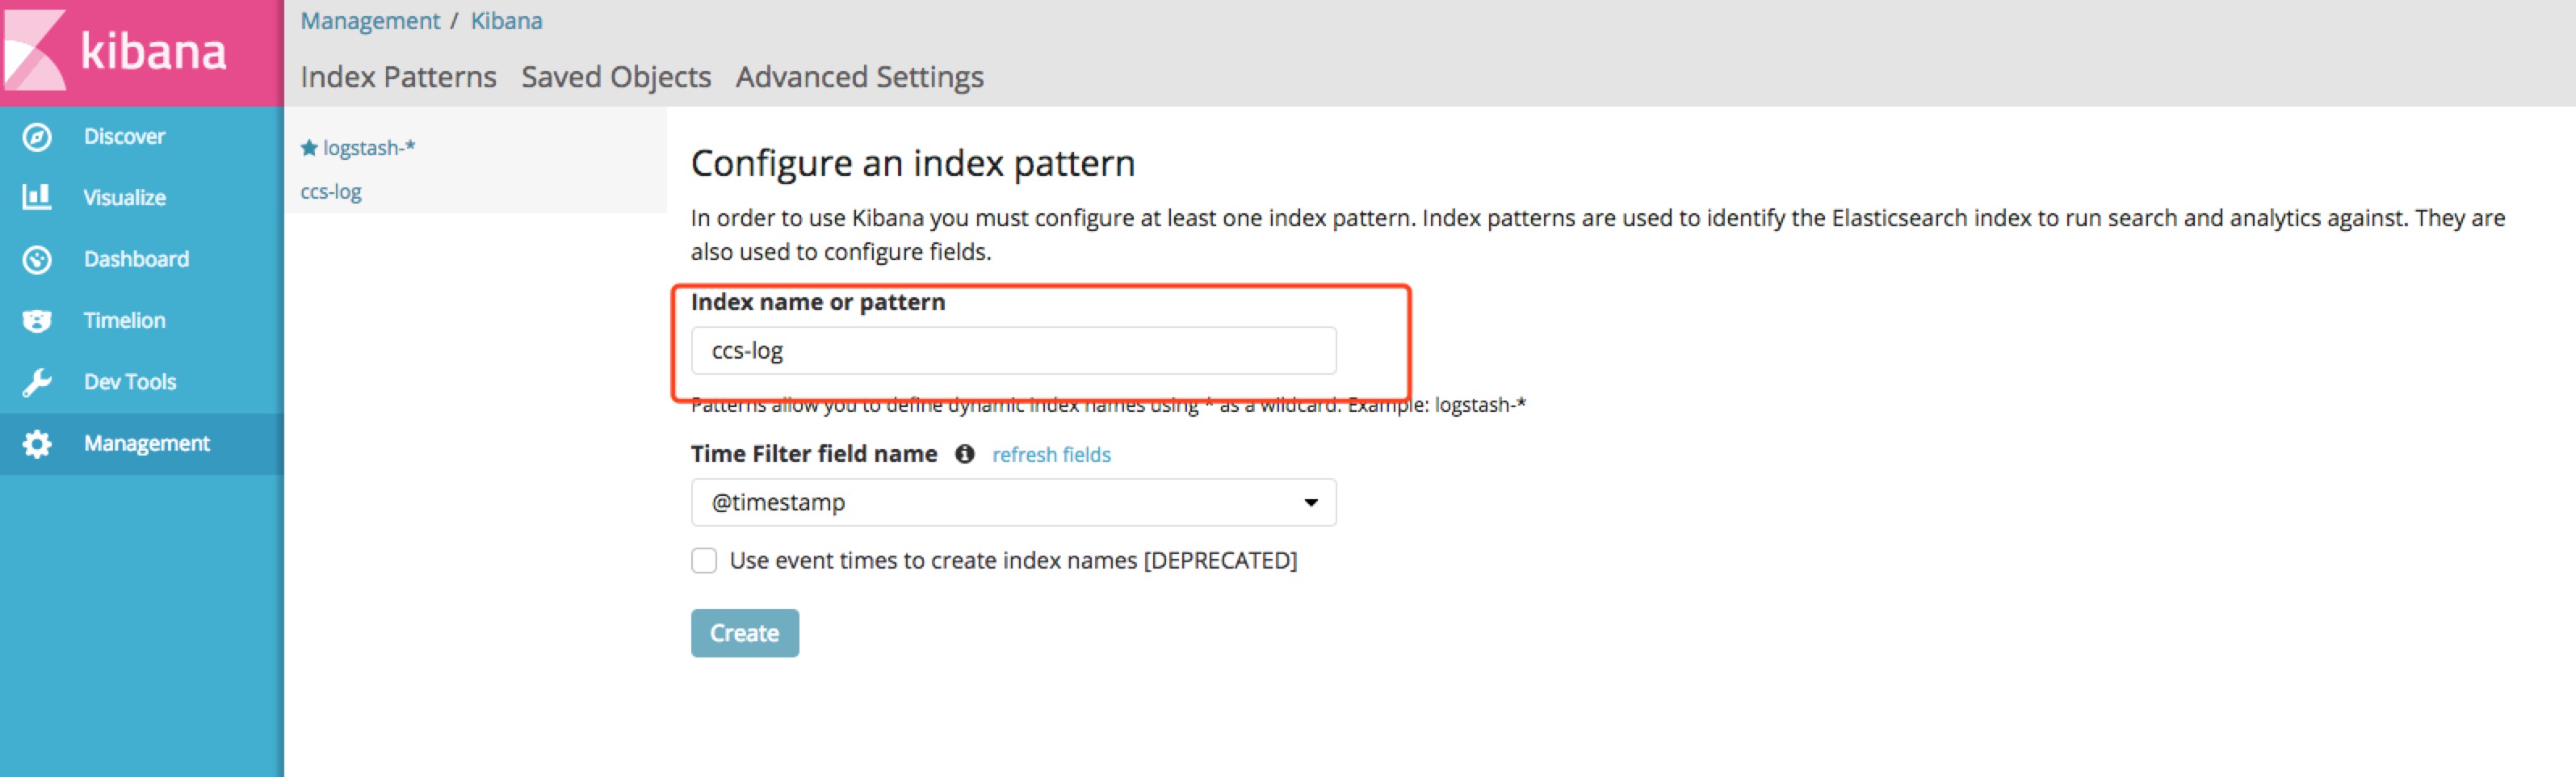

 Yes
Yes
 No
No
Was this page helpful?