- Release Notes and Announcements
- Release Notes
- Announcements
- qGPU Service Adjustment
- Version Upgrade of Master Add-On of TKE Managed Cluster
- Upgrading tke-monitor-agent
- Discontinuing TKE API 2.0
- Instructions on Cluster Resource Quota Adjustment
- Discontinuing Kubernetes v1.14 and Earlier Versions
- Deactivation of Scaling Group Feature
- Notice on TPS Discontinuation on May 16, 2022 at 10:00 (UTC +8)
- Basic Monitoring Architecture Upgrade
- Starting Charging on Managed Clusters
- Instructions on Stopping Delivering the Kubeconfig File to Nodes
- Security Vulnerability Fix Description
- Release Notes
- Product Introduction
- Purchase Guide
- Quick Start
- TKE General Cluster Guide
- TKE General Cluster Overview
- Purchase a TKE General Cluster
- High-risk Operations of Container Service
- Deploying Containerized Applications in the Cloud
- Kubernetes API Operation Guide
- Open Source Components
- Permission Management
- Cluster Management
- Cluster Overview
- Cluster Hosting Modes Introduction
- Cluster Lifecycle
- Creating a Cluster
- Deleting a Cluster
- Cluster Scaling
- Changing the Cluster Operating System
- Connecting to a Cluster
- Upgrading a Cluster
- Enabling IPVS for a Cluster
- Enabling GPU Scheduling for a Cluster
- Custom Kubernetes Component Launch Parameters
- Using KMS for Kubernetes Data Source Encryption
- Images
- Worker node introduction
- Normal Node Management
- Native Node Management
- Overview
- Purchasing Native Nodes
- Lifecycle of a Native Node
- Native Node Parameters
- Creating Native Nodes
- Deleting Native Nodes
- Self-Heal Rules
- Declarative Operation Practice
- Native Node Scaling
- In-place Pod Configuration Adjustment
- Enabling SSH Key Login for a Native Node
- Management Parameters
- Enabling Public Network Access for a Native Node
- Supernode management
- Registered Node Management
- GPU Share
- Kubernetes Object Management
- Overview
- Namespace
- Workload
- Deployment Management
- StatefulSet Management
- DaemonSet Management
- Job Management
- CronJob Management
- Setting the Resource Limit of Workload
- Setting the Scheduling Rule for a Workload
- Setting the Health Check for a Workload
- Setting the Run Command and Parameter for a Workload
- Using a Container Image in a TCR Enterprise Instance to Create a Workload
- Auto Scaling
- Configuration
- Register node management
- Service Management
- Ingress Management
- Storage Management
- Application and Add-On Feature Management Description
- Add-On Management
- Add-on Overview
- Add-On Lifecycle Management
- CBS-CSI Description
- UserGroupAccessControl
- COS-CSI
- CFS-CSI
- P2P
- OOMGuard
- TCR Introduction
- TCR Hosts Updater
- DNSAutoscaler
- NodeProblemDetectorPlus Add-on
- NodeLocalDNSCache
- Network Policy
- DynamicScheduler
- DeScheduler
- Nginx-ingress
- HPC
- Description of tke-monitor-agent
- GPU-Manager Add-on
- CFSTURBO-CSI
- tke-log-agent
- Helm Application
- Application Market
- Network Management
- Container Network Overview
- GlobalRouter Mode
- VPC-CNI Mode
- VPC-CNI Mode
- Multiple Pods with Shared ENI Mode
- Pods with Exclusive ENI Mode
- Static IP Address Mode Instructions
- Non-static IP Address Mode Instructions
- Interconnection Between VPC-CNI and Other Cloud Resources/IDC Resources
- Security Group of VPC-CNI Mode
- Instructions on Binding an EIP to a Pod
- VPC-CNI Component Description
- Limits on the Number of Pods in VPC-CNI Mode
- Cilium-Overlay Mode
- OPS Center
- Log Management
- Backup Center
- Cloud Native Monitoring
- Remote Terminals
- TKE Serverless Cluster Guide
- TKE Edge Cluster Guide
- TKE Registered Cluster Guide
- TKE Container Instance Guide
- Cloud Native Service Guide
- Best Practices
- Cluster
- Cluster Migration
- Serverless Cluster
- Edge Cluster
- Security
- Service Deployment
- Hybrid Cloud
- Network
- DNS
- Using Network Policy for Network Access Control
- Deploying NGINX Ingress on TKE
- Nginx Ingress High-Concurrency Practices
- Nginx Ingress Best Practices
- Limiting the bandwidth on pods in TKE
- Directly connecting TKE to the CLB of pods based on the ENI
- Use CLB-Pod Direct Connection on TKE
- Obtaining the Real Client Source IP in TKE
- Using Traefik Ingress in TKE
- Release
- Logs
- Monitoring
- OPS
- Removing and Re-adding Nodes from and to Cluster
- Using Ansible to Batch Operate TKE Nodes
- Using Cluster Audit for Troubleshooting
- Renewing a TKE Ingress Certificate
- Using cert-manager to Issue Free Certificates
- Using cert-manager to Issue Free Certificate for DNSPod Domain Name
- Using the TKE NPDPlus Plug-In to Enhance the Self-Healing Capability of Nodes
- Using kubecm to Manage Multiple Clusters kubeconfig
- Quick Troubleshooting Using TKE Audit and Event Services
- Customizing RBAC Authorization in TKE
- Clearing De-registered Tencent Cloud Account Resources
- Terraform
- DevOps
- Auto Scaling
- Cluster Auto Scaling Practices
- Using tke-autoscaling-placeholder to Implement Auto Scaling in Seconds
- Installing metrics-server on TKE
- Using Custom Metrics for Auto Scaling in TKE
- Utilizing HPA to Auto Scale Businesses on TKE
- Using VPA to Realize Pod Scaling up and Scaling down in TKE
- Adjusting HPA Scaling Sensitivity Based on Different Business Scenarios
- Storage
- Containerization
- Microservice
- Cost Management
- Fault Handling
- Disk Full
- High Workload
- Memory Fragmentation
- Cluster DNS Troubleshooting
- Cluster kube-proxy Troubleshooting
- Cluster API Server Inaccessibility Troubleshooting
- Service and Ingress Inaccessibility Troubleshooting
- Troubleshooting for Pod Network Inaccessibility
- Pod Status Exception and Handling
- Authorizing Tencent Cloud OPS Team for Troubleshooting
- Engel Ingres appears in Connechtin Reverside
- CLB Loopback
- CLB Ingress Creation Error
- API Documentation
- History
- Introduction
- API Category
- Making API Requests
- Cluster APIs
- DescribeEncryptionStatus
- DisableEncryptionProtection
- EnableEncryptionProtection
- AcquireClusterAdminRole
- CreateClusterEndpoint
- CreateClusterEndpointVip
- DeleteCluster
- DeleteClusterEndpoint
- DeleteClusterEndpointVip
- DescribeAvailableClusterVersion
- DescribeClusterAuthenticationOptions
- DescribeClusterCommonNames
- DescribeClusterEndpointStatus
- DescribeClusterEndpointVipStatus
- DescribeClusterEndpoints
- DescribeClusterKubeconfig
- DescribeClusterLevelAttribute
- DescribeClusterLevelChangeRecords
- DescribeClusterSecurity
- DescribeClusterStatus
- DescribeClusters
- DescribeEdgeAvailableExtraArgs
- DescribeEdgeClusterExtraArgs
- DescribeResourceUsage
- DisableClusterDeletionProtection
- EnableClusterDeletionProtection
- GetClusterLevelPrice
- GetUpgradeInstanceProgress
- ModifyClusterAttribute
- ModifyClusterAuthenticationOptions
- ModifyClusterEndpointSP
- UpgradeClusterInstances
- CreateCluster
- UpdateClusterVersion
- UpdateClusterKubeconfig
- DescribeBackupStorageLocations
- DeleteBackupStorageLocation
- CreateBackupStorageLocation
- Add-on APIs
- Network APIs
- Node APIs
- Node Pool APIs
- TKE Edge Cluster APIs
- DescribeTKEEdgeScript
- DescribeTKEEdgeExternalKubeconfig
- DescribeTKEEdgeClusters
- DescribeTKEEdgeClusterStatus
- DescribeTKEEdgeClusterCredential
- DescribeEdgeClusterInstances
- DescribeEdgeCVMInstances
- DescribeECMInstances
- DescribeAvailableTKEEdgeVersion
- DeleteTKEEdgeCluster
- DeleteEdgeClusterInstances
- DeleteEdgeCVMInstances
- DeleteECMInstances
- CreateTKEEdgeCluster
- CreateECMInstances
- CheckEdgeClusterCIDR
- ForwardTKEEdgeApplicationRequestV3
- UninstallEdgeLogAgent
- InstallEdgeLogAgent
- DescribeEdgeLogSwitches
- CreateEdgeLogConfig
- CreateEdgeCVMInstances
- UpdateEdgeClusterVersion
- DescribeEdgeClusterUpgradeInfo
- Cloud Native Monitoring APIs
- Virtual node APIs
- Other APIs
- Scaling group APIs
- Data Types
- Error Codes
- API Mapping Guide
- TKE Insight
- TKE Scheduling
- FAQs
- Service Agreement
- Contact Us
- Purchase Channels
- Glossary
- User Guide(Old)
Note:From now to June 30, 2022, users are exempt from CLS service fees incurred by audit log/event data generated by TKE for auto-created log topics. For details, see Note on Free Log Storage for TKE Audit and Event Center.
Introduction
Cluster audit is a feature based on Kubernetes Audit that can store and search the records of kube-apiserver JSON logs to generate configurable policies. This feature records the access events of kube-apiserver and records the activities of each user, admin, or system component that has an impact on the cluster in sequence.
Advantages
The cluster audit feature provides a different cluster monitoring dimension from metrics. After cluster audit is enabled, Kubernetes can record the log of every audit operation on the cluster. An audit log is a structured record in JSON format and consists of three parts: metadata, requestObject, and responseObject. The metadata (containing request context information, such as who initiated the request, where it was initiated, and the accessed URI) component is required, whereas requestObject and responseObject are optional, depending on the audit level. You can obtain the following information from logs:
- Activities that occur in the cluster
- Activity occurrence times and objects
- Activity triggering times, triggering positions, and observation points
- Activity results and subsequent processing
Reading the audit log
{
  "kind":"Event",
  "apiVersion":"audit.k8s.io/v1",
  "level":"RequestResponse",
  "auditID":0a4376d5-307a-4e16-a049-24e017******,
  "stage":"ResponseComplete",
  // What happened?
  "requestURI":"/apis/apps/v1/namespaces/default/deployments",
  "verb":"create",
  // Who initiated the request?
  "user":{
    "username":"admin",
      "uid":"admin",
      "groups":[
        "system:masters",
        "system:authenticated"
      ]
  },
  // Where was it initiated?
  "sourceIPs":[
    "10.0.6.68"
  ],
  "userAgent":"kubectl/v1.16.3 (linux/amd64) kubernetes/ald64d8",
  // What happened?
  "objectRef":{
    "resource":"deployments",
    "namespace":"default",
    "name":"nginx-deployment",
    "apiGroup":"apps",
    "apiVersion":"v1"
  },
  // What is the result?
  "responseStatus":{
    "metadata":{
    },
    "code":201
  },
  // Request and response details
  "requestObject":Object{...},
  "responseObject":Object{...},
  // When did it start/end?
  "requestReceivedTimestamp":"2020-04-10T10:47:34.315746Z",
  "stageTimestamp":"2020-04-10T10:47:34.328942Z",
  // Reason for accepting/rejecting the request
  "annotations":{
    "authorization.k8s.io/decision":"allow",
    "authorization.k8s.io/reason":""
  }
}
TKE Cluster Audit Policies
Audit levels (levels)
Unlike common logs, the level of a Kubernetes audit log is more like a verbose configuration, which is used to indicate the degree of detail of the recorded information. There are four audit levels, as described in the following table:
| Parameter | Description |
|---|---|
| None | Nothing is recorded |
| Metadata | The metadata of the request (for example, the user, time, resources, and operation) is recorded, excluding the message bodies of the request and response |
| Request | The metadata and request message body are recorded, excluding the response message body |
| RequestResponse | All information is recorded, including the metadata and the message bodies of the request and response |
Audit stages (stages)
Logs can be recorded at different stages, as described in the following table:
| Parameter | Description |
|---|---|
| RequestReceived | The log is recorded when the request is received |
| ResponseStarted | The log is recorded after the message header of the response is sent. This parameter is applicable only to persistent connection requests, such as watch. |
| ResponseComplete | The log is recorded after the response is fully sent |
| Panic | The request is not completed due to an internal server error |
TKE audit policies
By default, TKE records audit logs when receiving requests. For most operations, audit logs of the RequestResponse level are recorded, except for the following cases:
- For get, list, and watch, logs of the Request level are recorded.
- For requests of secrets resources, configmaps resources, or tokenreviews resources, logs of the Metadata level are recorded.
Logs will not be recorded for the following requests:
- Requests sent by
system:kube-proxyfor monitoring endpoints resources, services resources, or services/status resources. - get requests sent by
system:unsecuredfor configmaps resources in the kube-system namespace. - get requests sent by kubelet for nodes resources or nodes/status resources.
- get requests sent by any identity in
system:nodesfor nodes resources or nodes/status resources. - get and update requests sent by
system:kube-controller-manager,system:kube-scheduler, orsystem:serviceaccount:endpoint-controllerfor endpoint resources in the kube-system namespace. - get requests sent by
system:apiserverfor namespaces resources, namespaces/status resources, or namespaces/finalize resources. - Requests sent to URLs that match
/healthz*,/version, or/swagger*.
Directions
Enabling cluster audit
Note:
- To enable the cluster audit feature, you need to restart kube-apiserver. We recommend that you do not frequently enable and disable the feature.
- A self-deployed cluster consumes about 1 GB of local storage on the master node. Therefore, ensure that the storage of the master node is sufficient.
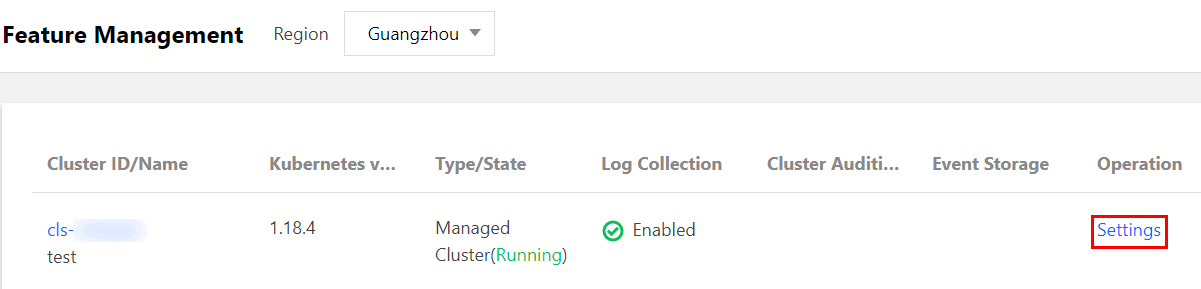
- Log in to the TKE console.
- Choose Cluster OPS > Feature Management in the left sidebar to go to the Feature Management page.
- At the top of the "Feature Management" page, select the region. Click Set for the cluster that you want to enable cluster audit, as shown in the figure below:
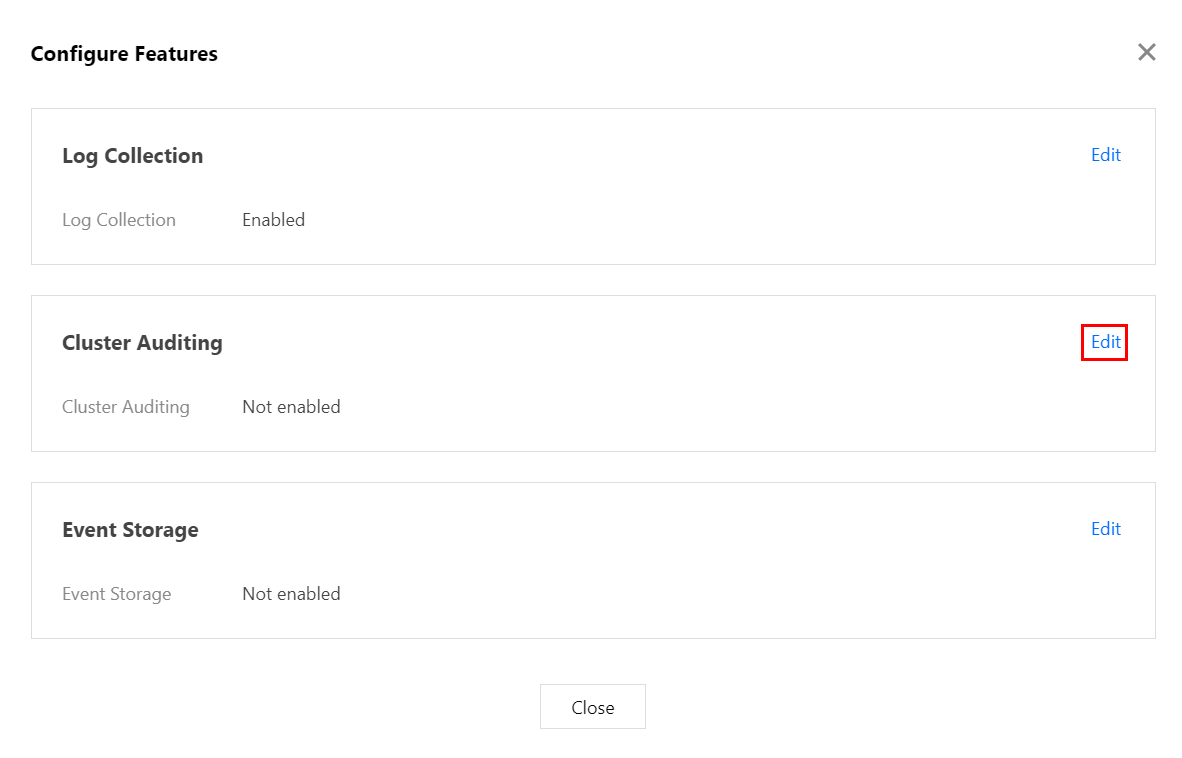
- In the "Configure a Feature" window that appears, click Edit for the "Cluster Audit" feature.
- Select Enable Cluster Audit and select the logset and log topic for storing audit logs. We recommend that you select Automatically Create a Log Topic.
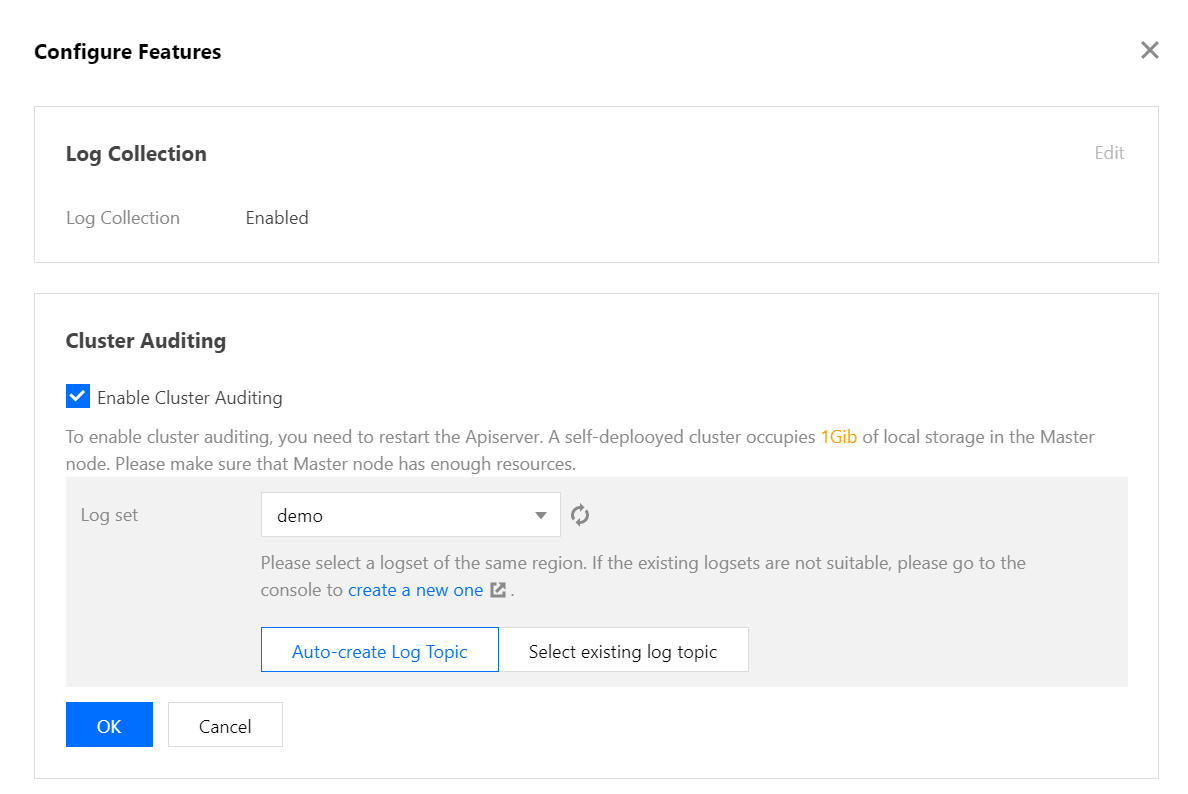
- Click OK to enable the cluster audit feature.

 Yes
Yes
 No
No
Was this page helpful?