Traditional object management webpages typically use a list-based format, as exemplified by the existing resource object list for TKE clusters in the TKE console. However, this approach suffers from several limits, including low readability due to abstract numerical values, lack of clear object identification, and the inability to support certain sorting methods. To break these limits, TKE Insight has introduced Node Map, a platform that displays all resource objects of users in a visualized way. This platform provides rich query filtering, type-based aggregation, and status display features that enable users to rapidly locate their required objects.
Node Map displays the status and metrics of nodes by using visualized charts and diagrams on webpage. This assists users in comprehending the resource utilization and load rate of their current cluster nodes, as well as in analyzing any potential issues on the nodes.
Precaution
Node Map does not support the statistical analysis of metrics on super nodes.
3. On the Node Map page, set the Region, Cluster Type, and Cluster to view data.
4. In the upper right corner, set the Period (24 hours, 7 days, or 30 days), Granularity, and Value type (Average or Peak) to filter data, as shown below:
Node Map Feature Description
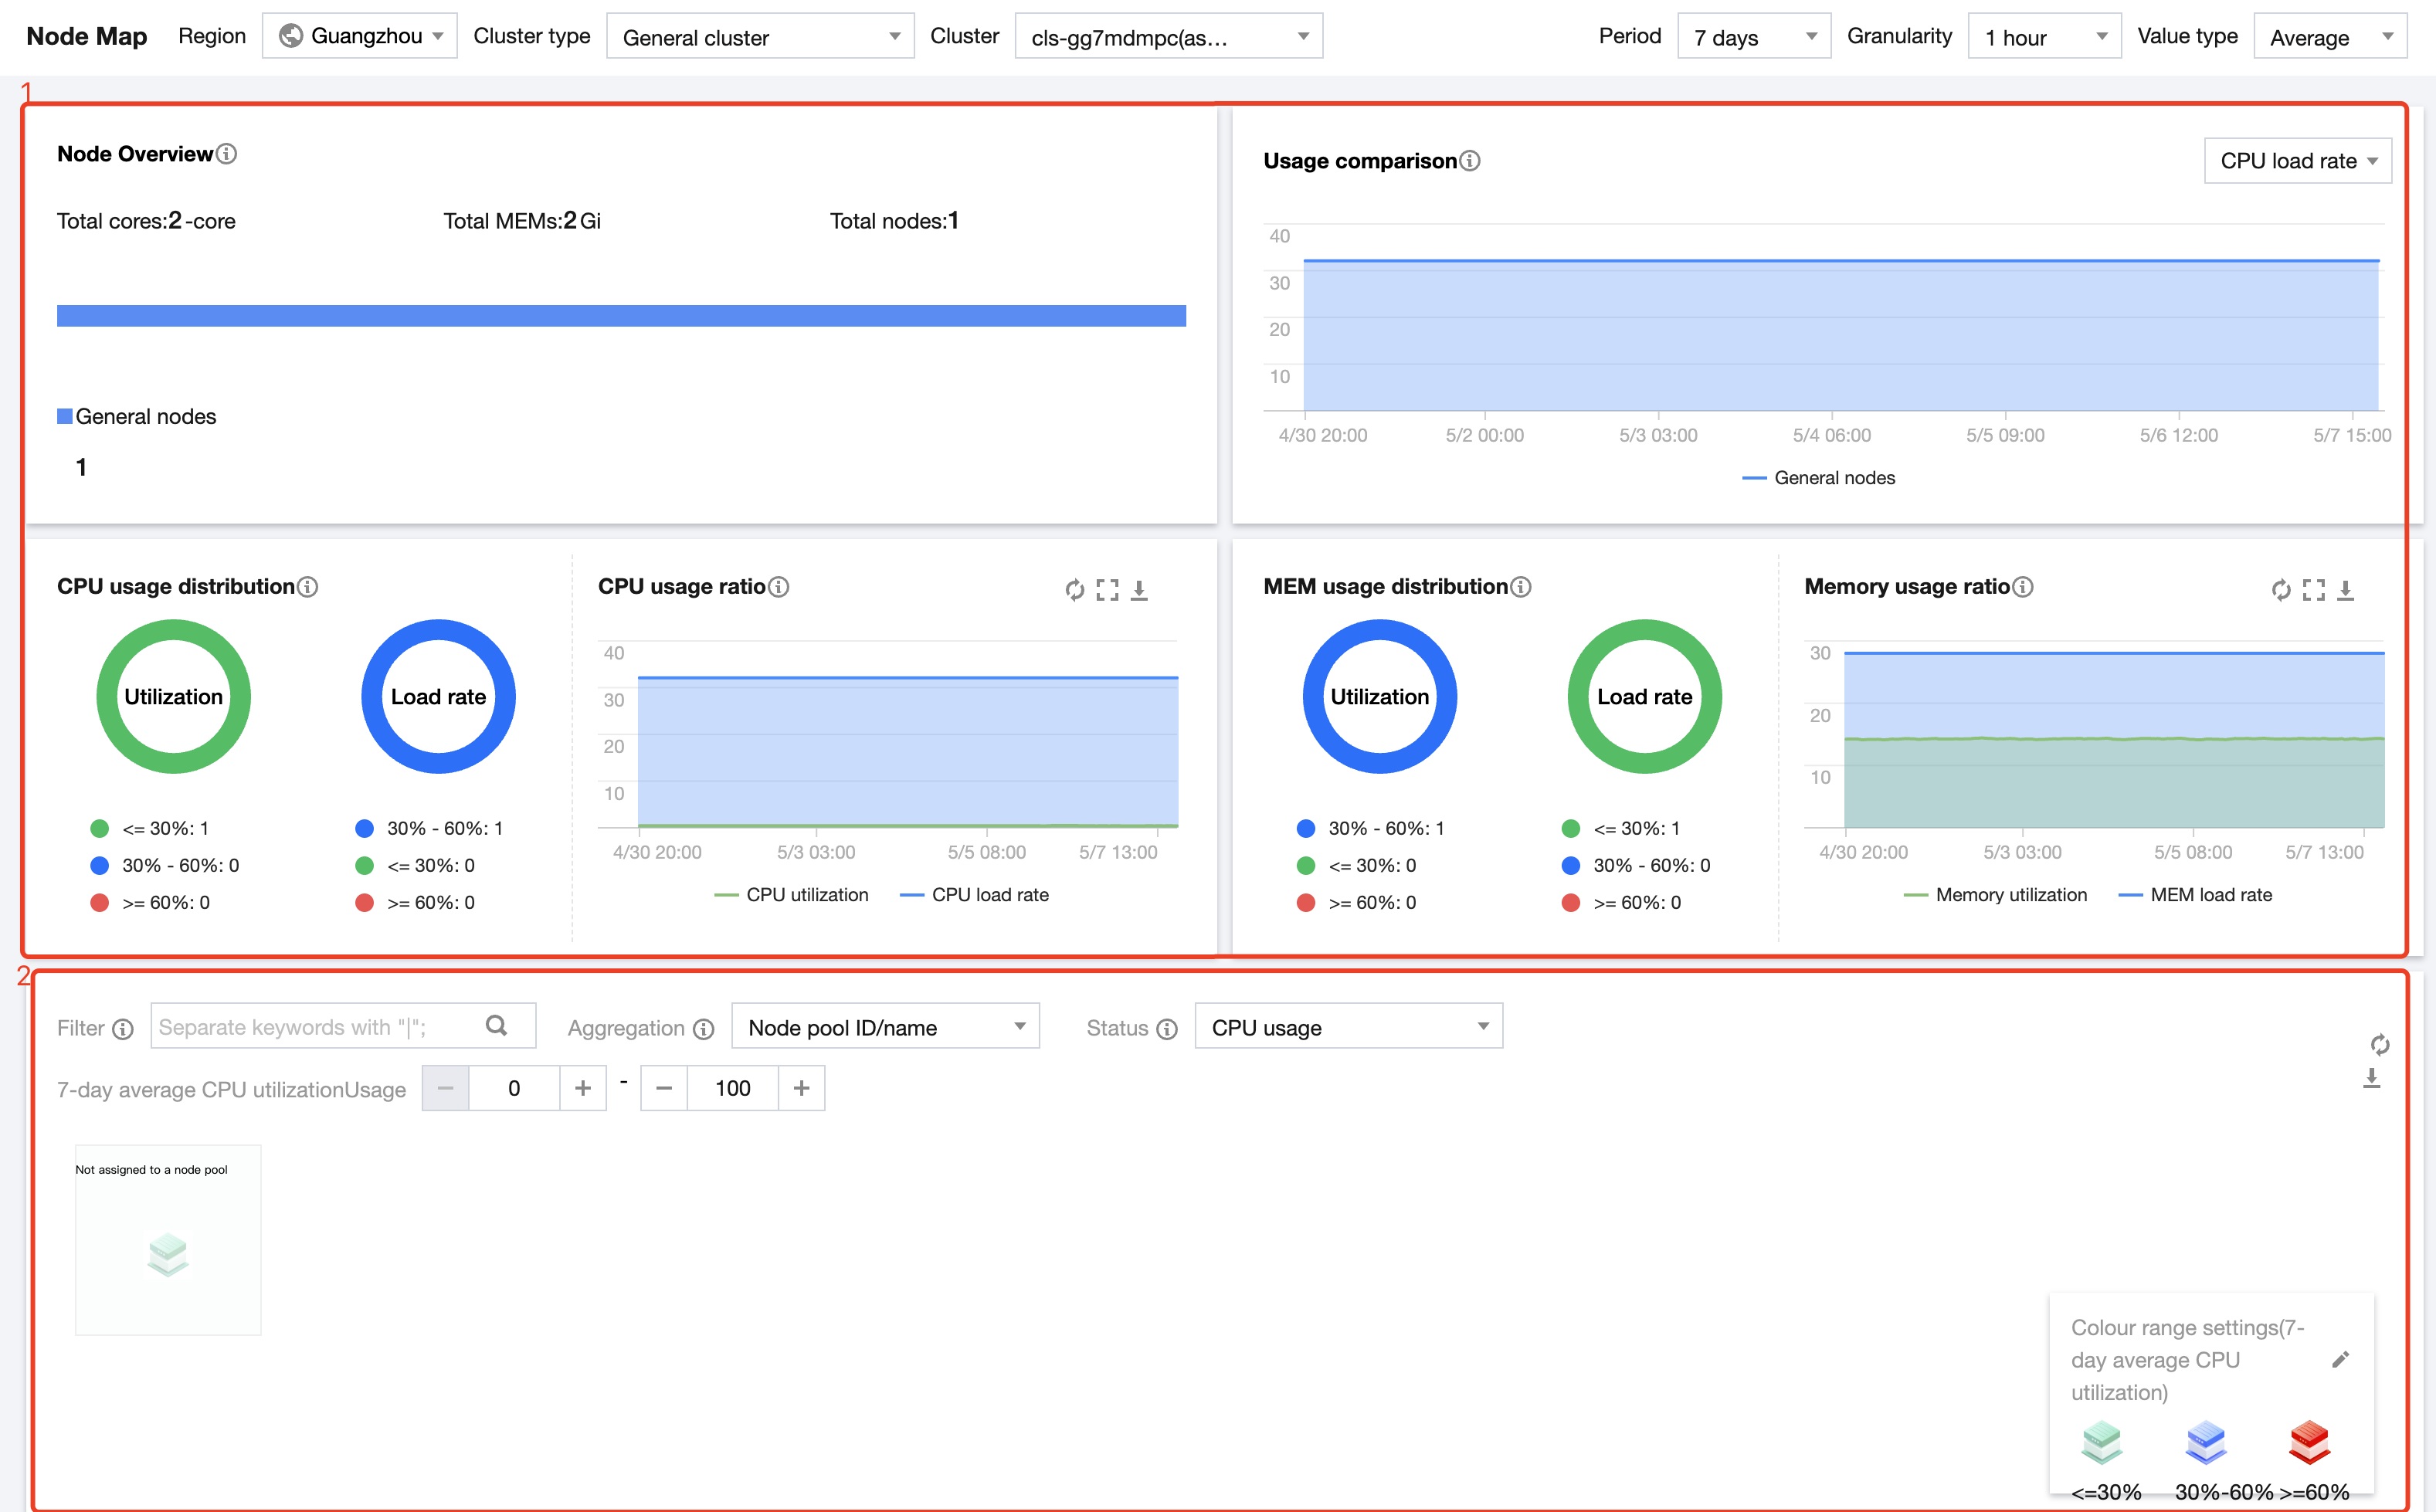
The Node Map page is divided into two parts: Overview and Resource Object Heat Map.
1. The upper part provides an overview of nodes in the cluster.
2. The lower part displays individual node resource objects in the cluster.
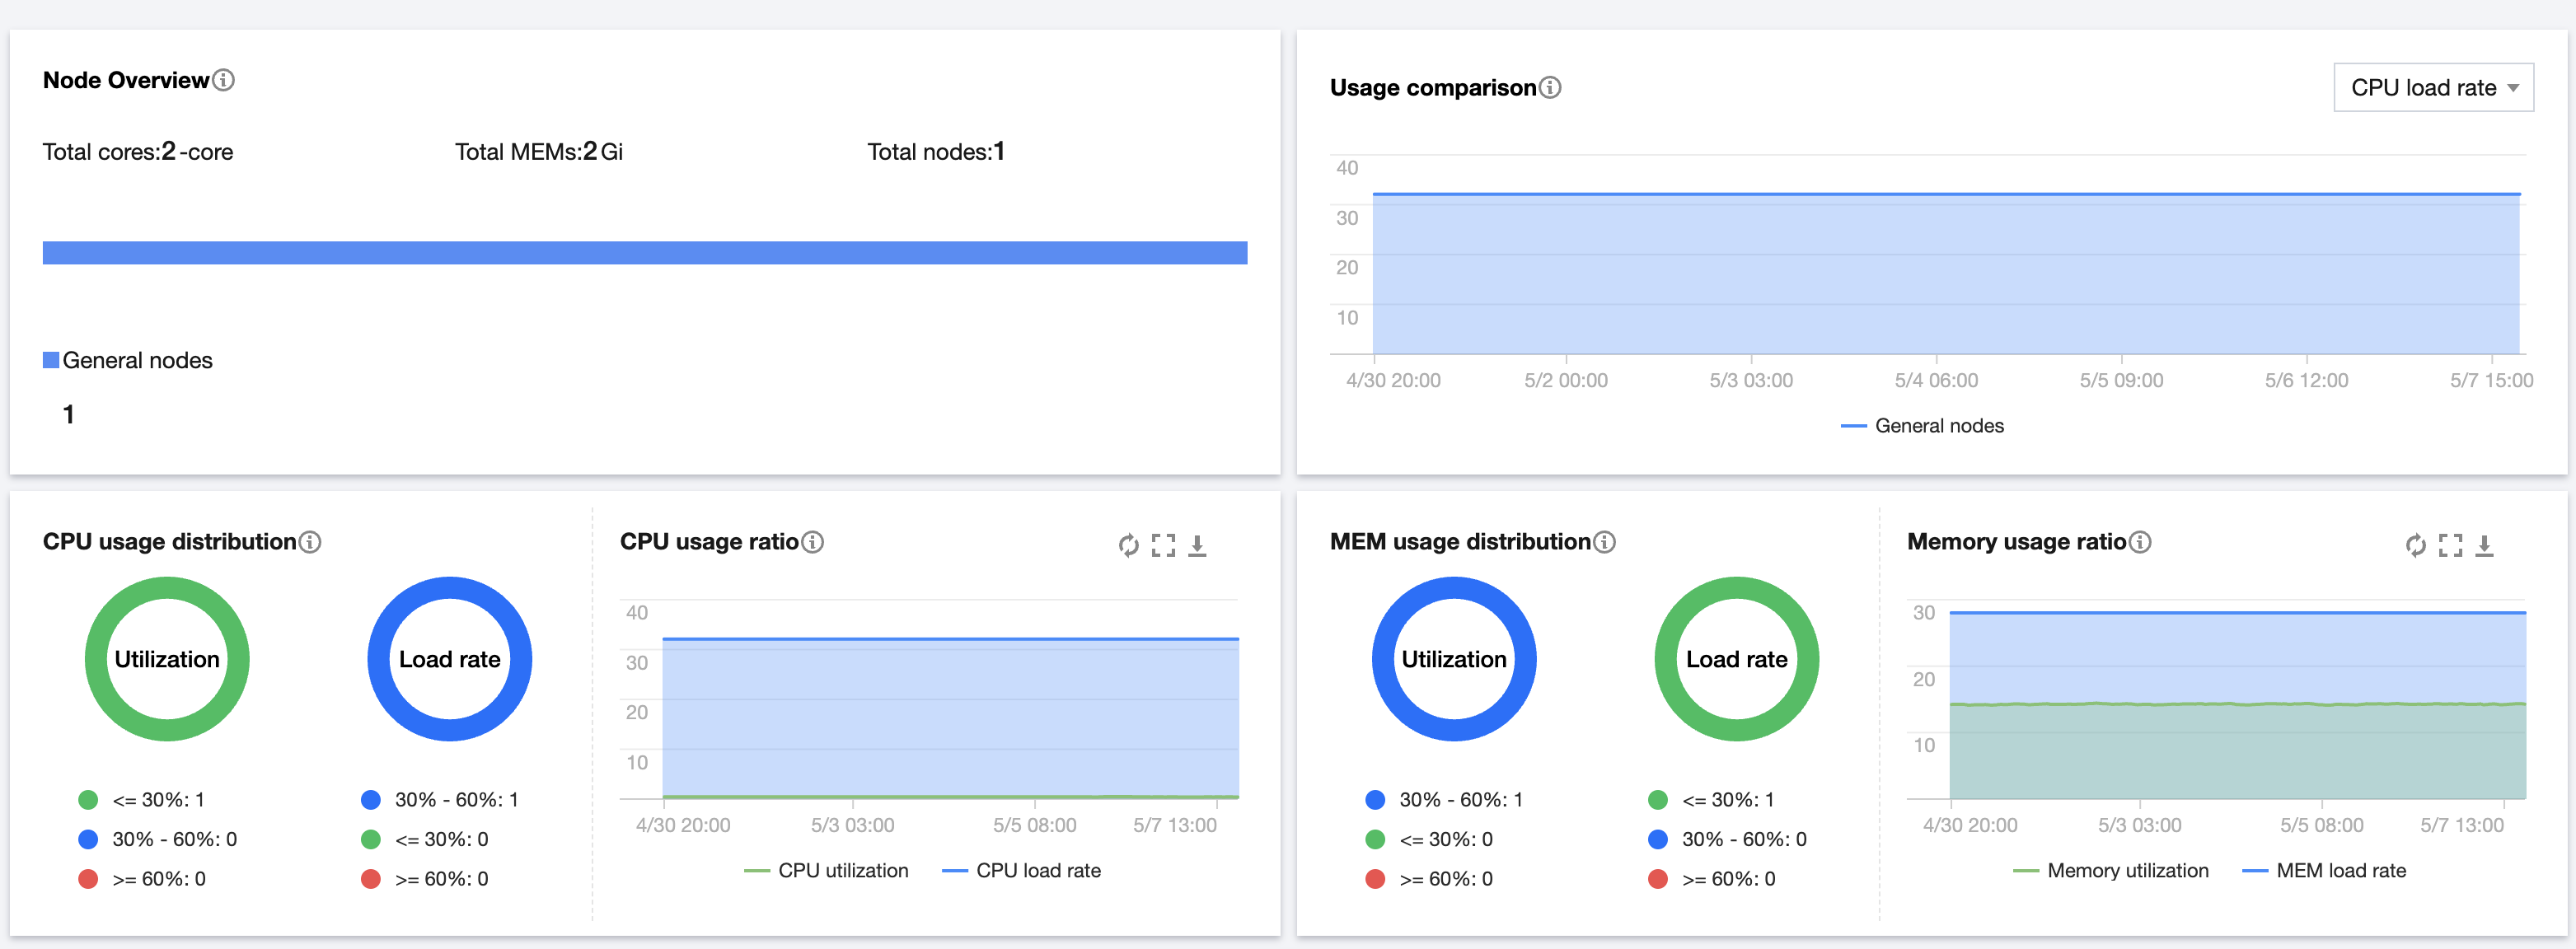
Cluster/Node Overview
The Cluster/Node Overview is as shown below:
Node Overview
Displays the total cores and total memory of nodes in the current cluster.
Displays the number of different types of nodes (native nodes, general nodes, and registered nodes) in the current cluster.
Note:
Super nodes do not conceptually count as nodes, so they are not covered in the statistics.
Node Usage Comparison
Compares the CPU load rate, memory load rate, CPU utilization, and memory utilization among different types of nodes (native nodes, general nodes, and registered nodes).
Node Resource Usage Distribution
Displays the distribution of CPU/memory usage among nodes (native nodes, general nodes, and registered nodes) in the cluster.
Note:
Super nodes do not conceptually count as nodes, so they are not covered in the statistics.
Metric
Description
Remarks
CPU utilization distribution
Shows the distribution of average or peak CPU utilization among nodes (native nodes, general nodes, and registered nodes) in the cluster in the last 24 hours, 7 days, or 30 days (as set in the upper right corner). Displays the number of nodes by the utilization range.
The CPU utilization of a node is defined as the actual CPU resource usage of the node divided by the node specification. Super nodes do not conceptually count as nodes, so they are not covered in the statistics.
CPU load rate distribution
Shows the distribution of average or peak CPU load rates among nodes in the cluster in the last 24 hours, 7 days, or 30 days (as set in the upper right corner). Displays the number of nodes by the load rate range.
The CPU load rate of a node is defined as the sum of CPU requests for all pods on the node divided by the node specification.
Memory utilization distribution
Shows the distribution of average or peak memory utilization among nodes in the cluster in the last 24 hours, 7 days, or 30 days (as set in the upper right corner). Displays the number of nodes by the utilization range.
The memory utilization of a node is defined as the actual memory resource usage of the node divided by the node specification.
Memory load rate distribution
Shows the distribution of average or peak memory load rates among nodes in the cluster in the last 24 hours, 7 days, or 30 days (as set in the upper right corner). Displays the number of nodes by the load rate range.
The memory load rate of a node is defined as the sum of memory requests for all pods on the node divided by the node specification.
CPU usage ratio
Shows the overall trend of CPU load rate and utilization in the cluster based on the period set in the upper right corner.
The utilization statistics covers native nodes, general nodes, registered nodes, and super nodes in the cluster.
The load rate statistics covers native nodes, general nodes, and registered nodes in the cluster. Super nodes are not covered as they do not conceptually count as nodes.
Memory usage ratio
Shows the overall trend of memory load rate and utilization in the cluster based on the period set in the upper right corner.
The utilization statistics covers native nodes, general nodes, registered nodes, and super nodes in the cluster.
The load rate statistics covers native nodes, general nodes, and registered nodes in the cluster. Super nodes are not covered as they do not conceptually count as nodes.
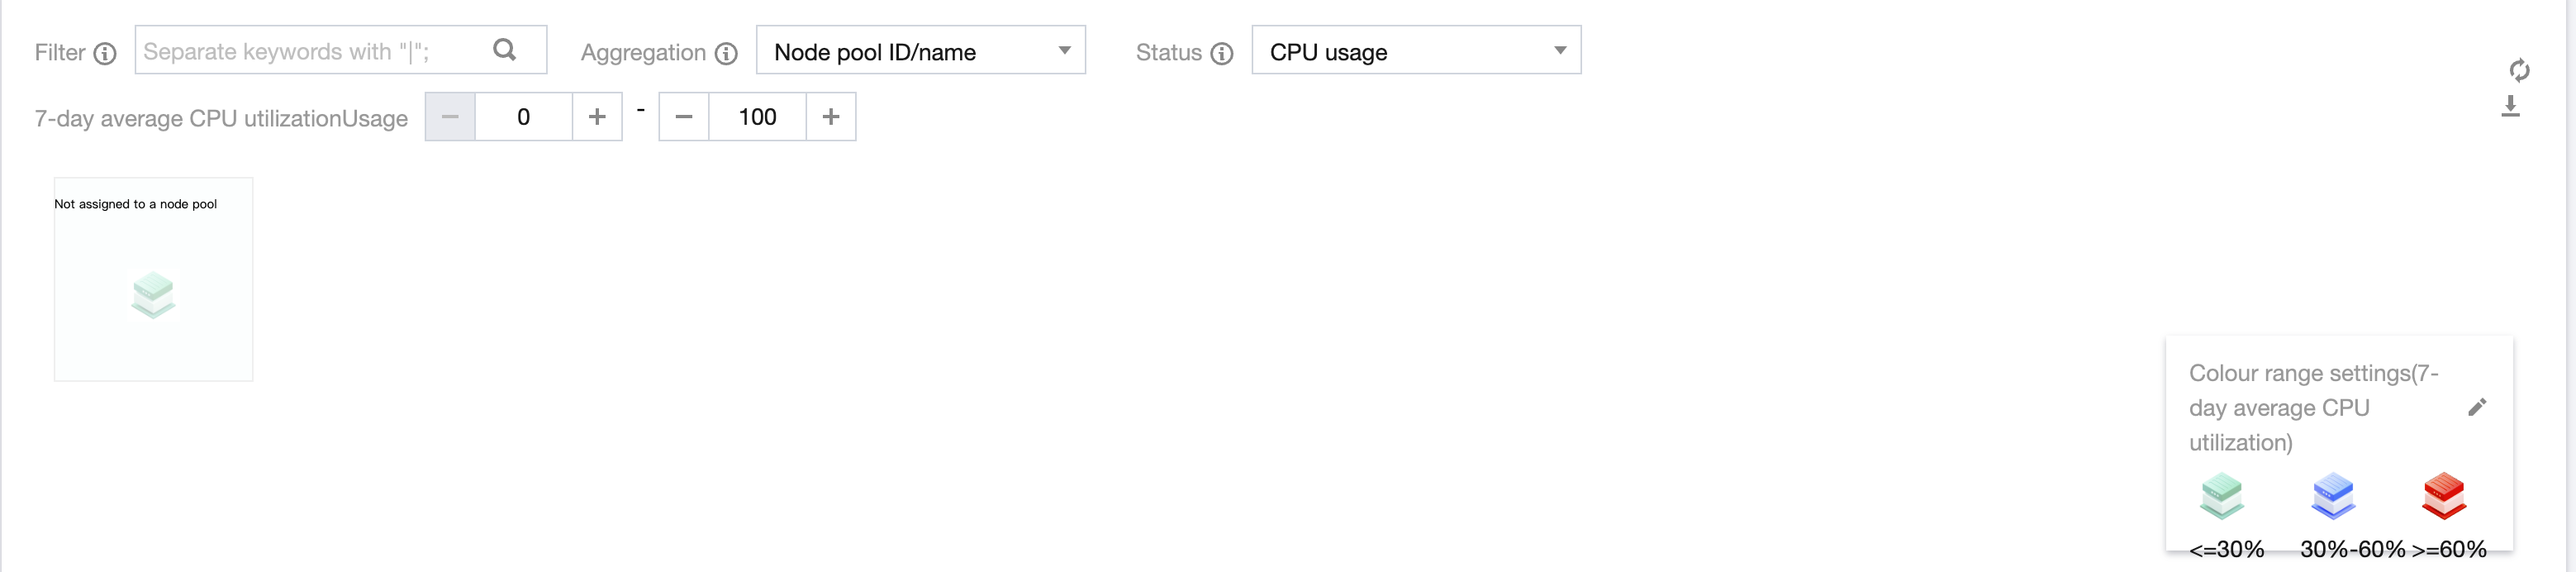
Viewing Node Objects
As shown below, you can filter nodes and aggregate node display by setting the Filter, Aggregation, and Status fields.
Filter: You can filter nodes based on metrics. If you specify no metrics, all nodes are selected by default. You can set multiple attributes, and the nodes meeting all the filter criteria are selected.
Aggregation: Filtered nodes are grouped. Nodes in the same group are shown in the same light-colored box and have the same attribute values.
Status: You can filter nodes by setting Status to CPU utilization, Memory utilization, CPU load rate, or Memory load rate.
CPU utilization: The average or peak node CPU utilization in the last 24 hours, 7 days, or 30 days.
Memory utilization: The average or peak node memory utilization in the last 24 hours, 7 days, or 30 days.
CPU load rate: The average or peak node CPU load rate in the last 24 hours, 7 days, or 30 days.
Memory load rate: The average or peak node memory load rate in the last 24 hours, 7 days, or 30 days.
Note:
In the node object heat map, nodes are by default sorted in ascending order according to the current Status setting. For example, if you set Status to CPU utilization, the nodes in the node heat map are by default arranged in ascending order of their average or peak CPU utilization in a time range (the Period set in the upper right corner).
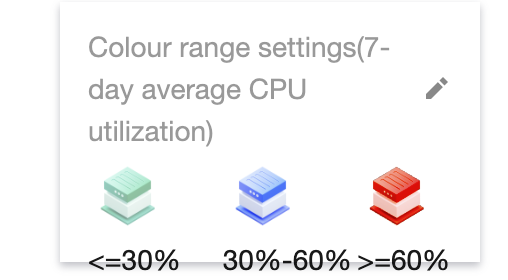
Filtered nodes are distinguished by three colors: green, blue, and red. You can click
in the lower right corner of the page to adjust the threshold ranges for the three statuses, as shown below:
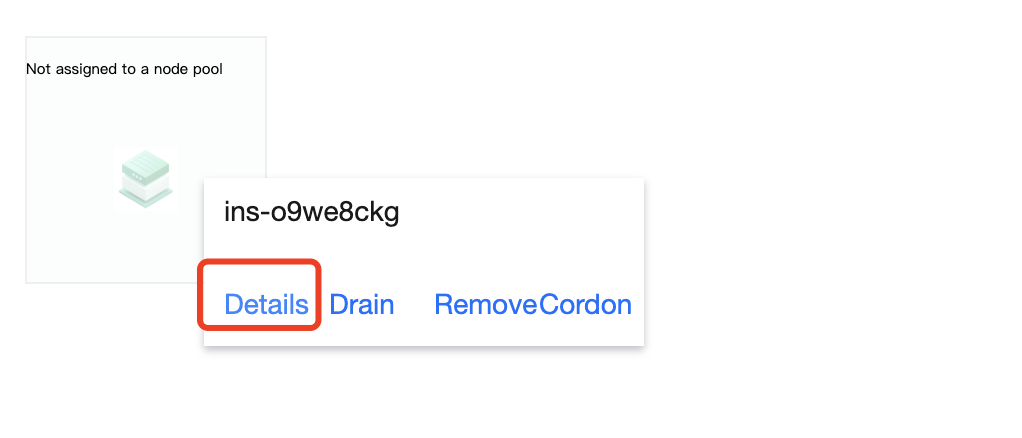
Node Operation
When you hover your mouse over a node object, you can view the details of the node and perform the following operations:
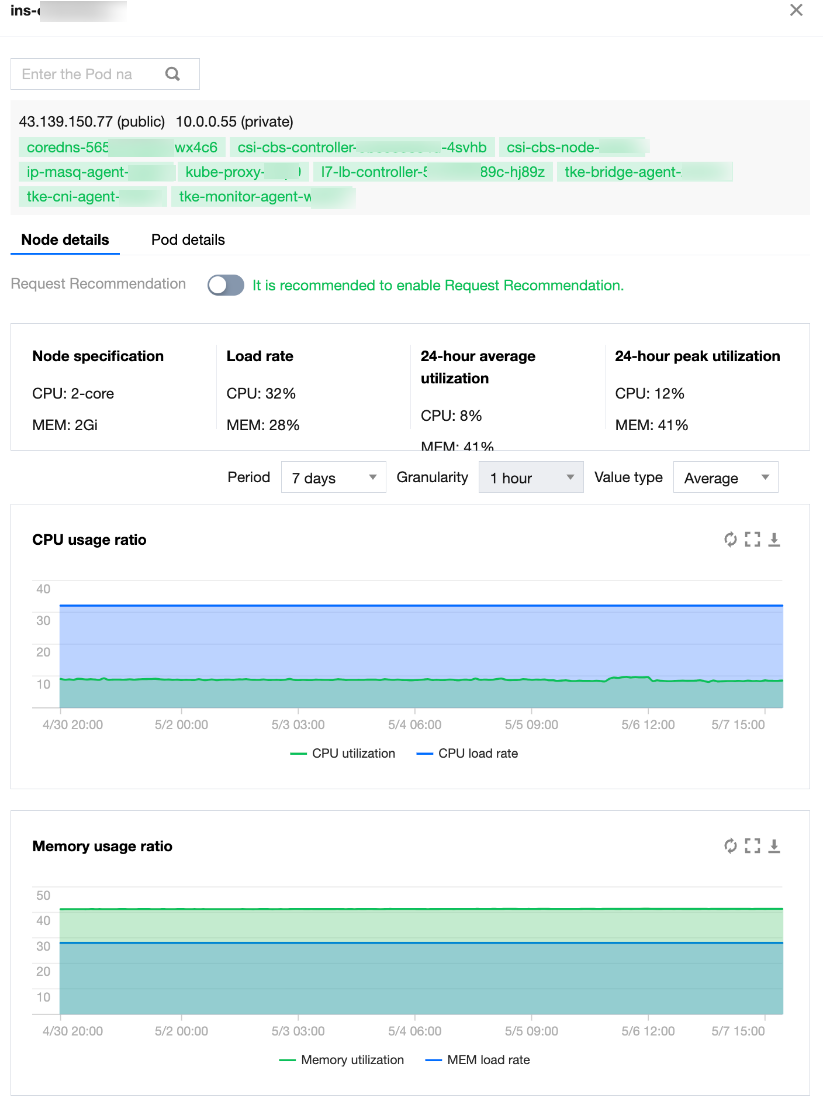
1. Click Details to view the details of the current node, as shown below:
Node Details
Pod Details
Feature Switches
Request Recommendation: A cluster-level feature switch. If the switch is enabled, suitable requests are recommended for workloads based on workload usage. For details, refer to Request Recommendation.
Native Node Dedicated Scheduler: A cluster-level feature switch. If the switch is enabled, the specifications of native nodes can be virtually increased to schedule more pods. For details, refer to Native Node Dedicated Scheduler.
Node Information
Node specification: The CPU and memory capacity of the node.
Load rate: The sum of requests for all pods on the node divided by the node specification (based on the setting in the upper right corner of the page).
24-hour average utilization: Average CPU and memory utilization of the node in the last 24 hours.
24-hour peak utilization: Peak CPU and memory utilization of the node in the last 24 hours.
Node Trend Chart Information
CPU usage ratio:
The trend of the CPU usage ratio of the node in the cluster in the specified period (as set in the upper right corner).
Memory usage ratio:
The trend of the memory usage ratio of the node in the cluster in the specified period (as set in the upper right corner).
CPU Usage Trend Chart
Request: The requested usage of the pod.
Usage: The actual usage of the pod.
Recommendation: The recommended usage of the pod. To receive recommendation, you need to enable Request Recommendation in advance.
Pod Information
Pod name: The name of the pod.
Pod status: The status of the pod.
Workload: The workload to which the current pod belongs.
Request: The text in black indicates the request configuration for the current pod. The text in blue indicates the request recommendation for the current pod, which requires enabling the Request Recommendation Component.
Note:
1. By clicking the request recommendation in blue, you can update the request value of the deployment to which the pod belongs.
2. This one-click update capability is exclusive to native nodes. If some pods of the workload are not on native nodes, you need to migrate the pods to native nodes first. For details, refer to Request Recommendation.
2. Click Drain to drain the pod on the node to another node in the cluster.
3. Click Remove to remove the node from the node pool.
If the node is in a node pool, the current node is managed by the node pool and needs to be processed on the node pool page.
If the node is not in a node pool, the node can be removed from the cluster. If the node is a pay-as-you-go node, it can be canceled when you remove it.
4. Click Decordon to schedule the node for a new pod.
Note:
A node is automatically cordoned once drained. After you click Decordon, the node can continue to be scheduled for a new pod.