Instance Level Monitoring
Download
Focus Mode
Font Size
Feature Overview
The function platform now supports the "instance-level monitoring" feature. Through instance-level metrics, you can view core metric information such as vCPU usage, memory usage, and instance network conditions. This article introduces the use cases, definitions, metric information, and configuration methods of instance-level metrics.
Use Cases
Monitor CPU, memory, and network metrics of a single instance in real-time to accurately diagnose resource usage and identify matching issues between specification and workload.
Continuously track the instance lifecycle status, fully record key events such as startup, destruction, and abnormal exit, and ensure the observability of running health status;
Based on multidimensional data correlation analysis, quickly locate the root cause of failures, effectively distinguish between code defects and environment-related issues, and provide a basis for decision-making for failure recovery;
Instance-Level Monitoring Metric Descriptions
Instance-level metrics are performance metrics at the function instance dimension. They perform real-time monitoring and performance data collection on function instances, provide visual displays, and offer you an end-to-end monitoring and troubleshooting path for function instances.
Instance-level metrics support the following dimensionalities.
Instance dimension: Metrics of a specific certain function instance.
Function dimension or function version / Alias dimension: Refers to the aggregation performed by the function dimension. For example, if there are two instances of Function A executing at the same time, then the vCPU metric in the function dimension is the maximum value of vCPU usage among these two instances (awaiting release).
Metric Meaning | Meaning of Metric | Unit | Dimension |
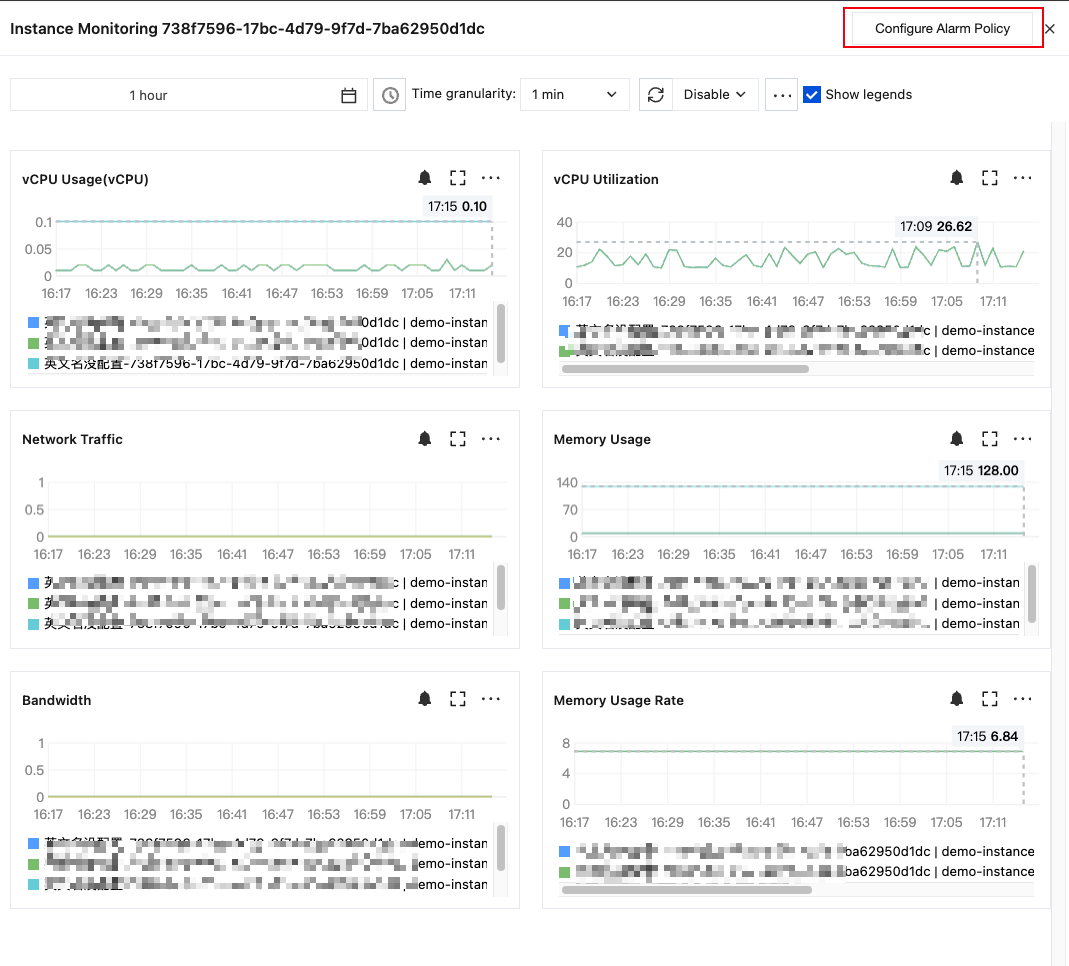
vcpu usage | Instance vCPU consumption. (vCPU quota, maximum vCPU, average vCPU) | vcpu | Instance Dimension |
vcpu utilization | vCPU usage. Represent the actual number of vCPUs in use, which may exceed 100%. (Maximum utilization, Average utilization rate) | % | Instance Dimension |
Memory Usage | Consumed memory of the instance. Unit: MB. (Memory quota, Maximum used memory, Average used memory) | MB | Instance Dimension |
Memory Usage | Memory Utilization Rate. That is, actual consumed memory/total memory (Maximum Utilization Rate, Average Utilization Rate) | % | Instance Dimension |
Network Traffic | Inbound Traffic Traffic received by the cloud function instance since its start-up Outbound Traffic Traffic sent by the cloud function instance since its start-up | KBytes | Instance Dimension |
Bandwidth | Inbound Bandwidth Traffic bandwidth received by the cloud function instance since its start-up Outbound Bandwidth Traffic bandwidth sent by the cloud function instance since its start-up | Mbps | Instance Dimension |
Configure Instance-Level Metrics
1. Log in to the SCF console and select Function Service in the left sidebar.
2. On the list page of "Function Service", enable log delivery when creating/updating a function.

3. Perform code testing, trigger a function call.
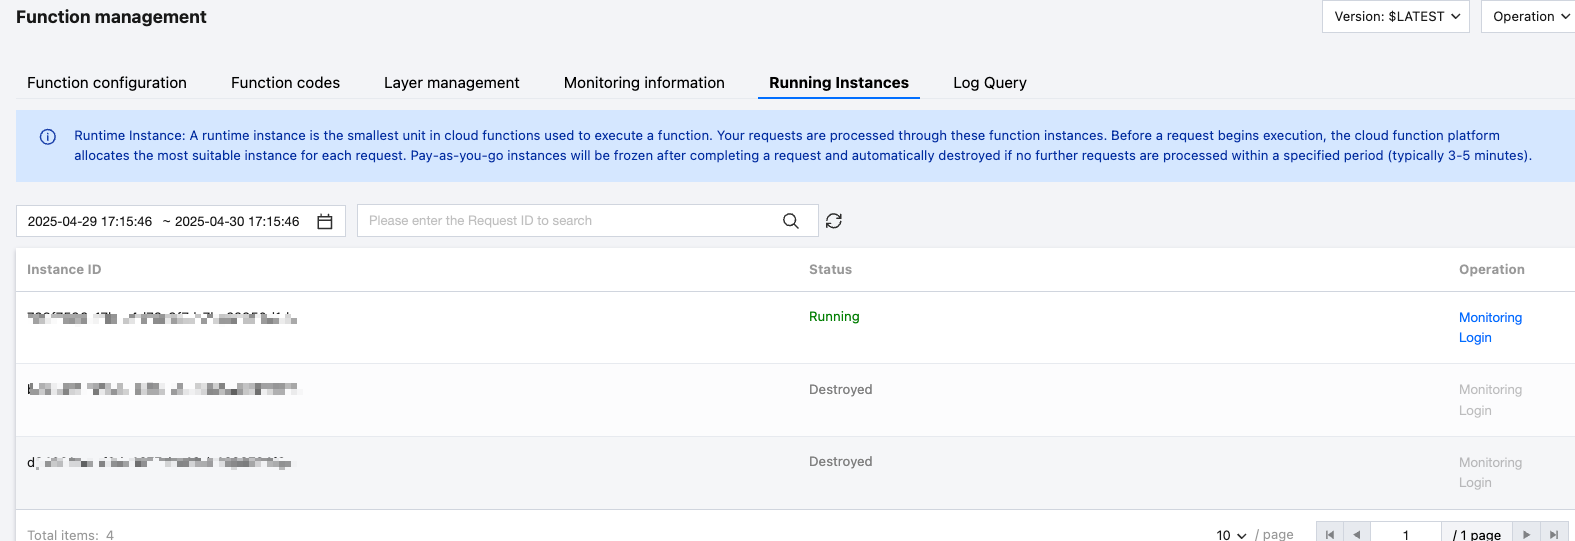
4. On the Function Management page, select Running Instances, click Monitoring.

5. In the pop-up, you can check corresponding monitoring metrics. Click in the upper right corner to configure alarms.

Help and Support
Was this page helpful?
You can also Contact sales or Submit a Ticket for help.
Help us improve! Rate your documentation experience in 5 mins.
Feedback