Viewing Monitoring Data
다운로드
포커스 모드
폰트 크기
TDMQ for CKafka (CKafka) supports daily monitoring of the resource status under your account. You can view the monitoring data of various CKafka resources in real time in the console to understand the cluster health status.
Viewing the Cluster Health Status
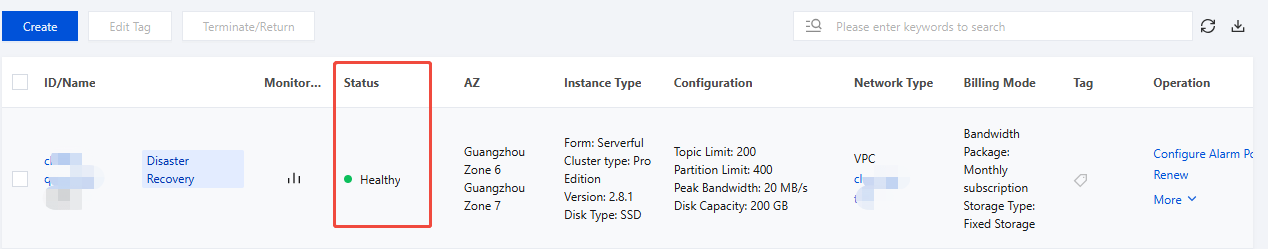
CKafka has an inspection program for each instance. The program monitors the number of connections, disk usage percentage, peak production bandwidth, and peak consumption bandwidth. When these metrics exceed certain thresholds, different health statuses will be displayed. For detailed status descriptions, see Monitoring Metric Details.
1. Log in to the CKafka console.
2. In the left sidebar, click Instance List, select the target region, and view the health status of clusters in the Status column of the cluster list. If the cluster status is abnormal, you can click the tooltip in the Status column to view detailed prompt information.
Viewing Basic Monitoring Metrics
1. Log in to the CKafka console.
2. In the left sidebar, click Instance List, select the target region, and click the target Instance ID/Name to go to the instance details page.
3. On the instance details page, click Monitoring at the top. Select the target resource tab, set the time range, and view the instance monitoring data.
Supported resource dimensions: instances, topics (click the drop-down list of the partition to specify a partition and view the monitoring data of the corresponding partition), and consumer groups. For detailed metric descriptions, see Monitoring Metric Details.
Viewing Advanced Monitoring Metrics (Pro Edition)
1. Log in to the CKafka console.
2. In the left sidebar, click Instance List, select the target region, and click the target Instance ID/Name to go to the instance details page.
3. On the instance details page, click Advanced Monitoring at the top to view the broker status, cluster load status, and core advanced metrics.
Broker Status: Display the liveness rate of broker nodes.
Cluster load: Indicate the overall load status of the cluster, the maximum value among all nodes is taken. When the load is excessively high, it is recommended to promptly upgrade the cluster bandwidth specification. For details, see Use Cases of Cluster Capacity Planning.
Advanced metrics: Support five dimensions, including core services, production, consumption, instance resources, and broker GC. For detailed metric descriptions, see Monitoring Metric Details.
Viewing a Dashboard (Pro Edition)
1. Log in to the CKafka console.
2. In the left sidebar, click Instance List, select the target region, and click the target Instance ID/Name to go to the instance details page.
3. On the instance details page, click Dashboard at the top, set the time range, and view the relevant ranking information.
Chart Viewing Description
For each monitoring image provided by CKafka, you can perform the following operations:
Operation | Icon | Description |
Viewing data | 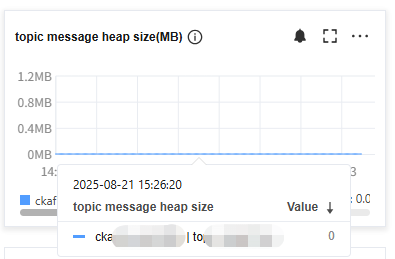 | Hover the mouse pointer over the image to view the data details at the corresponding time point. |
Configuring an alarm |  | You can click the icon to redirect to Tencent Cloud Observability Platform (TCOP) to configure alarm rules for the current monitoring metric. For specific operations, see Configuring an Alarm Policy. |
Displaying in full screen |  | You can click the icon to view the corresponding chart in full screen. Press Esc or the close icon (X) in the upper-right corner to exit the full-screen mode. |
Exporting data |  | You can click the icon to export chart data as a CSV file or as a PNG image. |
Time Picker Description
You can flexibly control data display through the following features: freely select time ranges, quickly compare year-over-year and month-over-month data, adjust time granularity and refresh frequency, and save charts to the dashboard with one click.
Operation | Icon | Description |
Selecting a time range | 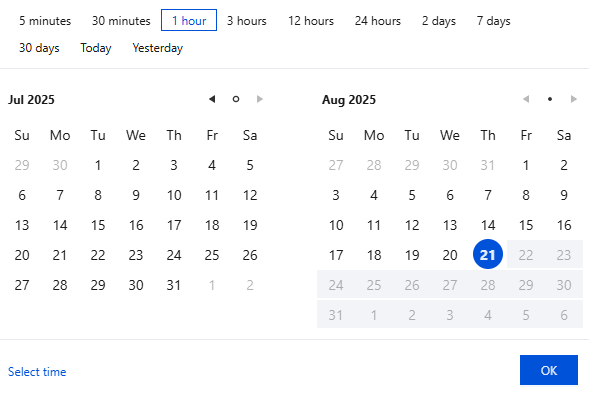 | You can click the time selection box to select a time range for the display of the monitoring data chart. By default, the last hour is selected for data display. You can quickly select a specified time range through the top time values. You can select a wide time range through the calendar. You can click Select Time in the lower-left corner to further select a time range accurate to seconds. |
Comparing time |  | You can click the week-on-week and day-on-day comparison icon to select week-on-week (same period last week), day-on-day (same period yesterday), or a custom date range to compare changes in the cluster status across different time periods. |
Setting the time granularity | 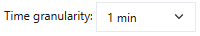 | You can click Time Granularity to set time granularity to 1 hour or 1 day. |
Setting the refresh interval |  | You can click the refresh icon on the left side to update the chart or click the drop-down menu on the right side to select an auto refresh interval for the entire chart. You can set the interval to 30 seconds, 5 minutes, 30 minutes, or 1 hour, or disable it. |
Replicating a chart to the dashboard |  | You can click the icon to replicate a chart to the dashboard. For more information about the dashboard, see What Is a Dashboard. |
Displaying the legend |  | You can check this box to display legend information in the chart. |
피드백