TDMQ for CKafka provides multiple monitoring metrics for running resources to monitor the running statuses of clusters. It also offers the alarm configuration feature for key metrics. You can configure alarm rules for monitoring metrics. Based on the created alarm rules, the system compares the monitoring metrics against the specified thresholds over a certain period. If a monitoring metric reaches the preset alarm threshold, Tencent Cloud Observability Platform (TCOP) will notify you through emails, Short Message Service (SMS) messages, WeChat messages, or phone calls. This allows you to take preventive or remedial actions in time. Proper configuration of alarm rules can help you enhance application robustness and reliability.
Recommended Key Monitoring Metrics and Alarm Policies
The following are recommended key monitoring metrics and alarm configuration recommendations for using CKafka. It is recommended that you reasonably configure monitoring and alarm policies based on your actual business scenarios to ensure comprehensive monitoring that covers both resource bottlenecks and potential business risks.
Note:
When you create an instance, the system creates a default alarm policy for the instance based on the default preset template and notifies the alarm recipients specified in the template. Typically, the alarm recipient in a preset template is the root account owner. If you need to notify the instance owner or other personnel, configure custom alarm rules and notification recipients.
Note:
Explanation of the recommended attention levels for monitoring metrics:
P0 (default alarm): A default alarm policy is created in Cloud Monitor for metrics of this type. After you create an instance, TCOP enables these metrics by default to prevent exceptions caused by burst traffic or by hitting the specification limit. You can view the details of the enabled metrics in Alarm Policy Overview.
P1 (recommended alarm): For metrics of this type, it is recommended to enable alarm configuration. You can manually enable alarm configuration in TCOP to promptly understand and handle production/consumption exceptions in your cluster, preventing impact on your business.
Basic Monitoring - P0
Advanced Monitoring - P0 (Pro Edition Only)
Metric Name
Unit
Recommended Attention Level
Recommended Alarm Configuration
Description
Alarm Handling Recommendation
produce_bandwidth_percentage (instance)
%
P0 (default alarm)
The statistical period is 1 minute. If the value exceeds 80% for 5 consecutive periods, an alarm will be triggered once every 10 minutes.
The percentage of the instance production bandwidth quota used. A high percentage may lead to traffic throttling or delays for the producer, affecting real-time delivery of messages.
The statistical period is 1 minute. If the value exceeds 80% for 5 consecutive periods, an alarm will be triggered once every 30 minutes.
The number of connections between clients and servers. This metric reflects cluster stability and performance.
It is recommended to optimize the number of clients. If the utilization consistently exceeds 80%, submit a ticket to apply for a quota increase. Reserve 20% buffer space for the number of connections.
instance disk usage
%
P0 (default alarm)
The statistical period is 1 minute. If the value exceeds 80% for 5 consecutive periods, an alarm will be triggered once every 30 minutes.
Disk utilization represents the average disk utilization across all nodes in the cluster. Excessively high disk utilization will result in insufficient disk space on nodes to accommodate allocated resources, preventing messages from being persisted to disks.
It is recommended to clean up data or scale out the cluster when the average disk utilization exceeds 75%, or configure a disk watermark adjustment policy to prevent impacts on normal business operations.
Metric Name
Unit
Recommended Attention Level
Recommended Alarm Configuration
Description
Handling Recommendation
zookeeper disconnects count
Count
P0 (default alarm)
The statistical period is 1 minute. If the value exceeds 3 for 5 consecutive periods, an alarm will be triggered once every 30 minutes.
The number of times the persistent connection between the broker and ZooKeeper disconnects and reconnects. Network fluctuations or high cluster load may cause disconnections and reconnections, which can trigger a leader switch when they occur.
There is no normal value range. This value is cumulative. It increments by 1 after each disconnection since broker startup and is reset to 0 only when the broker restarts.
The number of ZooKeeper disconnections is cumulative. A high value does not necessarily indicate a cluster issue. Monitor the frequency of ZooKeeper disconnections. If they occur frequently, further troubleshooting is required.
Check in the console whether the cluster load exceeds 80%. If the threshold is exceeded, you can upgrade the bandwidth specifications of the cluster. For specific operations, see Changing Instance Specifications.
ISR expand count
Count
P0 (default alarm)
The statistical period is 1 minute. If the value exceeds 10 for 5 consecutive periods, an alarm will be triggered once every 30 minutes.
There is no normal value range. Expansions may occur when the cluster experiences fluctuations.
Infrequent fluctuations (for example, less than 3 times per hour) require no intervention. If the value persistently increases, troubleshooting is required.
It is recommended to maintain the cluster load level below 80%. If the threshold is exceeded, upgrade the specifications. For specific operations, see Changing Instance Specifications.
If the cluster load level is normal, clients can optimize producer parameters by setting linger.ms to a non-zero value and ack to 1. This ensures throughput while reducing synchronization pressure on the cluster.
If ISR issues frequently occur, affecting production or consumption, and the situation does not recover for an extended period, contact us.
ISR shrink count
Count
P0 (default alarm)
The statistical period is 1 minute. If the value exceeds 3 for 5 consecutive periods, an alarm will be triggered once every 30 minutes.
There is no normal value range. Shrinkings may occur when the cluster experiences fluctuations.
Instantaneous fluctuations have no impact. If they occur frequently over an extended period, a check is required.
It is recommended to maintain the cluster load level below 80%. If the threshold is exceeded, upgrade the specifications.
If the cluster load level is normal, it is recommended to perform manual partition balancing for high-load partitions.
For messages with keys, ensure balanced writes by setting a partition policy.
If a single partition becomes a bottleneck, increase the number of partitions to improve write parallelism.
under AR replica
Count
P0 (default alarm)
The statistical period is 1 minute. If the value exceeds 3 for 5 consecutive periods, an alarm will be triggered once every 30 minutes.
To ensure your instance runs normally, CKafka sets up certain built-in topics. These topics may be offline under certain circumstances, but are counted in the number of OSRs, which does not affect your business operations.
Under normal circumstances, the number of OSRs should be below 5. If the value remains above 5 for an extended period, it indicates that intervention is required.
Occasional broker fluctuations, where the curve value spikes and then returns to normal after a period, are normal phenomena.
When an instance has OSRs, it is usually due to broker node exceptions or network factors. Check the broker logs for troubleshooting.
Node exceptions
Count
P0 (default alarm)
The statistical period is 1 minute. If the value exceeds 3 for 5 consecutive periods, an alarm will be triggered once every 30 minutes.
The raw metrics for node exceptions originate from broker metrics. If the metrics of the current node are empty, the node is considered abnormal.
Common scenarios involve underlying nodes being abnormal and not responding to network requests.
If node exceptions frequently occur, continuously affecting production or consumption, and the situation does not recover for an extended period, contact us.
Basic Monitoring - P1
Advanced Monitoring - P1
Metric Name
Unit
Recommended Attention Level
Recommended Alarm Configuration
Description
Alarm Handling Recommendation
instance_max_producer_flow
MB/s
P1 (recommended alarm)
Configure an alarm policy based on the purchased specifications. Recommended threshold: Bandwidth specification x 80%. The statistical period is 1 minute. If the value exceeds the threshold for 5 consecutive periods, an alarm will be triggered once every 30 minutes.
The peak bandwidth of production messages for a single replica of the instance. This metric reflects business throughput and indicates bandwidth costs. Exceeding the purchased specifications may lead to traffic throttling, and adjustments should be made promptly.
Configure an alarm policy based on the purchased specifications. Recommended threshold: Bandwidth specification x 80%. The statistical period is 1 minute. If the value exceeds the threshold for 5 consecutive periods, an alarm will be triggered once every 30 minutes.
The peak consumption bandwidth for the instance. This metric reflects the processing capability of the consumer. Exceeding the purchased specifications may lead to traffic throttling, and adjustments should be made promptly.
Configure an alarm policy based on the actual business specifications. Recommended threshold: Disk capacity/Average message size x 60%. The statistical period is 1 minute. If the value exceeds the threshold for 5 consecutive periods, an alarm will be triggered once every 30 minutes.
Total number of messages persisted to disks for an instance (excluding replicas). If the value is too high, it may indicate insufficient consumer processing capacity. Optimize the consumer processing speed or expand the disk capacity.
Configure an alarm policy based on the purchased specifications. Recommended threshold: Topic bandwidth specification x 80%. The statistical period is 1 minute. If the value exceeds the threshold for 5 consecutive periods, an alarm will be triggered once every 30 minutes.
The maximum production traffic of a topic per unit time (excluding the traffic generated by replicas).
A high value may trigger production traffic throttling. You need to monitor peak values. If the value is excessively high, consider configuring traffic throttling rules for the current topic.
max_consume_flow(topic)
MB/s
P1 (recommended alarm)
Configure an alarm policy based on the purchased specifications. Recommended threshold: Topic bandwidth specification x 80%. The statistical period is 1 minute. If the value exceeds the threshold for 5 consecutive periods, an alarm will be triggered once every 30 minutes.
The maximum consumption traffic of a topic per unit time (excluding the traffic generated by replicas).
Configure an alarm policy based on the actual business specifications. Recommended threshold: Disk capacity/Number of topics/Average message size x 60%. The statistical period is 1 minute. If the value exceeds the threshold for 5 consecutive periods, an alarm will be triggered once every 30 minutes.
Total number of messages persisted to disks for a topic (excluding replicas). Continuous increase may indicate insufficient consumption capacity for the subscribed topic. Check the consumer group status or reduce the message retention period.
It is recommended to troubleshoot and adjust consumer parameters to improve throughput, or adjust the advanced parameters of the topic, dynamically set the message retention period, and evaluate increasing the number of partitions to enhance parallel consumption capability.
Metric Name
Unit
Recommended Attention Level
Recommended Alarm Configuration
Description
Alarm Handling Recommendation
Live Broker Nodes
%
P1 (recommended alarm)
The statistical period is 1 minute. If the value is less than 100% for 5 consecutive periods, an alarm will be triggered once every 30 minutes.
The service status of each broker node. This metric allows you to monitor node availability through the heartbeat mechanism.
If the node liveness rate is below the normal value, namely, a broker is down, it will trigger ISR shrinking.
Alarm and default alarm policy will be available soon.
When the node status is abnormal, it is recommended to immediately restart the faulty node and check the system resource usage.
The statistical period is 1 minute. If the value exceeds 80% for 5 consecutive periods, an alarm will be triggered once every 30 minutes.
Cluster overall load, which is the maximum value among all nodes.
For single-AZ deployment, the cluster load should be less than 70%. For a two-AZ deployment, the normal cluster load should be less than 35%. For a three-AZ deployment, the normal cluster load should be less than 47%.
If the bandwidth utilization is low but the cluster load is high, it is necessary to scale out the cluster bandwidth based on cluster load metrics.
Alarm and default alarm policy will be available soon.
It is recommended to promptly upgrade the cluster bandwidth specification when the load is excessively high. For more information, see Use Cases of Cluster Capacity Planning.
Managing Default Alarm Policies
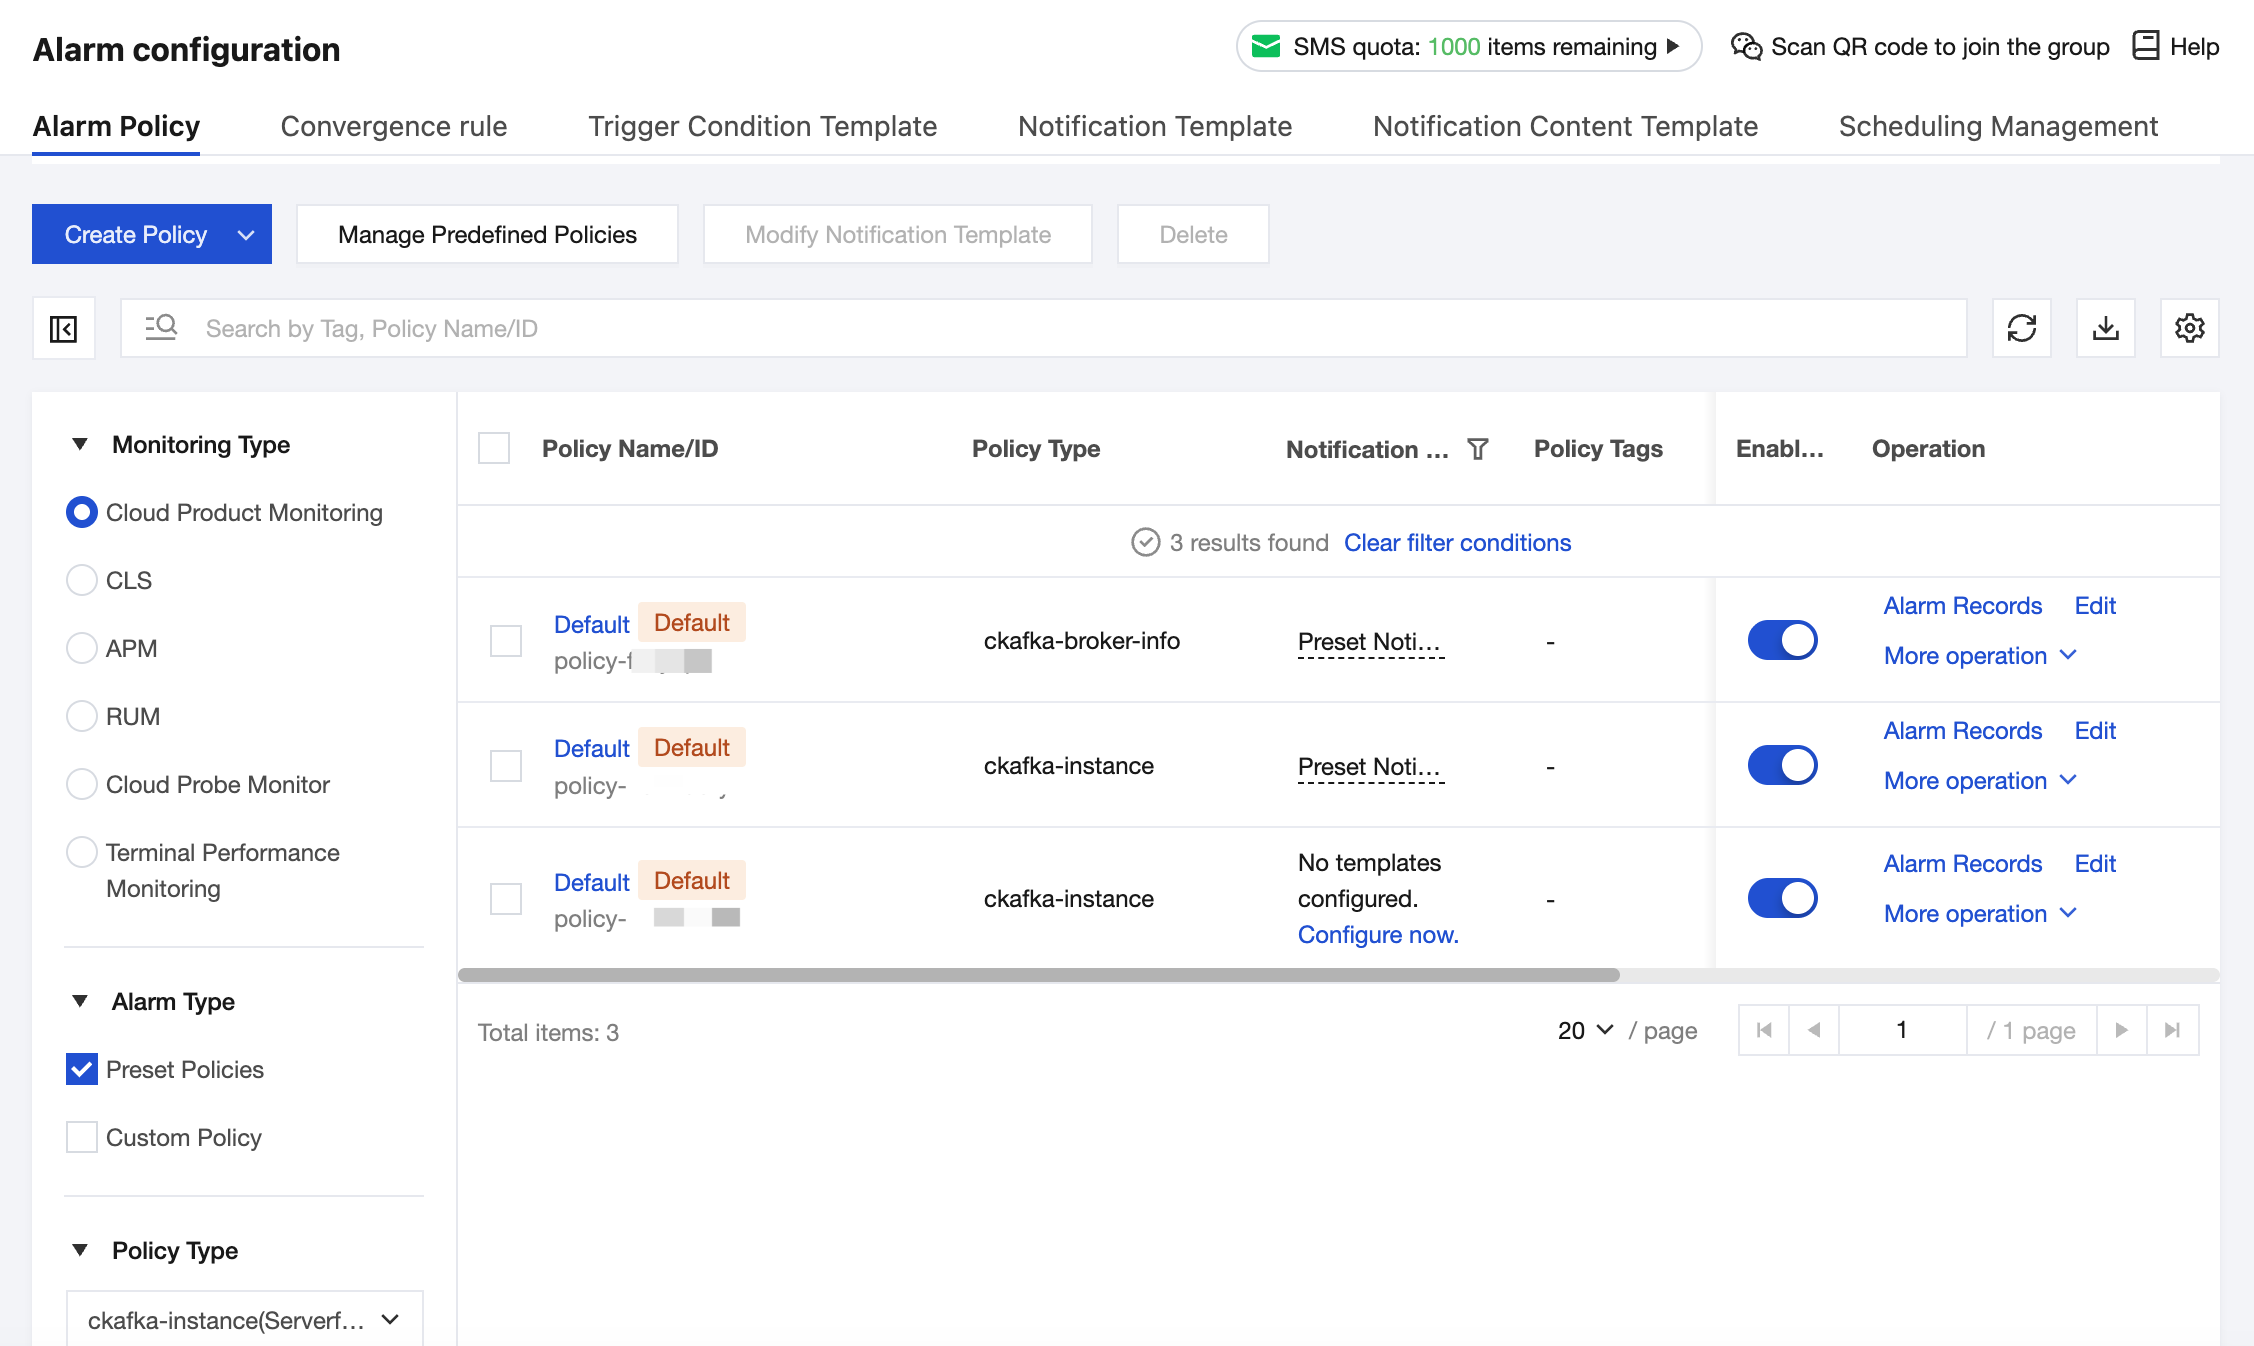
Based on the above recommended attention levels, CKafka has preset multi-dimensional default alarm policies. You can view and modify these default policies on TCOP, or set custom policies based on your business needs to quickly enable alarm monitoring for instances.
2. In the left sidebar, choose Alarm Management > Alarm Configuration. In the Policy Type section on the left side of the Alarm Policy page, select ckafka to view the default policies and custom policies under the instance.
3. Select Alarm Type on the left side of the page to view the preset policies and custom policies under the category.
To ensure that the exceptions of your instances can be detected in a timely manner, the default policies are enabled by default when you create an instance. You can click Edit in the Operation column corresponding to an alarm policy to view or modify the alarm policy. You can also click Enable or Disable to change the effective status of a policy. For details, see Alarm Policy Overview.
4. You can also click Create Policy in the upper-left corner to create a custom policy. For detailed operations and descriptions, see Creating an Alarm Policy.
Configuring a Custom Alarm Policy
Step 1: Going to the Alarm Configuration Page
CKafka provides three different entries for configuring alarm rules: configuring alarm rules from the instance list, configuring alarm rules on the monitoring page, and configuring alarm rules in TCOP.
Entry 1: Log in to the CKafka console. Go to the Instance List page, and click Configure Alarm in the Operation column of the target instance. This will redirect you to the Alarm Configuration page, where the alarm target defaults to the current instance and the alarm policy defaults to the pre-configured policy.
Entry 2: Log in to the CKafka console. Go to the Instance List page, click the ID of the target instance. On the details page, select the Monitoring tab, then click alarm configuration in the upper-right corner of the monitoring chart. This will redirect you to the Alarm Configuration page, where the alarm target defaults to the current instance and the alarm metric corresponds to the monitoring metric displayed in the chart before redirection.
Entry 3: Log in to the TCOP console. On the Alarm Configuration page, you can view all preset policies and custom policies. Click Create Policy, select Cloud Product Monitoring for Monitoring Type, and then select ckafka for Policy Type.
Step 2: Configuring Alarm Rules
1. After you go to the alarm policy configuration page, select the object for which you want to set alarms.
Tag: You can filter resources for which you want to configure alarm policies in batches based on tags.
Alarm Object: Select the CKafka resources for which you want to configure the alarm policy.
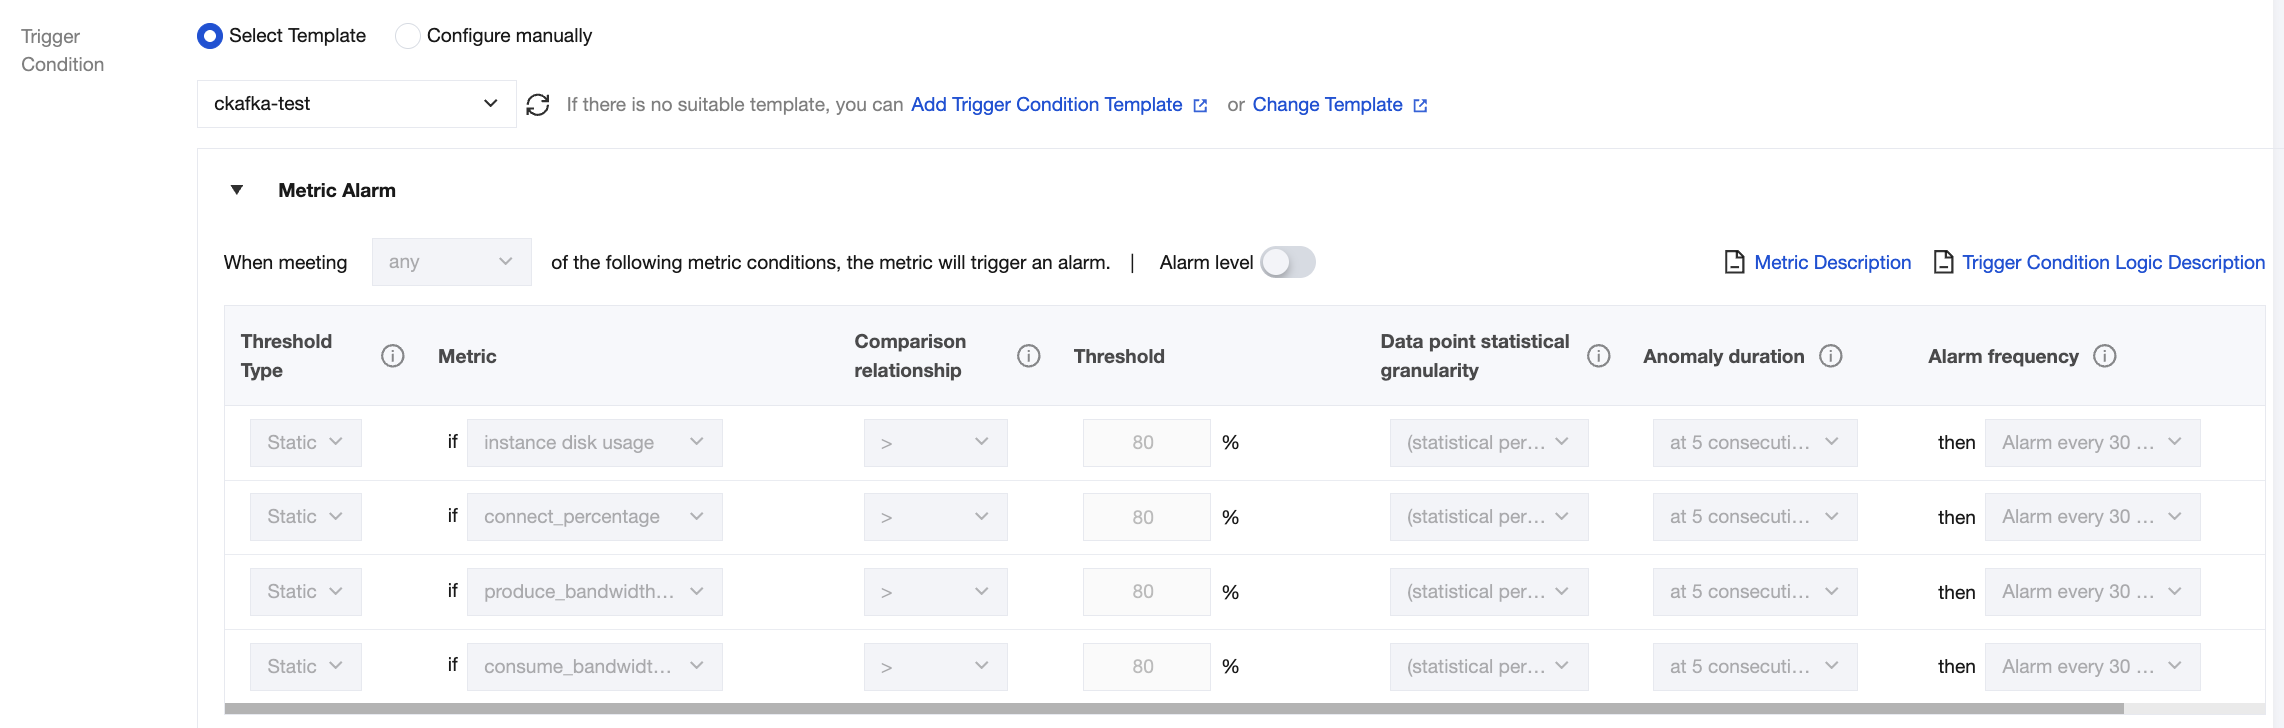
2. Set alarm trigger conditions. Select Template and Configure Manually are supported. By default, Configure Manually is selected.
Configure Manually
Select Template
Metric: Take the instance disk usage as an example. Set the statistical granularity to 1 minute. If the value of disk usage percentage exceeds the threshold for N consecutive data points within 1 minute, an alarm will be triggered.
Alarm frequency: For example, "Alarm every 30 minutes" indicates that an alarm is triggered once every 30 minutes if a metric exceeds the threshold in multiple consecutive statistical periods. Another alarm will be triggered only if the metric exceeds the threshold again in the next 30 minutes.
1. Select Select Template. Then, click Add Trigger Condition Template to redirect to the trigger condition template setup page.
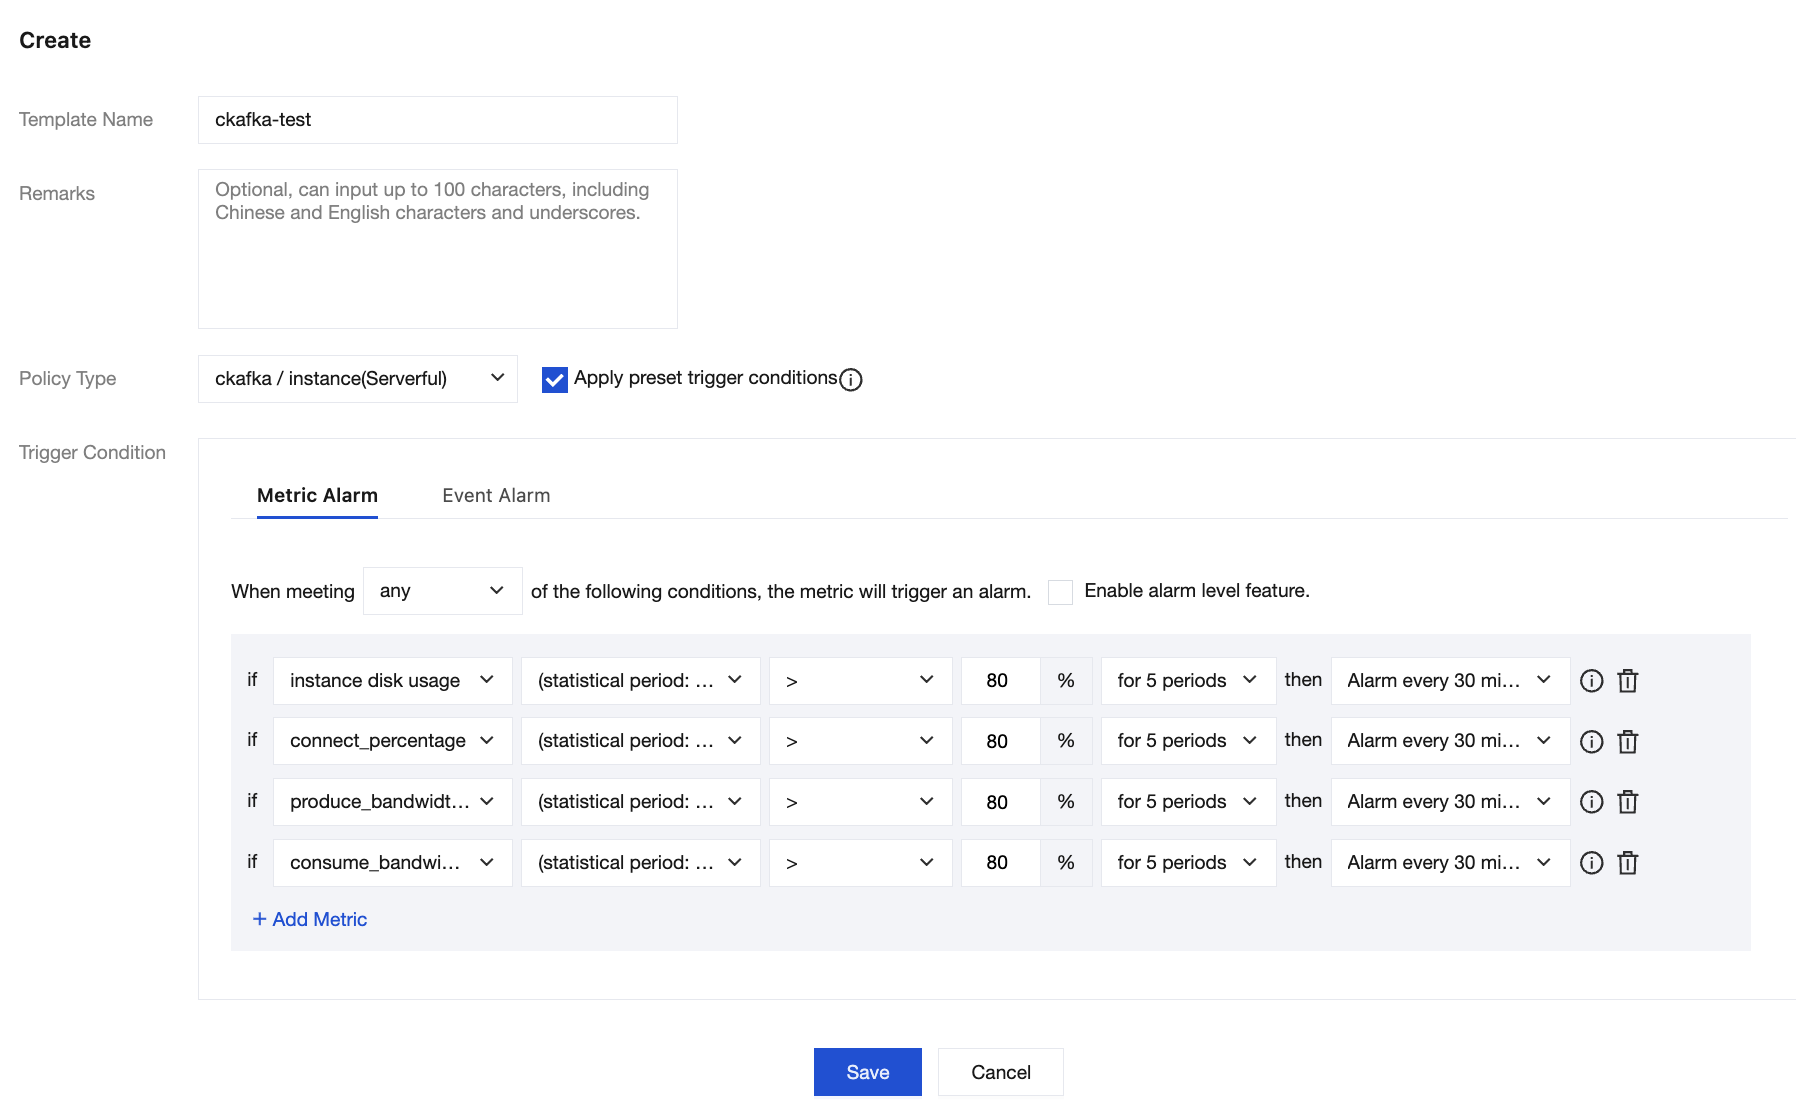
2. In the upper-left corner, click Create Trigger Condition Template. On the New Template page, configure the alarm policy.
Policy Type: Select ckafka. If you select Apply preset trigger conditions, the system-recommended alarm policies will be displayed.
Trigger Condition: Set the alarm policy according to the alarm policy recommendations or your actual business requirements.
3. After confirmation, click Save.
4. Return to the Create Alarm Policy page, click Refresh. The alarm policy template that you configured will be displayed.
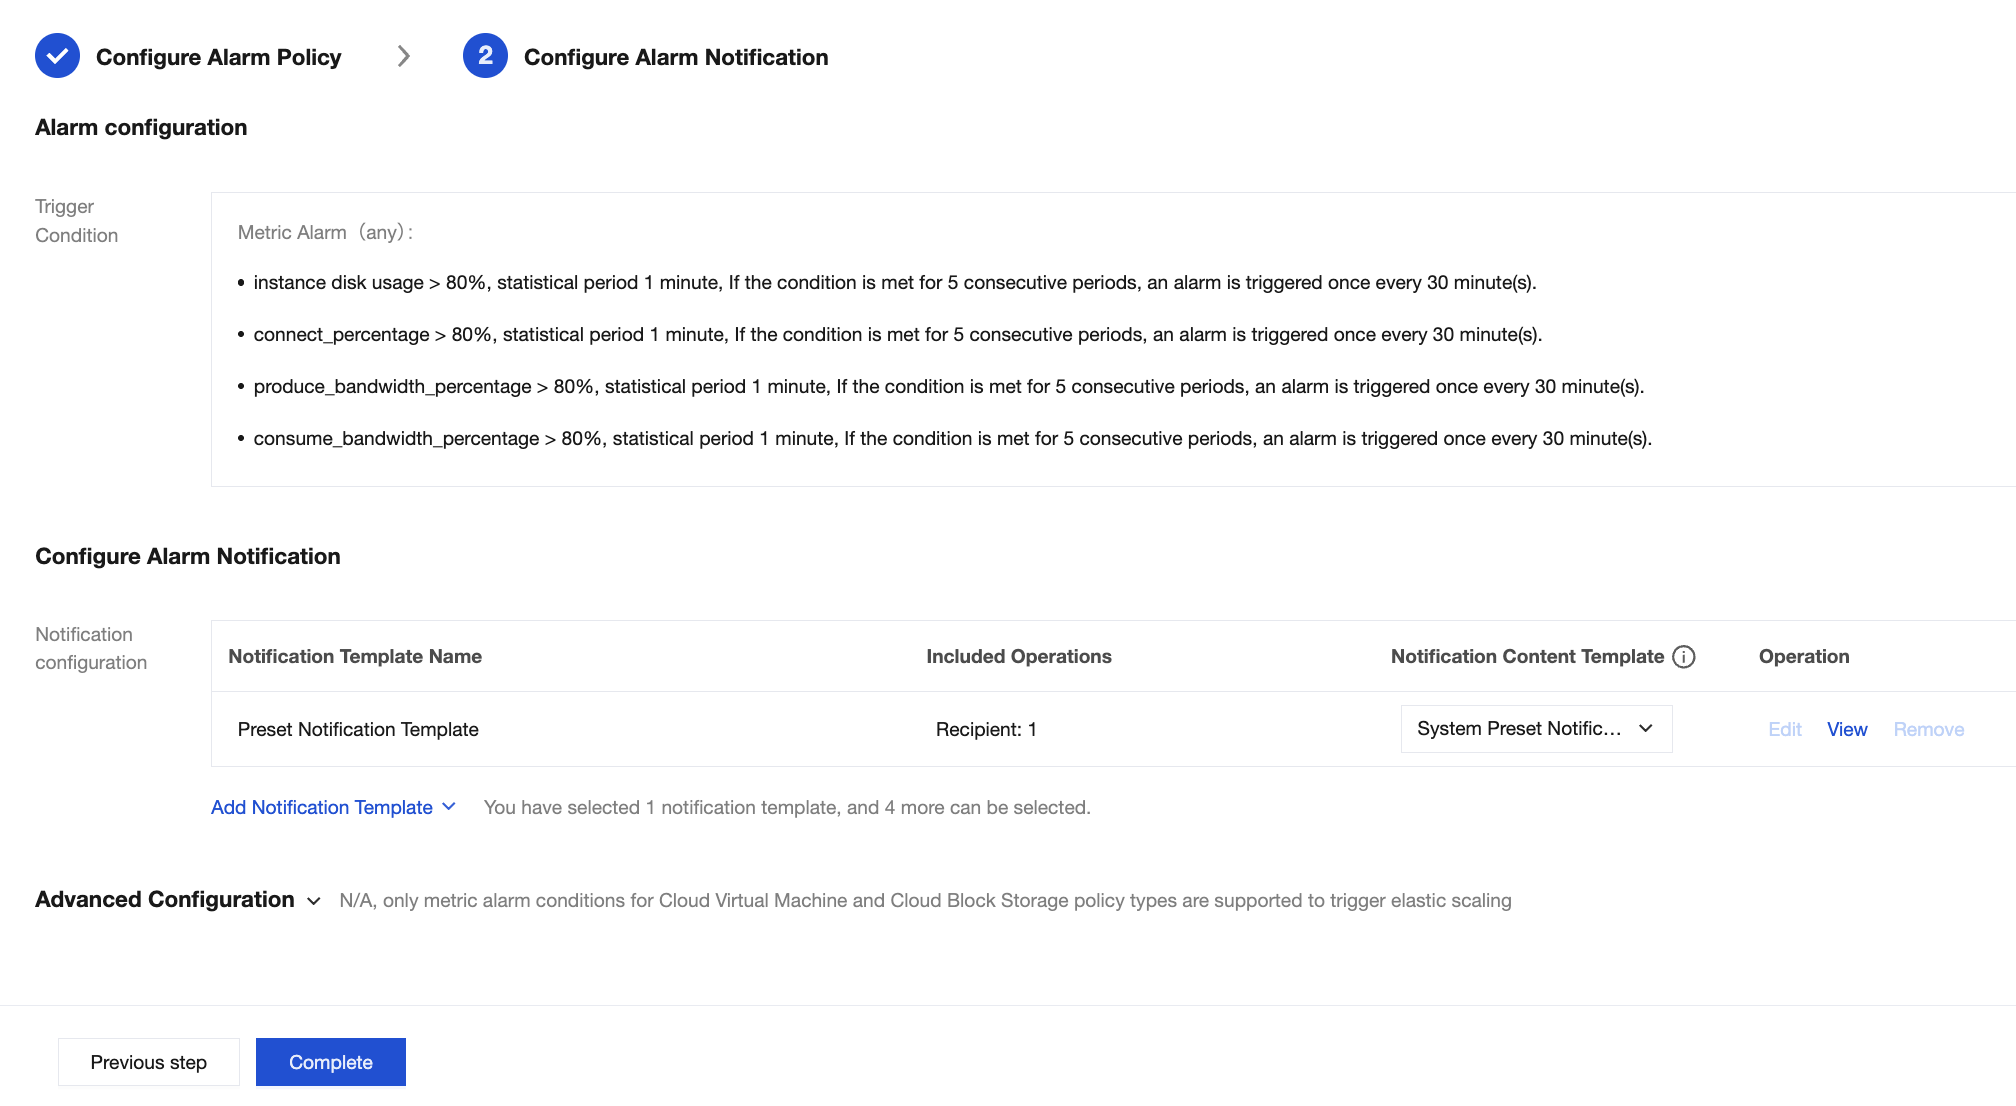
3. Click Next: Configure Alarm Notification to configure alarm recipients.
Step 3: Configuring an Alarm Notification
On the alarm notification configuration page, you can select a system preset notification template. Typically, the alarm recipient in a preset template is the root account owner. If you need to notify the instance owner or other personnel, you can also click Add Notification Template to create a notification template and set alarm recipients and alarm receiving channels.