CLS can be connected to Grafana to export the raw log data and SQL aggregate analysis results for display in Grafana. To display the results in Grafana, you only need to install the Tencent Cloud Monitor Grafana App and enter search and analysis statements in Grafana.
This document describes how to install and configure Grafana on CentOS.
Directions
Installing Grafana
1. For more information on how to install Grafana 8.0 or later, see Install Grafana.
If your Grafana version is earlier than 8.0, configuration backup and upgrade are required. For details, see Upgrade Grafana.
The following example shows how to install Grafana 8.4.3 (click here to get the latest version address) on CentOS:
2. After installation, we recommend you modify the [dataproxy] configuration in the grafana.ini file.
The default timeout period of Grafana is 30s. When you search for a large amount of data, a timeout may occur. For more information, see Grafana proxy queries timeout after 30s with dataproxy.timeout and dataproxy.keep_alive_seconds to > 30s #35505. We recommend you set the timeout period to 60s to maximize the CLS capabilities. Modify the configuration as follows:
[dataproxy]
timeout = 60
dialTimeout = 60
keep_alive_seconds = 60
To install more visual panels (such as pie and graph panels), install Grafana panel plugins by running the corresponding commands.
For example, if you want to install the pie panel, you can run the following command:
# If the plugin cannot be found after the installation, it may be because that the plugin directory is not set to the default directory. In this case, go to the plugin installation directory and run the following command.
# If your CVM instance is not on CentOS, confirm the location of the Grafana plugin directory first and go to the directory for installation.
2. Run the following command to restart the Grafana service:
service grafana-server restart
Configuring log data source
1. Enter http://${Grafana IP address}:3000 (3000 is the default port number) in your browser to log in to Grafana.
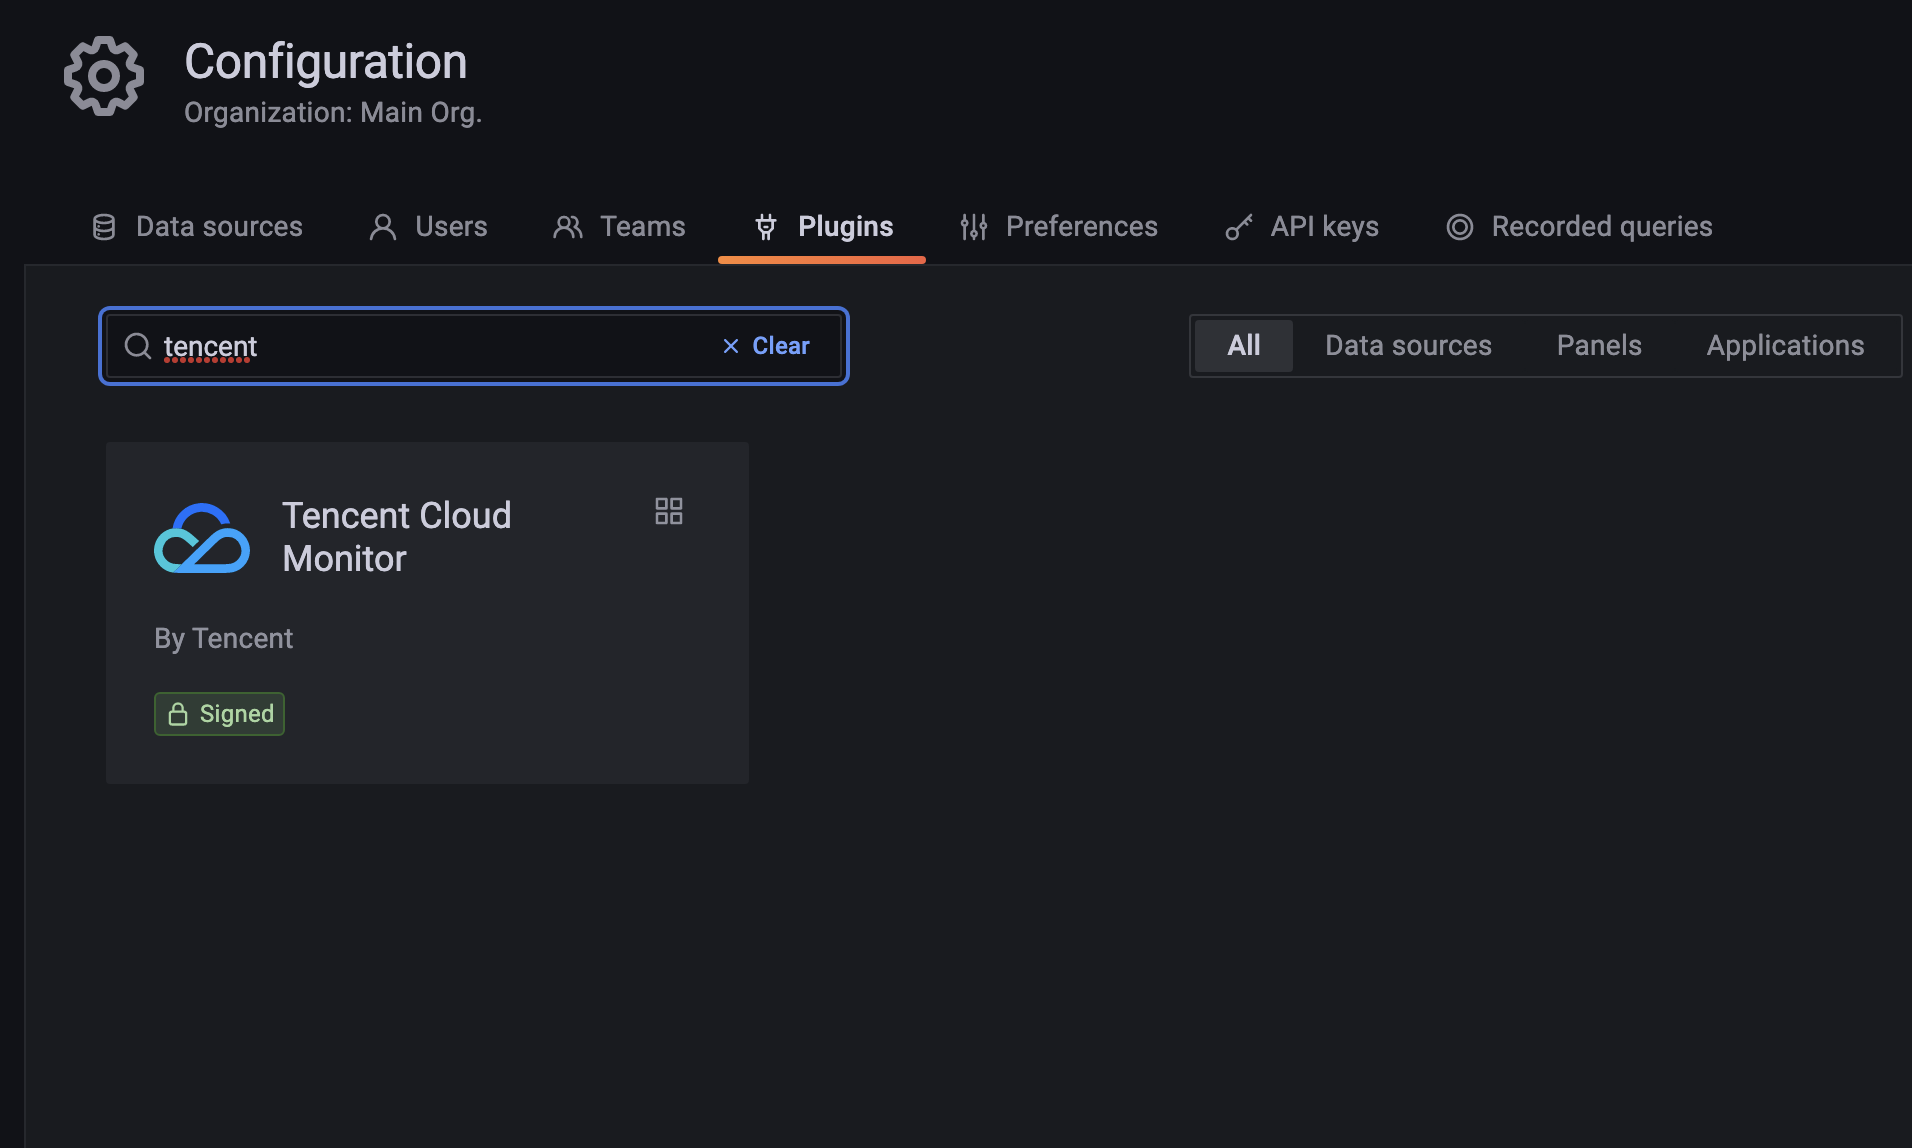
2. On the left sidebar, select the Settings icon to go to the Plugins page. Select Tencent Cloud Monitor and click Enable on the Config page to enable the plugin.
3. On the Data Sources page, click Add data source.
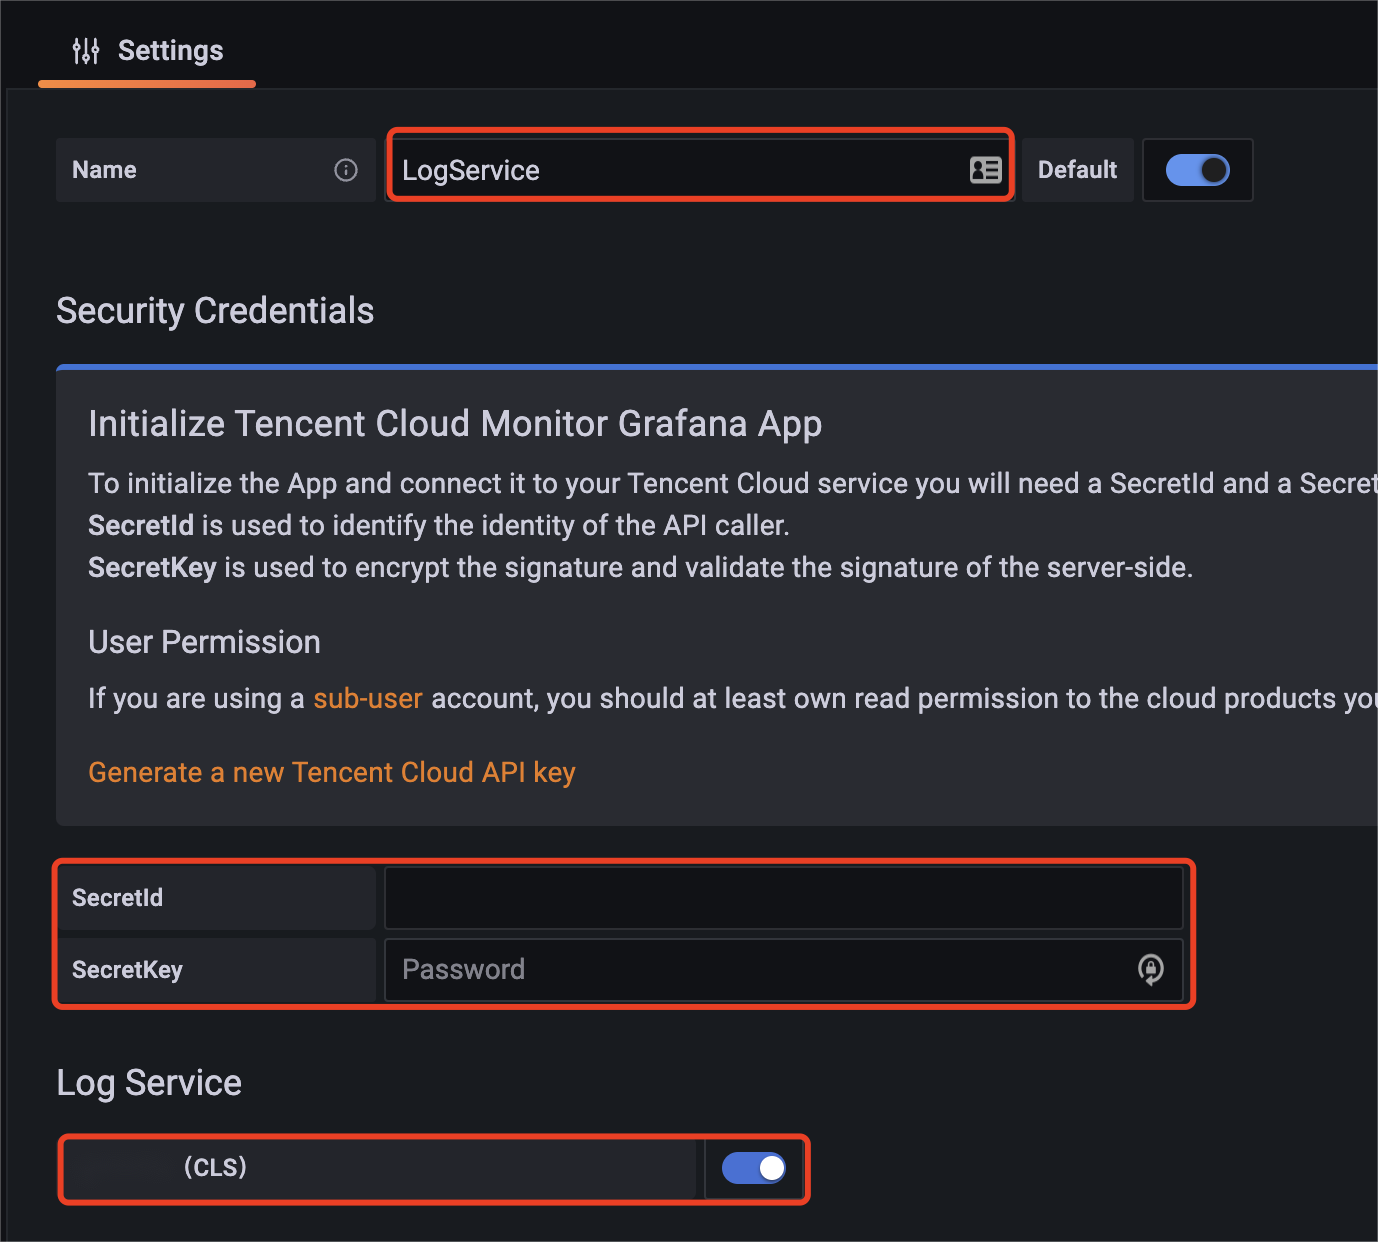
4. Select Tencent Cloud Monitor, enter the data source name and Tencent Cloud access key as instructed, select Cloud Log Service (cls), and click Save.
Trying out the CLB-DEMO preset dashboard
To quickly try out Tencent Cloud Monitor Grafana App, we recommend you use the demo log feature.
After creating a log topic, you can go to the preset CLB Demo Access Log dashboard to view preset content.
Manually configuring dashboard
1. On the left sidebar, click Create Dashboards.
2. On the dashboard page, click Add new panel.
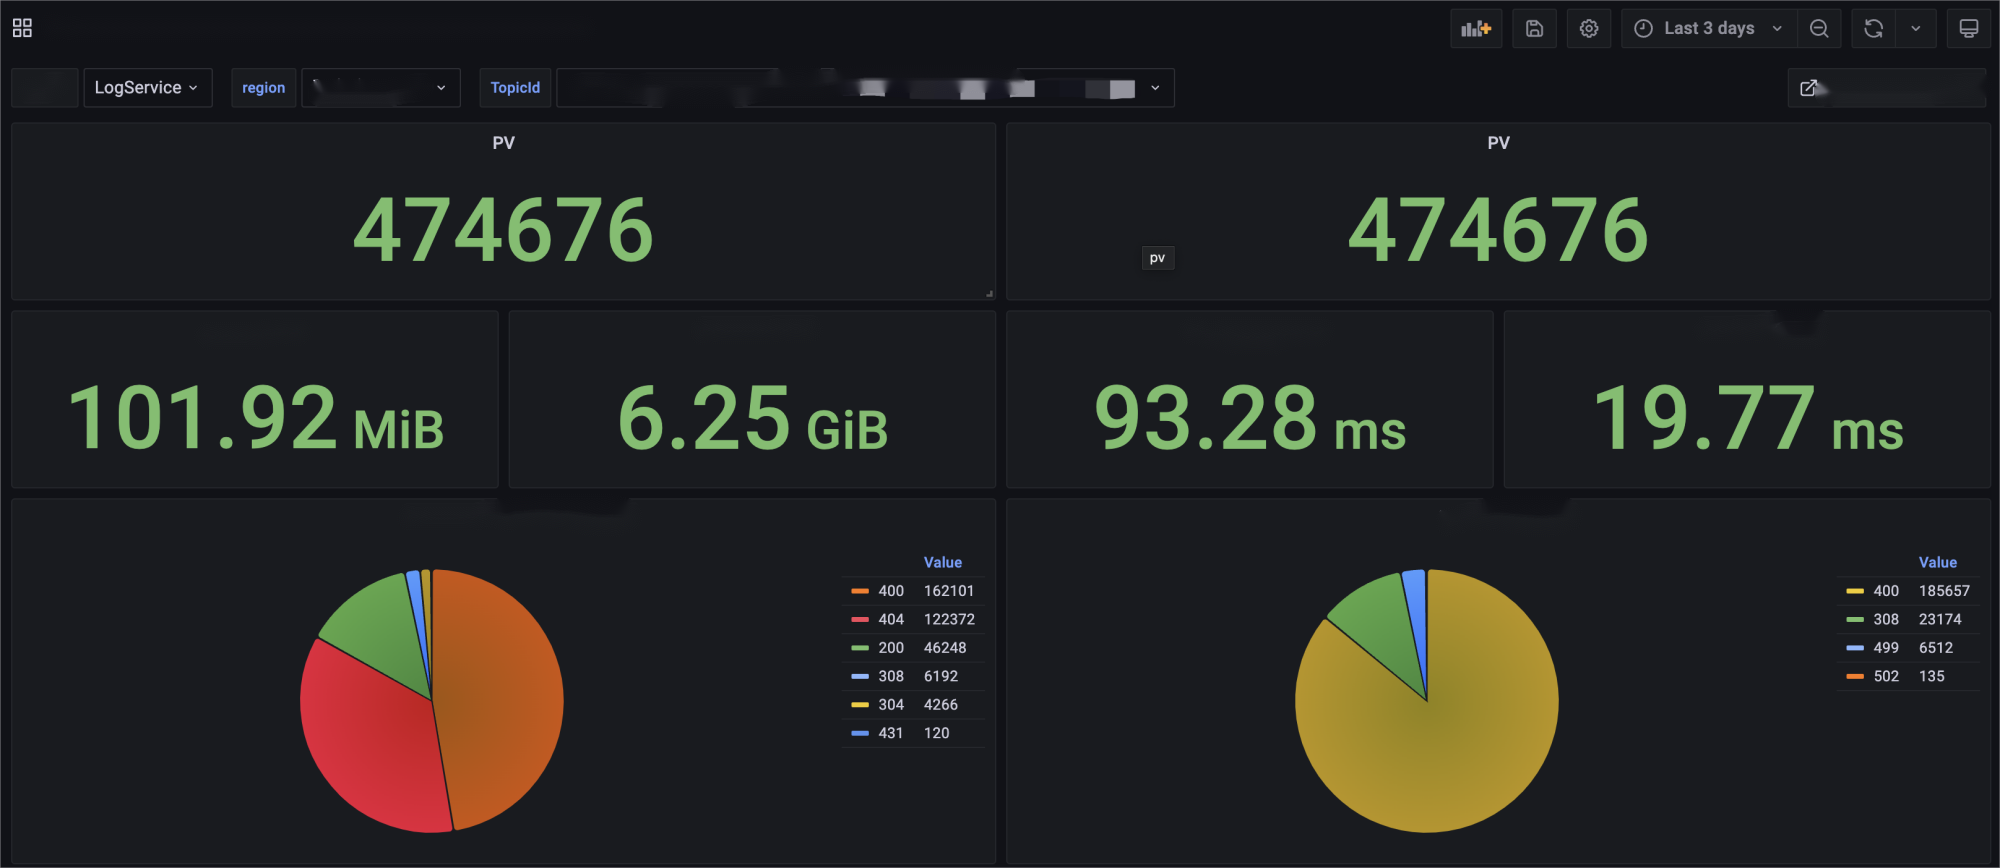
3. Select a data source, a region, and a log topic, and enter the corresponding search and analysis statement.
4. Click the time in the upper-right corner and refresh. Then you can view the requested data on the dashboard.
Using log analysis to enter SQL statements for chart drawing and display
For the native charts on Grafana, data visualization is driven by data type. You can determine if and how a chart can be drawn based on the field type.
1. Draw a table.
Tables have no special requirements for data formats, and any content returned for the SQL statement can be displayed.
2. Draw a sequence diagram. The content returned for the SQL statement contains two fields, analytic_time of the time type and log_count of the numeric type, which can be used to complete the drawing.
3. Draw pie charts (Pie, Gauge, BarGauge, or Stat) (note that the Value Options - show chart configuration item on the right must be set to All values).
The content returned for the SQL statement contains two fields: status of the character type and log_count of the numeric type. Grafana automatically selects the character type as the tag for drawing.
Note:
If try_cast is not used for type conversion, the chart drawing effect will be affected.
If the content field types returned for the SQL statement do not meet your chart drawing requirements, in addition to using the type conversion function in SQL, you can use the Convert field type feature on the Transform tab page of Grafana for visual display.
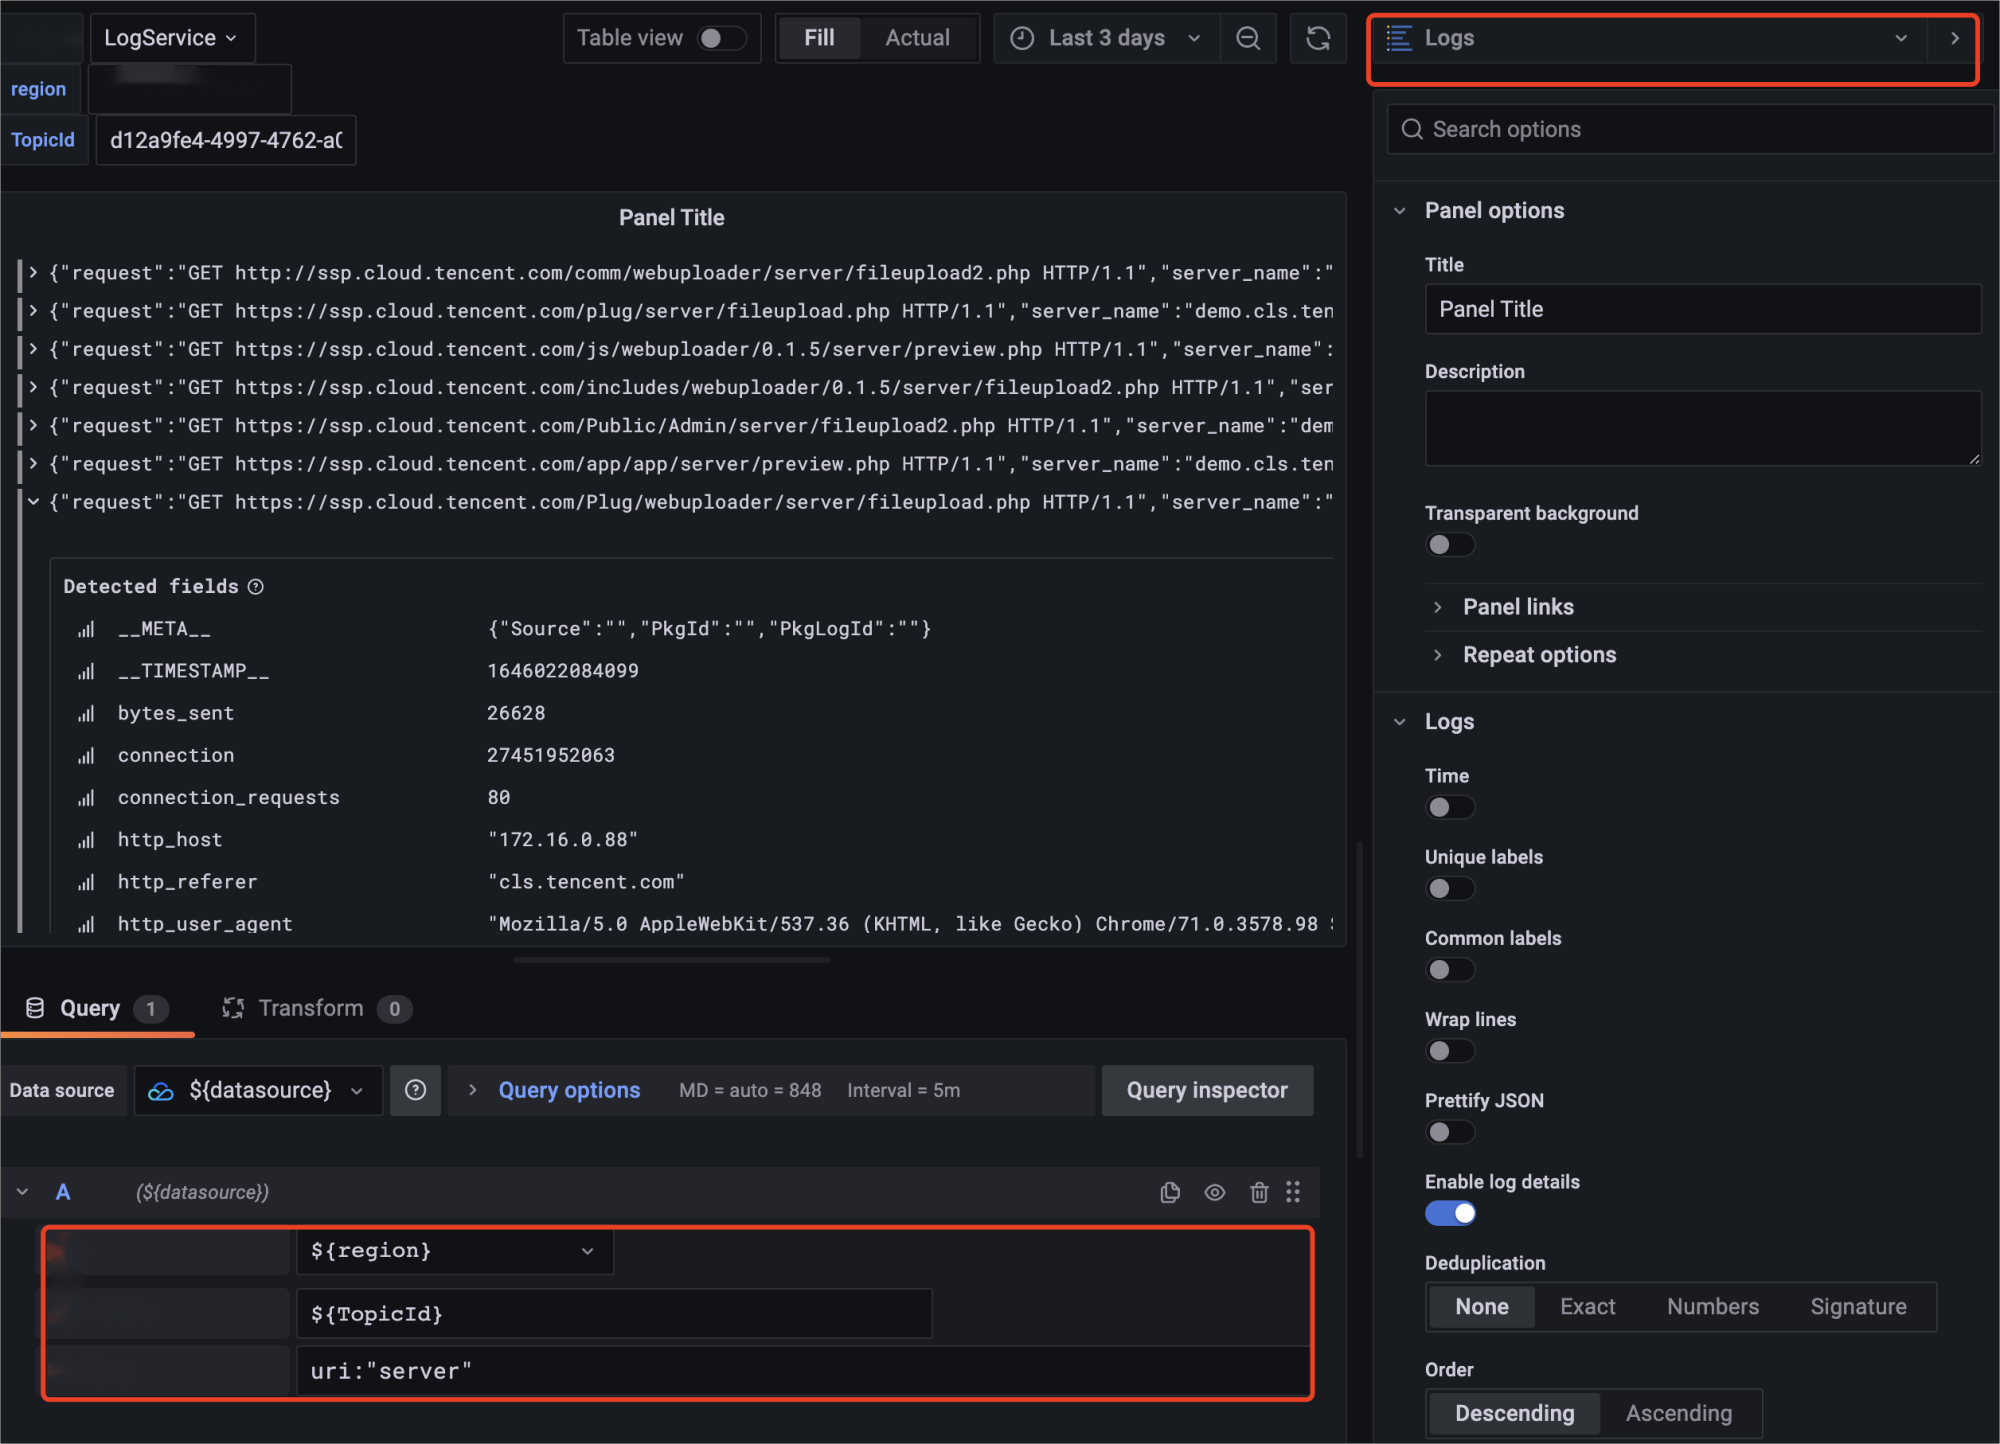
Viewing raw logs
For search scenarios, we recommend you use the Logs plugin to display data.
If you are using Grafana v8.3 or later, you can also use the Extract fields feature on the Transform tab page of Grafana to extract fields from the content returned for the search and view data in Table.