NGINX is a high-performance HTTP and reverse proxy server. By analyzing NGINX logs, you can obtain various valuable results, such as data support for website diagnosis and tuning, website stability monitoring, and operations statistics. This document introduces how to use CLS to comprehensively mine NGINX log data.
If you do not have Nginx logs, you can use the Demo log topic provided for free by CLS to experience this feature. For detailed steps, see Use Demo Log to Quickly Experience CLS.
Preset Dashboard
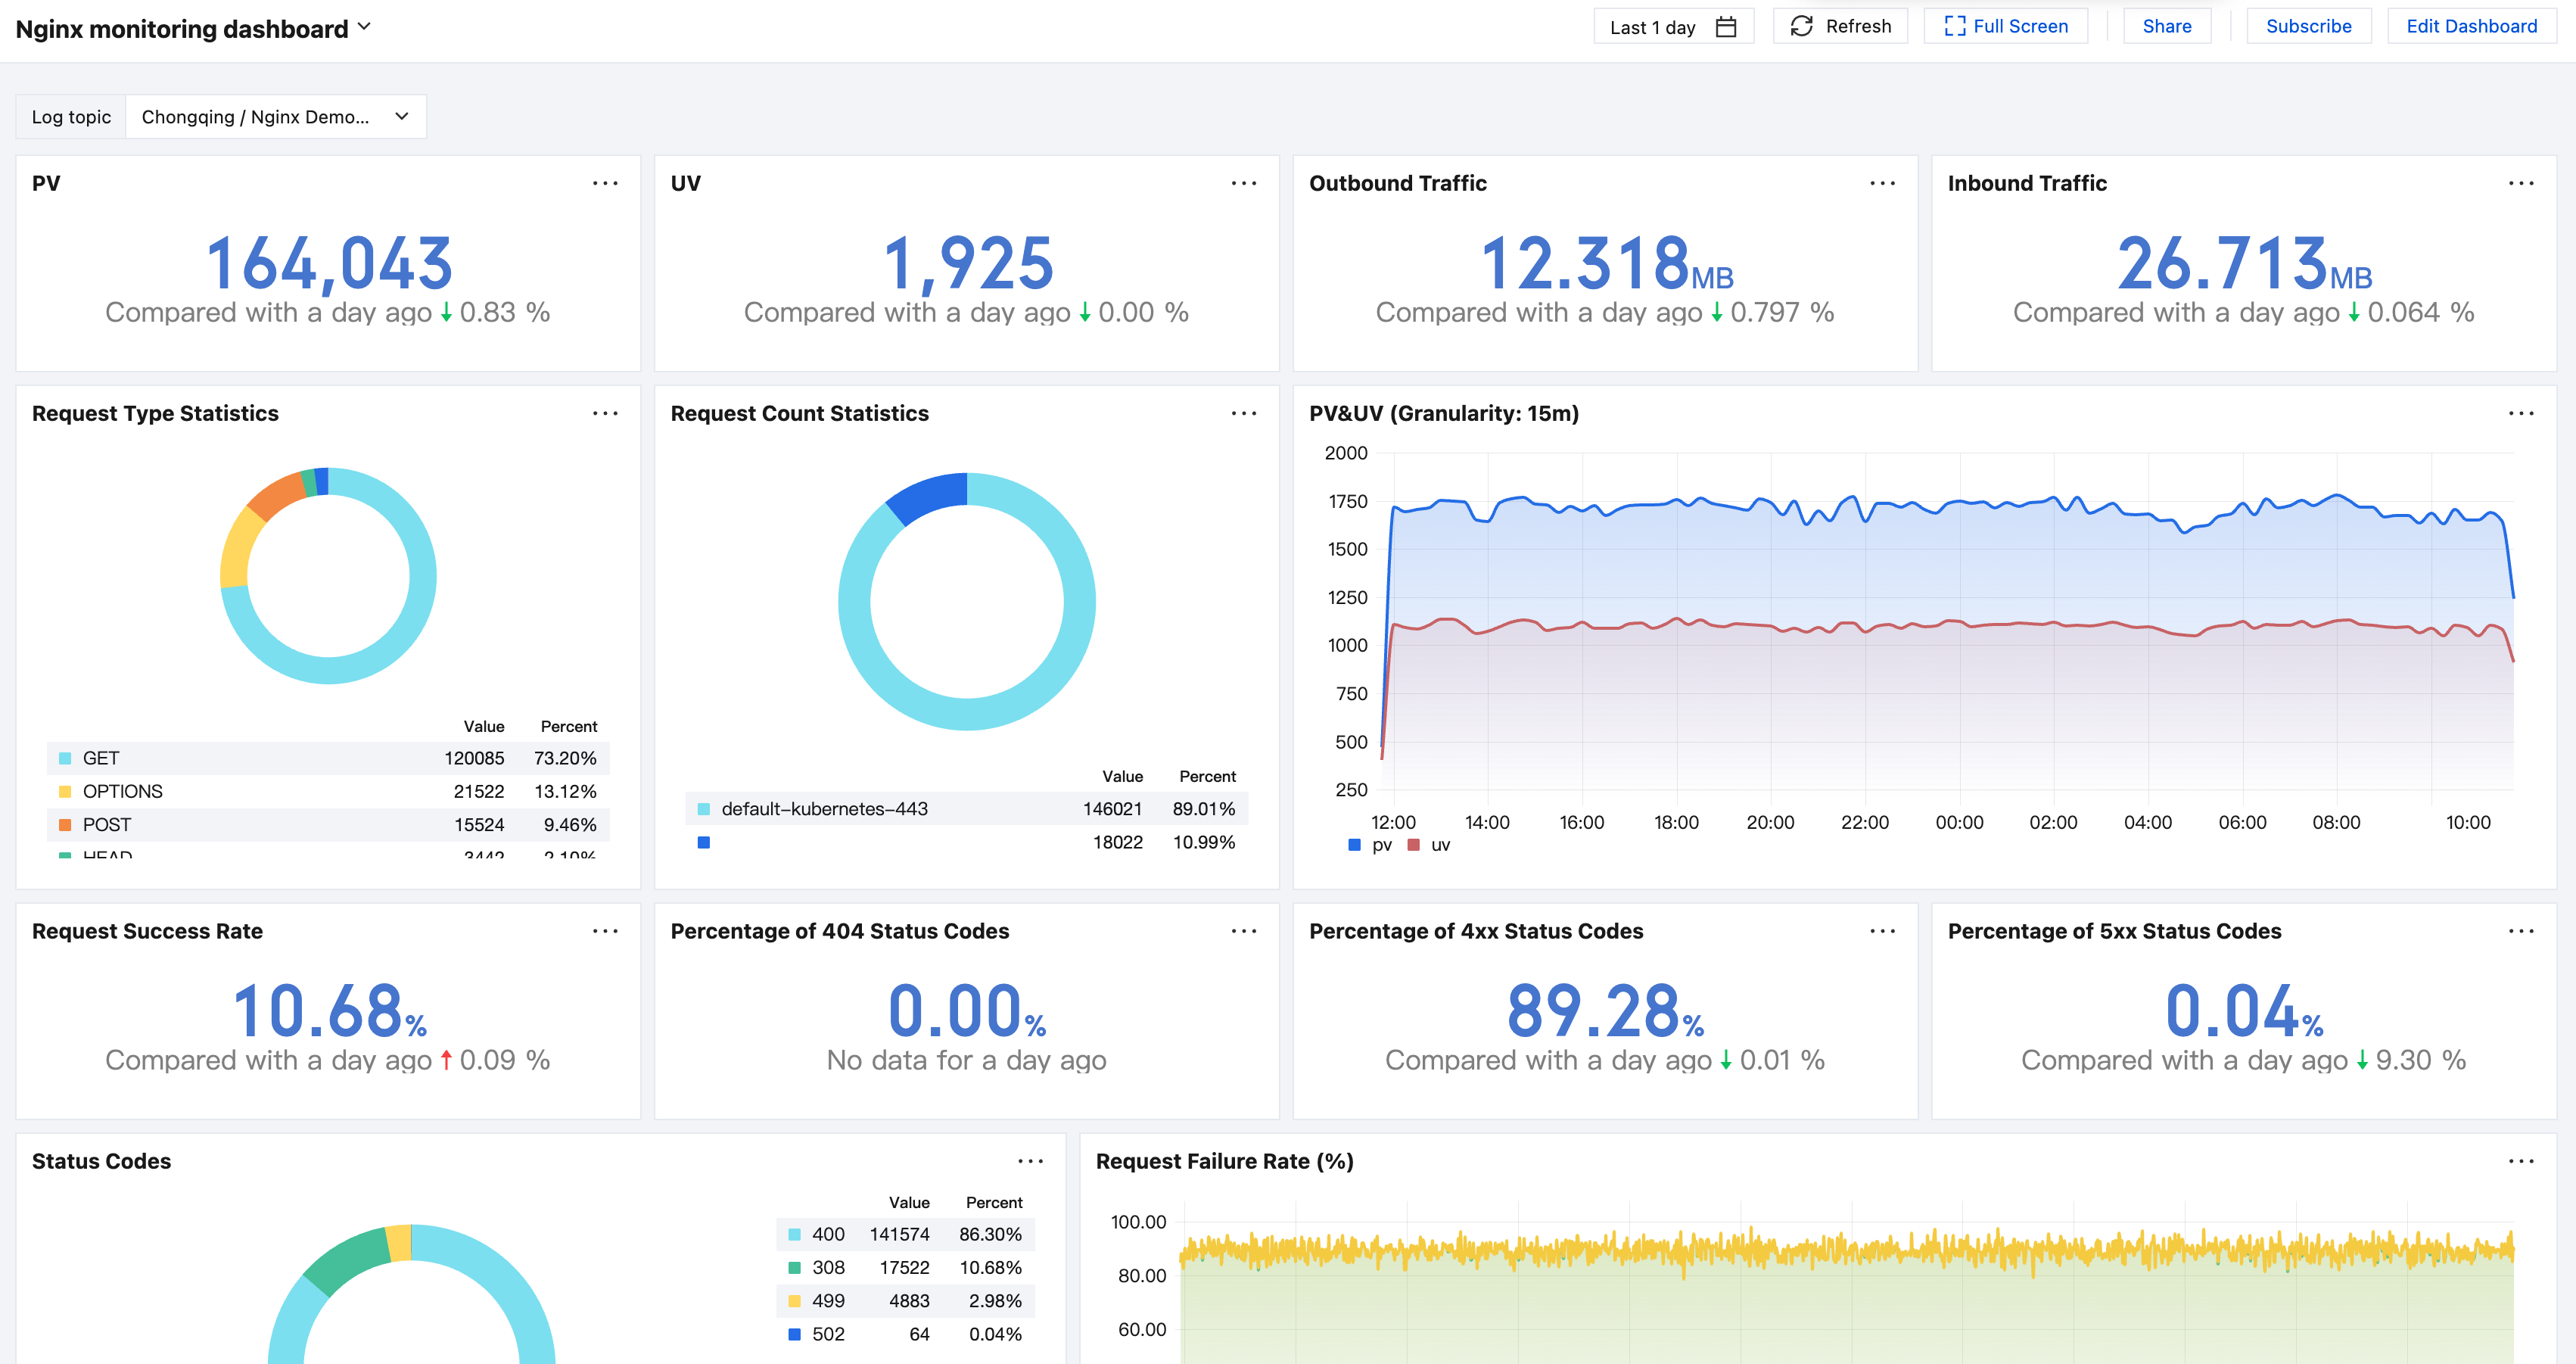
CLS has preset common Nginx log statistics as dashboards. You can quickly understand the current Nginx running status and end-user access behavior through these dashboards.
Nginx Monitoring Dashboard includes metrics such as request success rate, request status code distribution, and request latency.
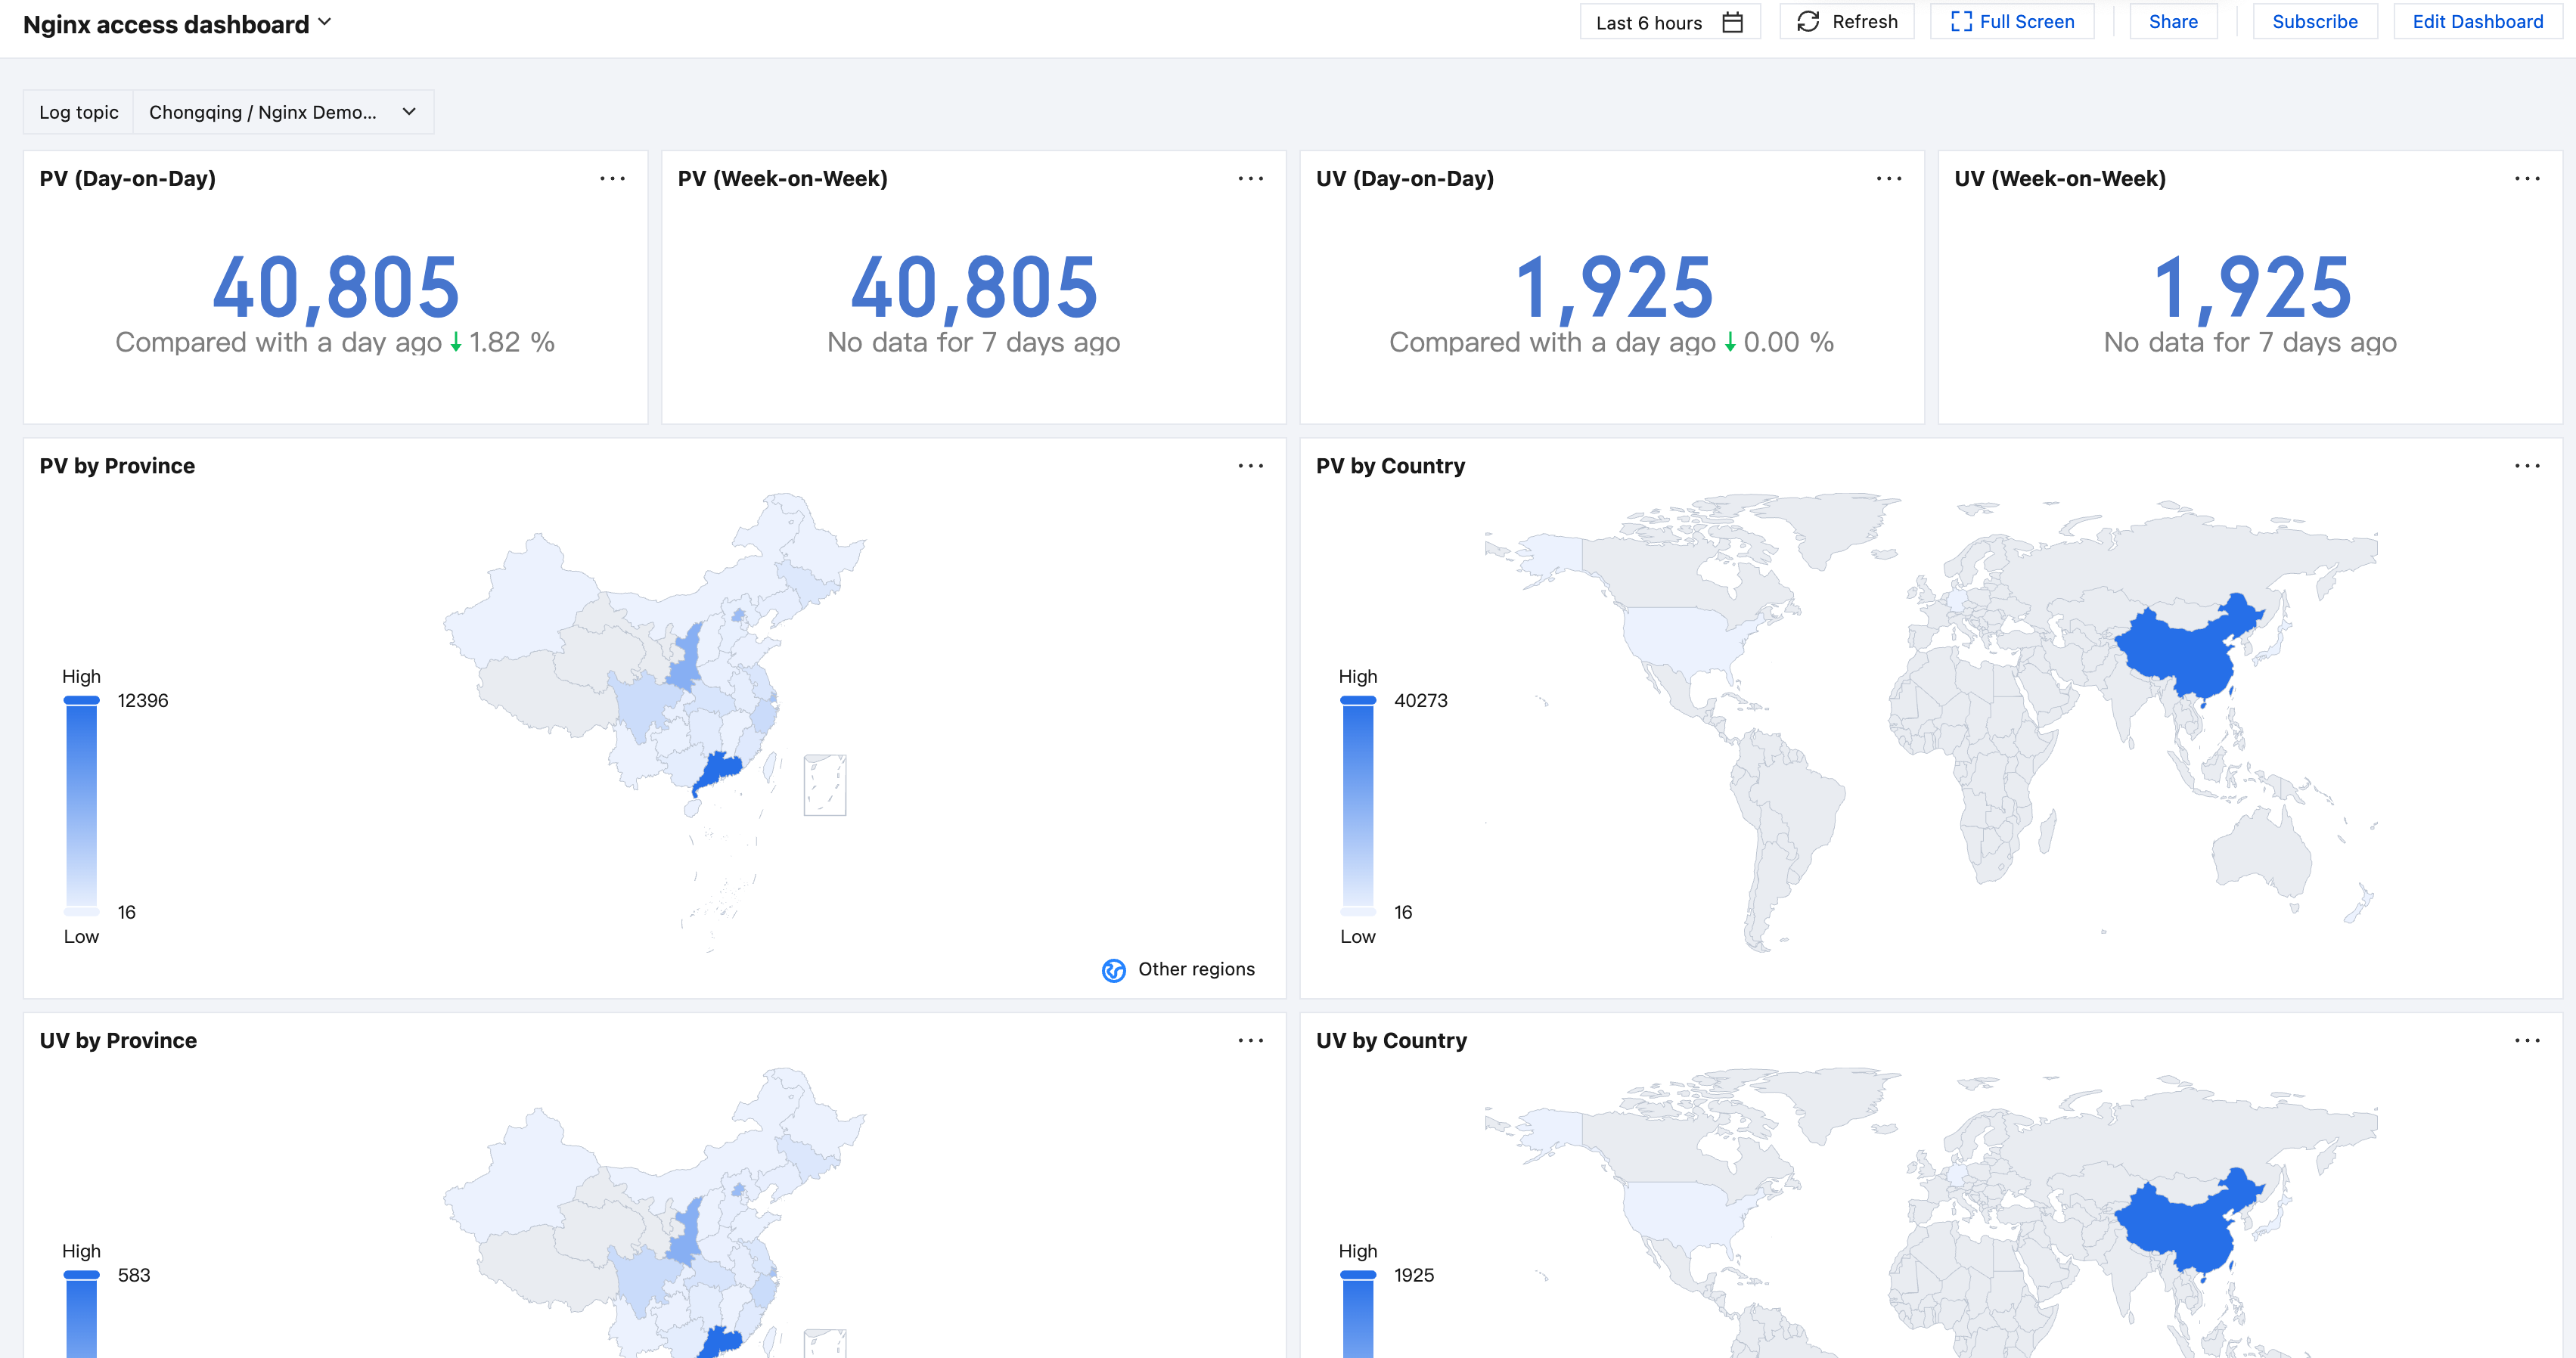
Nginx Access Dashboard includes metrics such as PV, UV, and request geographic distribution.
Click Edit Dashboard in the upper right corner of the dashboard to edit based on the preset dashboard.
You can build a dashboard that is more tailored to your specific needs.