- Release Notes and Announcements
- User Guide
- Product Introduction
- Purchase Guide
- Getting Started
- Operation Guide
- Resource Management
- Permission Management
- Log Collection
- Collection Overview
- Collecting Logs in Self-Built Kubernetes Cluster
- Collecting Syslog
- Collection by LogListener
- Collecting Text Log
- Uploading Log over Kafka
- Uploading Logs via Anonymous Write
- Uploading Logs via Logback Appender
- Uploading Logs via Log4j Appender
- Uploading Log via SDK
- Uploading Log via API
- Importing Data
- Tencent Cloud Service Log Access
- Log Storage
- Search and Analysis
- Syntax and Rules
- Statistical Analysis (SQL)
- Quick Analysis
- SQL Syntax
- SQL Functions
- String Function
- Date and Time Functions
- IP Geographic Function
- URL Function
- Mathematical Calculation Functions
- Mathematical Statistical Function
- General Aggregate Function
- Geospatial Function
- Binary String Function
- Estimation Function
- Type Conversion Function
- Logical Function
- Operators
- Bitwise Operation
- Regular Expression Function
- Lambda Function
- Conditional Expressions
- Array Functions
- Interval-Valued Comparison and Periodicity-Valued Comparison Functions
- JSON Functions
- Window Functions
- Sampling Analysis
- Configuring Indexes
- Reindexing
- Context Search and Analysis
- Downloading Log
- Dashboard
- Data Processing documents
- Data Processing
- Creating Processing Task
- Viewing Data Processing Details
- Data Processing Functions
- Function Overview
- Key-Value Extraction Functions
- Enrichment Functions
- Flow Control
- Row Processing Functions
- Field Processing Functions
- Value Structuring Functions
- Regular Expression Processing Functions
- Time Value Processing Functions
- String Processing Functions
- Type Conversion Functions
- Logical and Mathematical Functions
- Encoding and Decoding Functions
- IP Parsing Functions
- Processing Cases
- Scheduled SQL Analysis
- SCF
- Data Processing
- Shipping and Consumption
- Log Shipping
- Monitoring Alarm
- Historical Documentation
- Best Practices
- Developer Guide
- API Documentation
- History
- Introduction
- API Category
- Making API Requests
- Topic Management APIs
- Log Set Management APIs
- Index APIs
- Topic Partition APIs
- Machine Group APIs
- Collection Configuration APIs
- Log APIs
- Metric APIs
- Alarm Policy APIs
- Data Processing APIs
- Kafka Protocol Consumption APIs
- CKafka Shipping Task APIs
- Kafka Data Subscription APIs
- COS Shipping Task APIs
- SCF Delivery Task APIs
- Scheduled SQL Analysis APIs
- COS Data Import Task APIs
- Data Types
- Error Codes
- FAQs
- CLS Service Level Agreement
- CLS Policy
- Contact Us
- Glossary
A bar chart describes categorical data. It visually reflects the comparison of each category in size. It is suitable for category statistics scenarios, for example, collecting the numbers of each type of error codes in the last 24 hours.
Chart Configuration
General configuration
Configuration Item | Description |
Basic information | Chart Name: Set the display name of the table, which can be left empty. |
Standard configuration |
Bar chart configuration
Configuration Item | Description |
Bar chart | Direction: Control the bar/column direction. A bar chart is horizontal, while a column chart is vertical. Sort By: Control the bar/column sorting order, which can be ascending or descending by metric. If there are multiple metrics, you need to select one for sorting. Sorting is disabled by default. Display Value: Control whether to display the value label of each bar/column. Bar/Column Mode: Grouped and stacked display modes are supported. |
Bar/Column mode example:
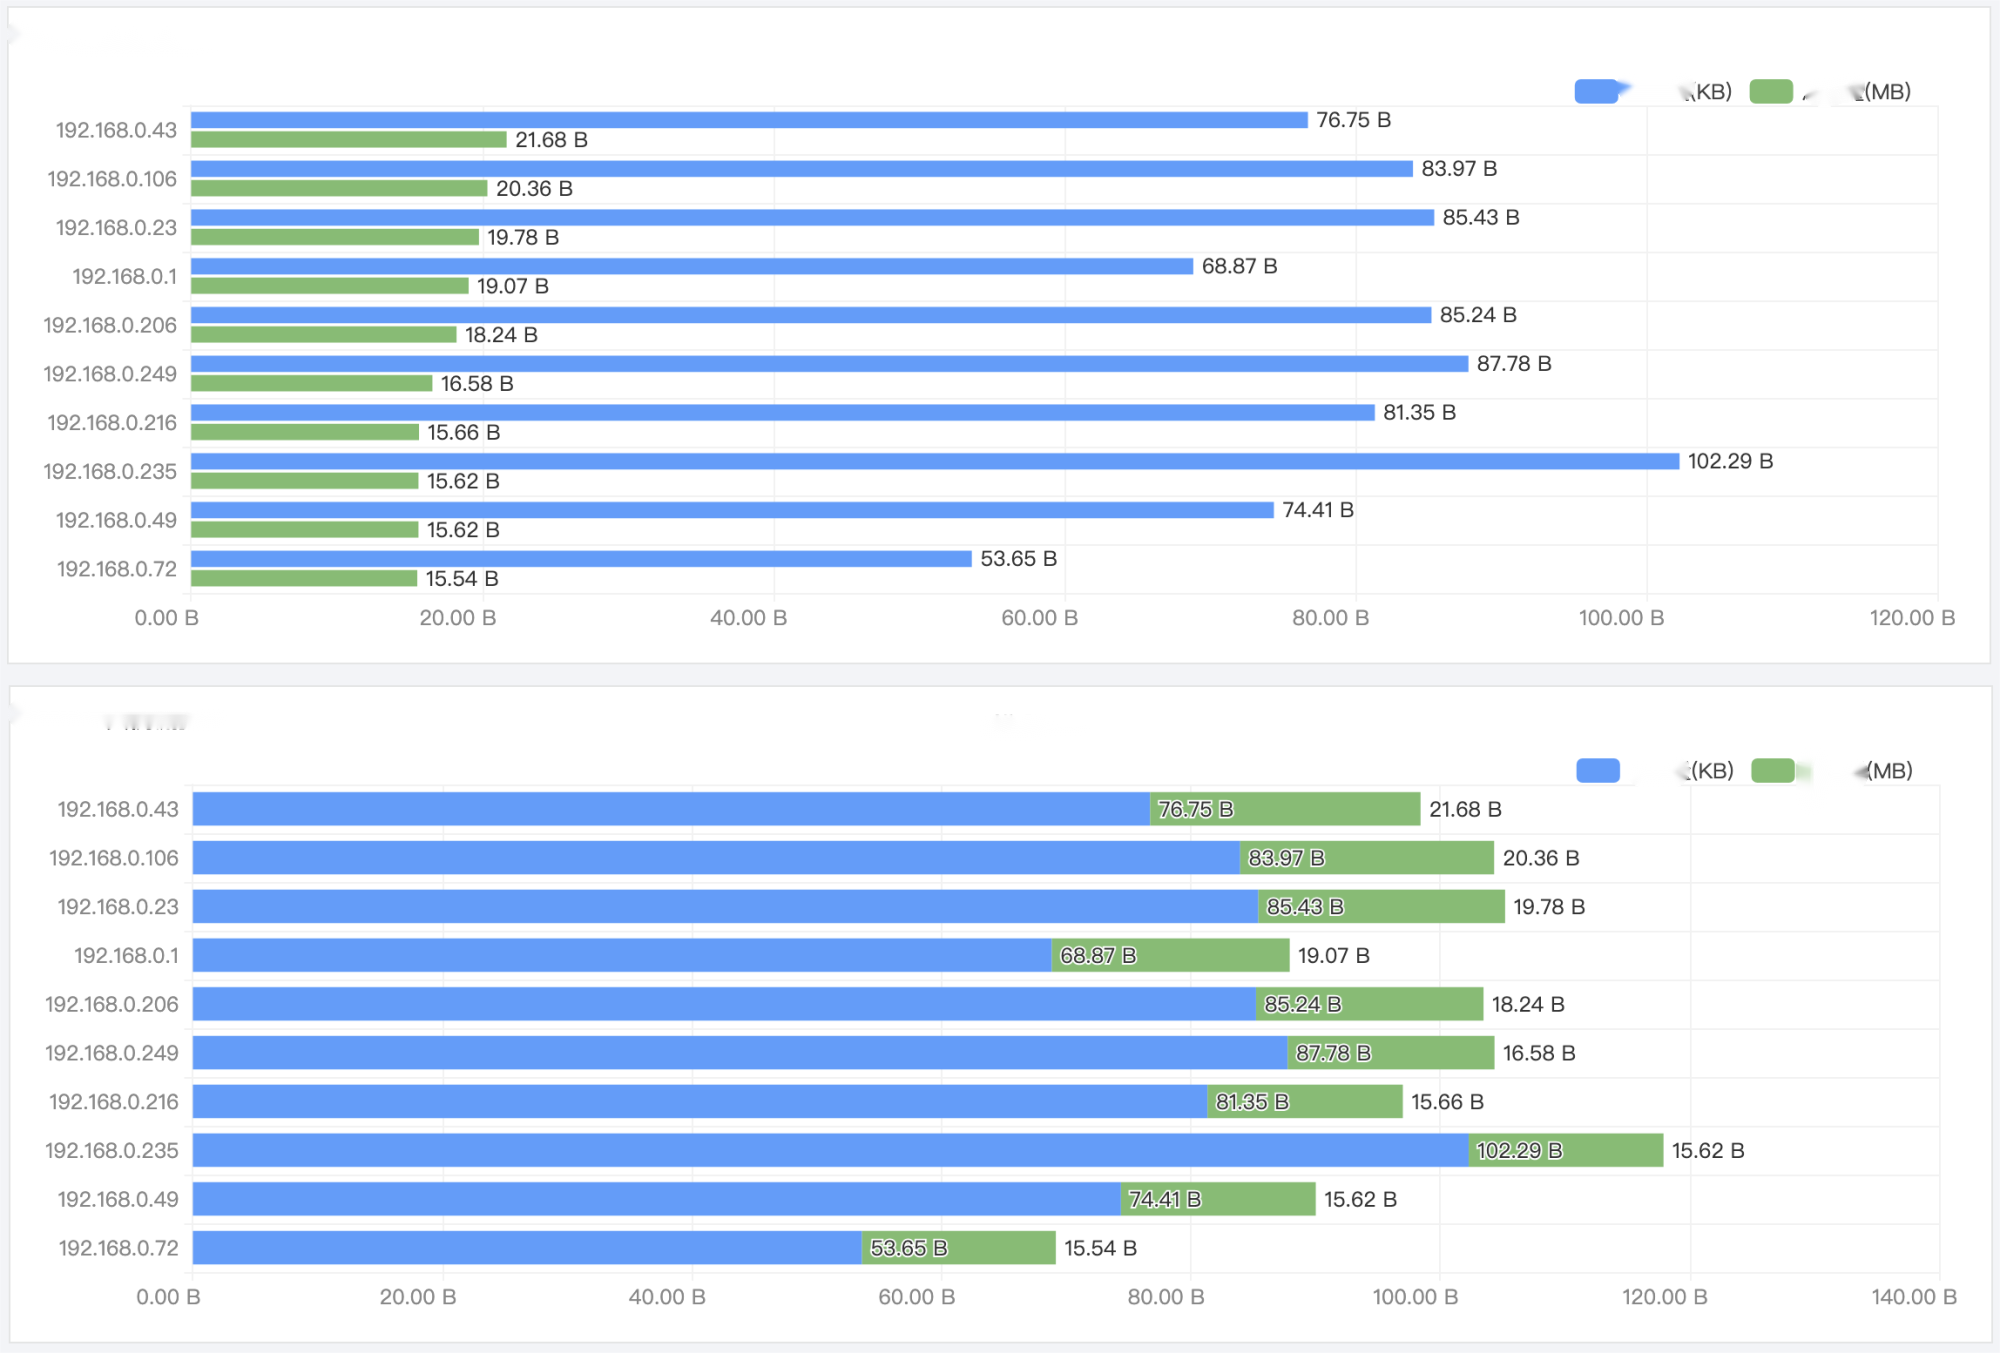
Chart Operations
Local zoom-out
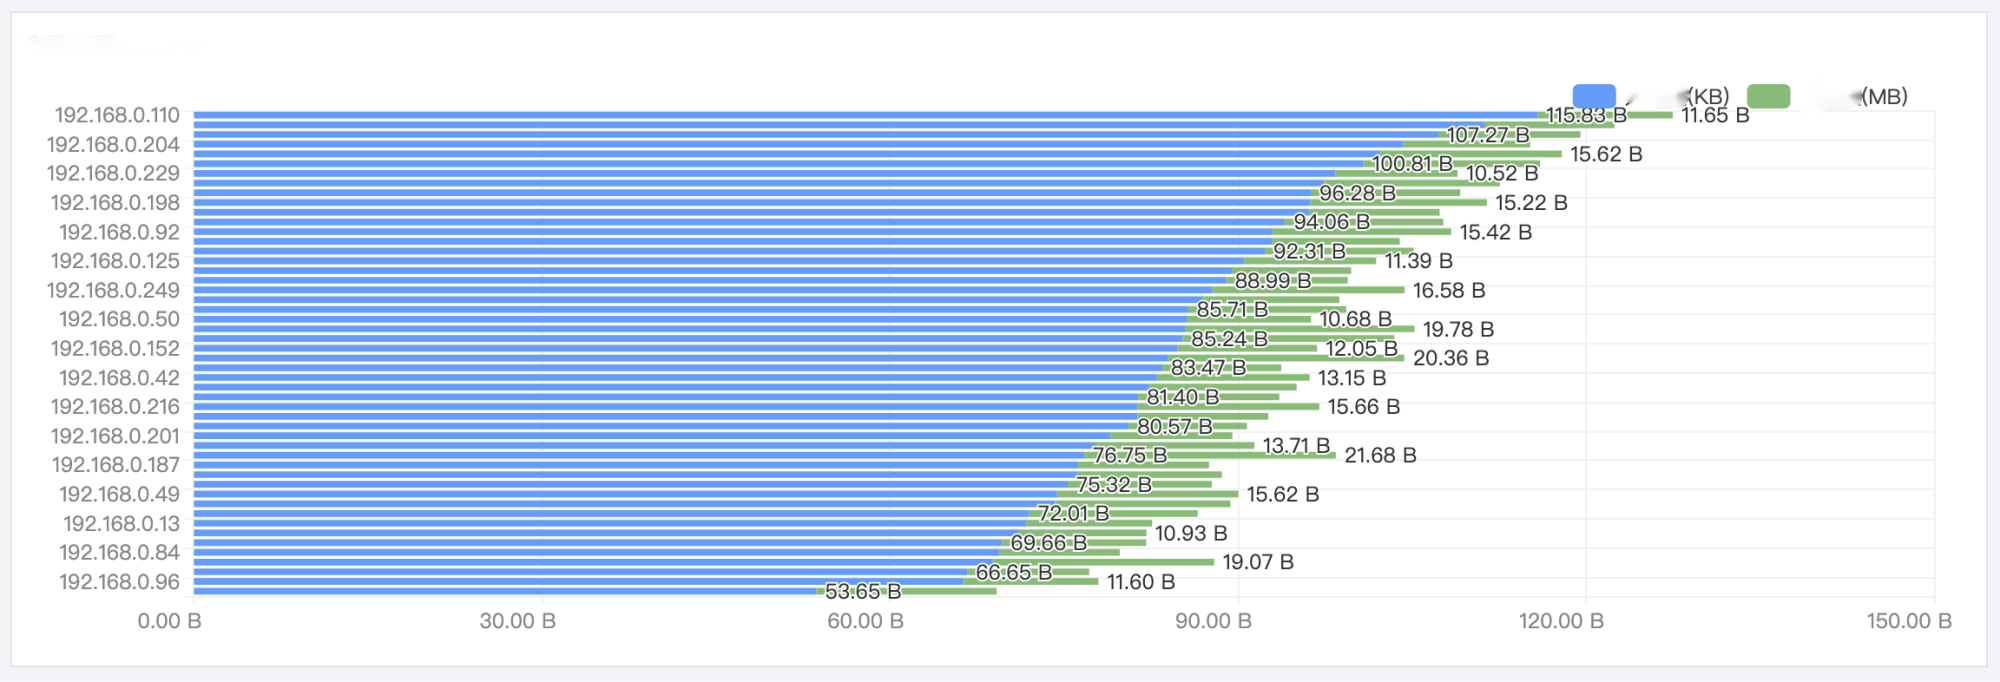
If there are too many statistical results, the bars/columns will be too dense and labels will overlap each other as shown above, which will affect the analysis. In this case, you can hover over the chart and scroll the mouse wheel to zoom in/out the displayed area. This allows you to focus on the local content and display the complete information.

 Yes
Yes
 No
No
Was this page helpful?