- Release Notes and Announcements
- User Guide
- Product Introduction
- Purchase Guide
- Getting Started
- Operation Guide
- Resource Management
- Permission Management
- Log Collection
- Collection Overview
- Collecting Logs in Self-Built Kubernetes Cluster
- Collecting Syslog
- Collection by LogListener
- Collecting Text Log
- Uploading Log over Kafka
- Uploading Logs via Anonymous Write
- Uploading Logs via Logback Appender
- Uploading Logs via Log4j Appender
- Uploading Log via SDK
- Uploading Log via API
- Importing Data
- Tencent Cloud Service Log Access
- Log Storage
- Search and Analysis
- Syntax and Rules
- Statistical Analysis (SQL)
- Quick Analysis
- SQL Syntax
- SQL Functions
- String Function
- Date and Time Functions
- IP Geographic Function
- URL Function
- Mathematical Calculation Functions
- Mathematical Statistical Function
- General Aggregate Function
- Geospatial Function
- Binary String Function
- Estimation Function
- Type Conversion Function
- Logical Function
- Operators
- Bitwise Operation
- Regular Expression Function
- Lambda Function
- Conditional Expressions
- Array Functions
- Interval-Valued Comparison and Periodicity-Valued Comparison Functions
- JSON Functions
- Window Functions
- Sampling Analysis
- Configuring Indexes
- Reindexing
- Context Search and Analysis
- Downloading Log
- Dashboard
- Data Processing documents
- Data Processing
- Creating Processing Task
- Viewing Data Processing Details
- Data Processing Functions
- Function Overview
- Key-Value Extraction Functions
- Enrichment Functions
- Flow Control
- Row Processing Functions
- Field Processing Functions
- Value Structuring Functions
- Regular Expression Processing Functions
- Time Value Processing Functions
- String Processing Functions
- Type Conversion Functions
- Logical and Mathematical Functions
- Encoding and Decoding Functions
- IP Parsing Functions
- Processing Cases
- Scheduled SQL Analysis
- SCF
- Data Processing
- Shipping and Consumption
- Log Shipping
- Monitoring Alarm
- Historical Documentation
- Best Practices
- Developer Guide
- API Documentation
- History
- Introduction
- API Category
- Making API Requests
- Topic Management APIs
- Log Set Management APIs
- Index APIs
- Topic Partition APIs
- Machine Group APIs
- Collection Configuration APIs
- Log APIs
- Metric APIs
- Alarm Policy APIs
- Data Processing APIs
- Kafka Protocol Consumption APIs
- CKafka Shipping Task APIs
- Kafka Data Subscription APIs
- COS Shipping Task APIs
- SCF Delivery Task APIs
- Scheduled SQL Analysis APIs
- COS Data Import Task APIs
- Data Types
- Error Codes
- FAQs
- CLS Service Level Agreement
- CLS Policy
- Contact Us
- Glossary
A gauge chart describes a single metric. Unlike an individual value plot, it is generally used with a threshold to measure the metric status. It is suitable for rating scenarios, such as system health monitoring.
Chart Configuration
General configuration
Configuration Item | Description |
Basic information | Chart Name: Set the display name of the table, which can be left empty. |
Standard configuration |
Threshold configuration
Configuration Item | Description |
Threshold configuration | Threshold point: Set the threshold points. You can add multiple threshold intervals. You can click a threshold color to open the color picker to customize the color. MAX/MIN: Control the maximum and minimum values on the gauge. Data outside the range will not be displayed on the chart. |
Threshold configuration example: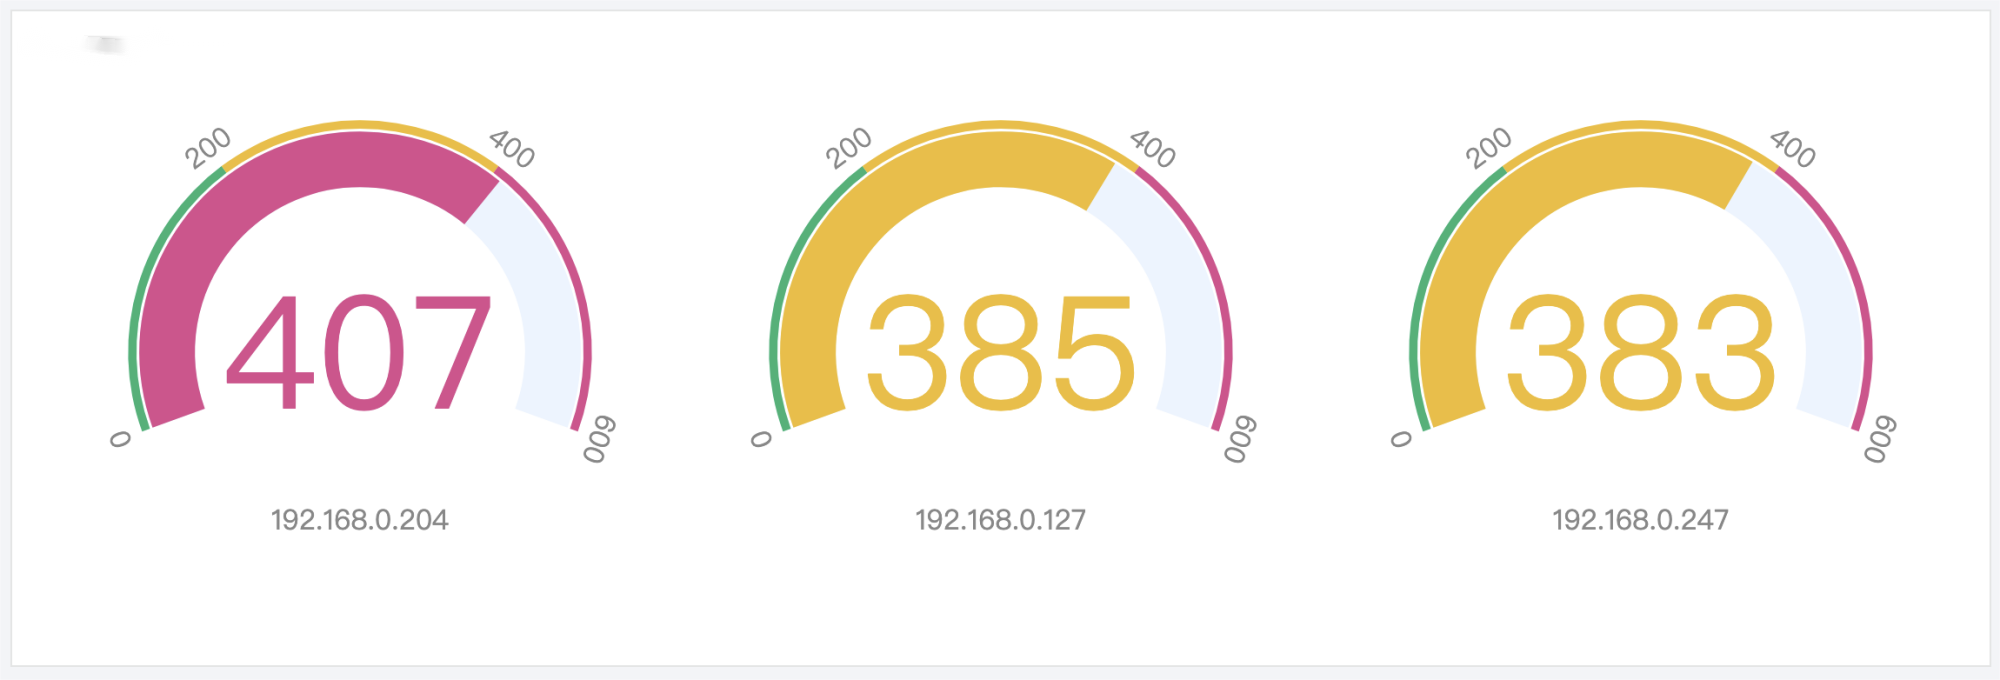

 Yes
Yes
 No
No
Was this page helpful?