This article describes how to use Attack Logs for indexing, rapid analysis, handling attacks, and downloading Attack Logs.
Background
WAF provides the Attack Logs feature by default, which records details such as the time of attack, source IP address, attack type, and attack specifics. Attack Logs only support querying or exporting logs from the last 30 days. The feature supports search methods including full-text search, fuzzy search, and combined condition search. It also enables log downloads based on search criteria, supporting downloads of millions of logs.
When the same source IP address launches multiple identical attack payloads within a short time window (every 10 seconds) and triggers the same protection rule, the system aggregates these attack records into a single log and records the actual number of attacks within that time window via the count field.
Search Attack Logs
1. Log in to WAF console, in the left sidebar, select Attack Logs.
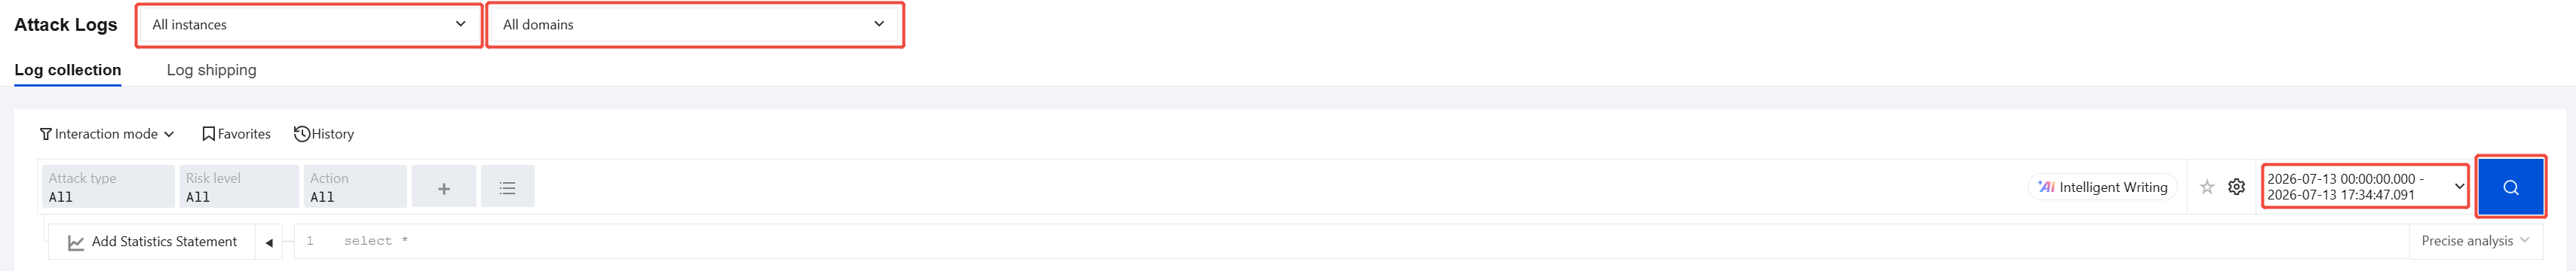
2. On the Attack Logs page, click Log collection to switch to the Log collection page.
3. Before Attack Logs are searched, please first set the search scope. Select the instance and domain, set the time range, and click
.
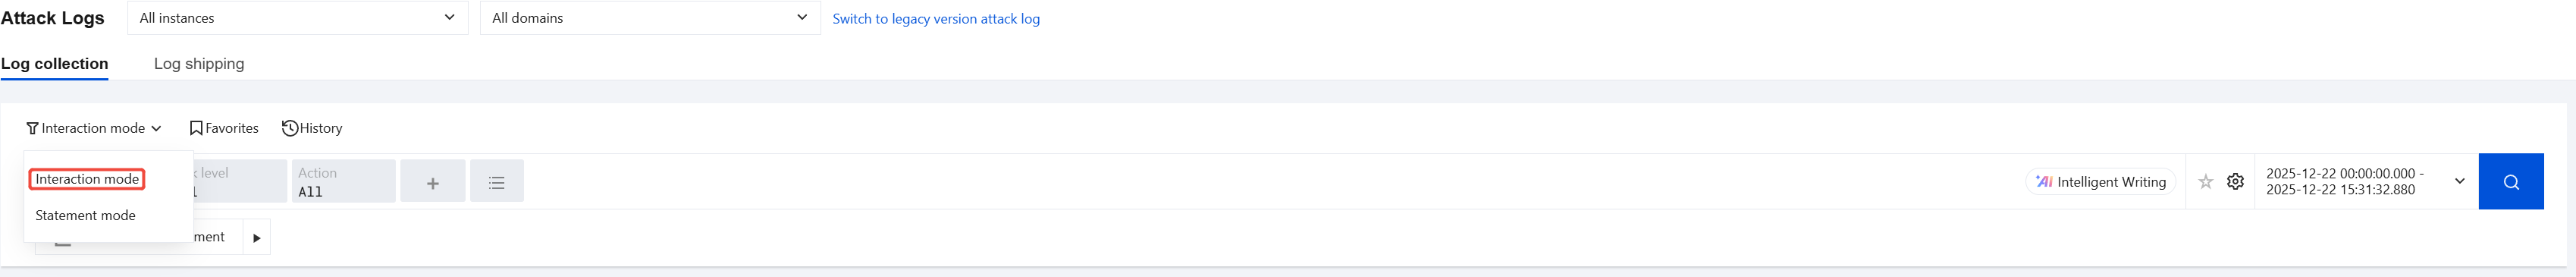
Interactive mode: Attack logs are searched based on the search criteria.
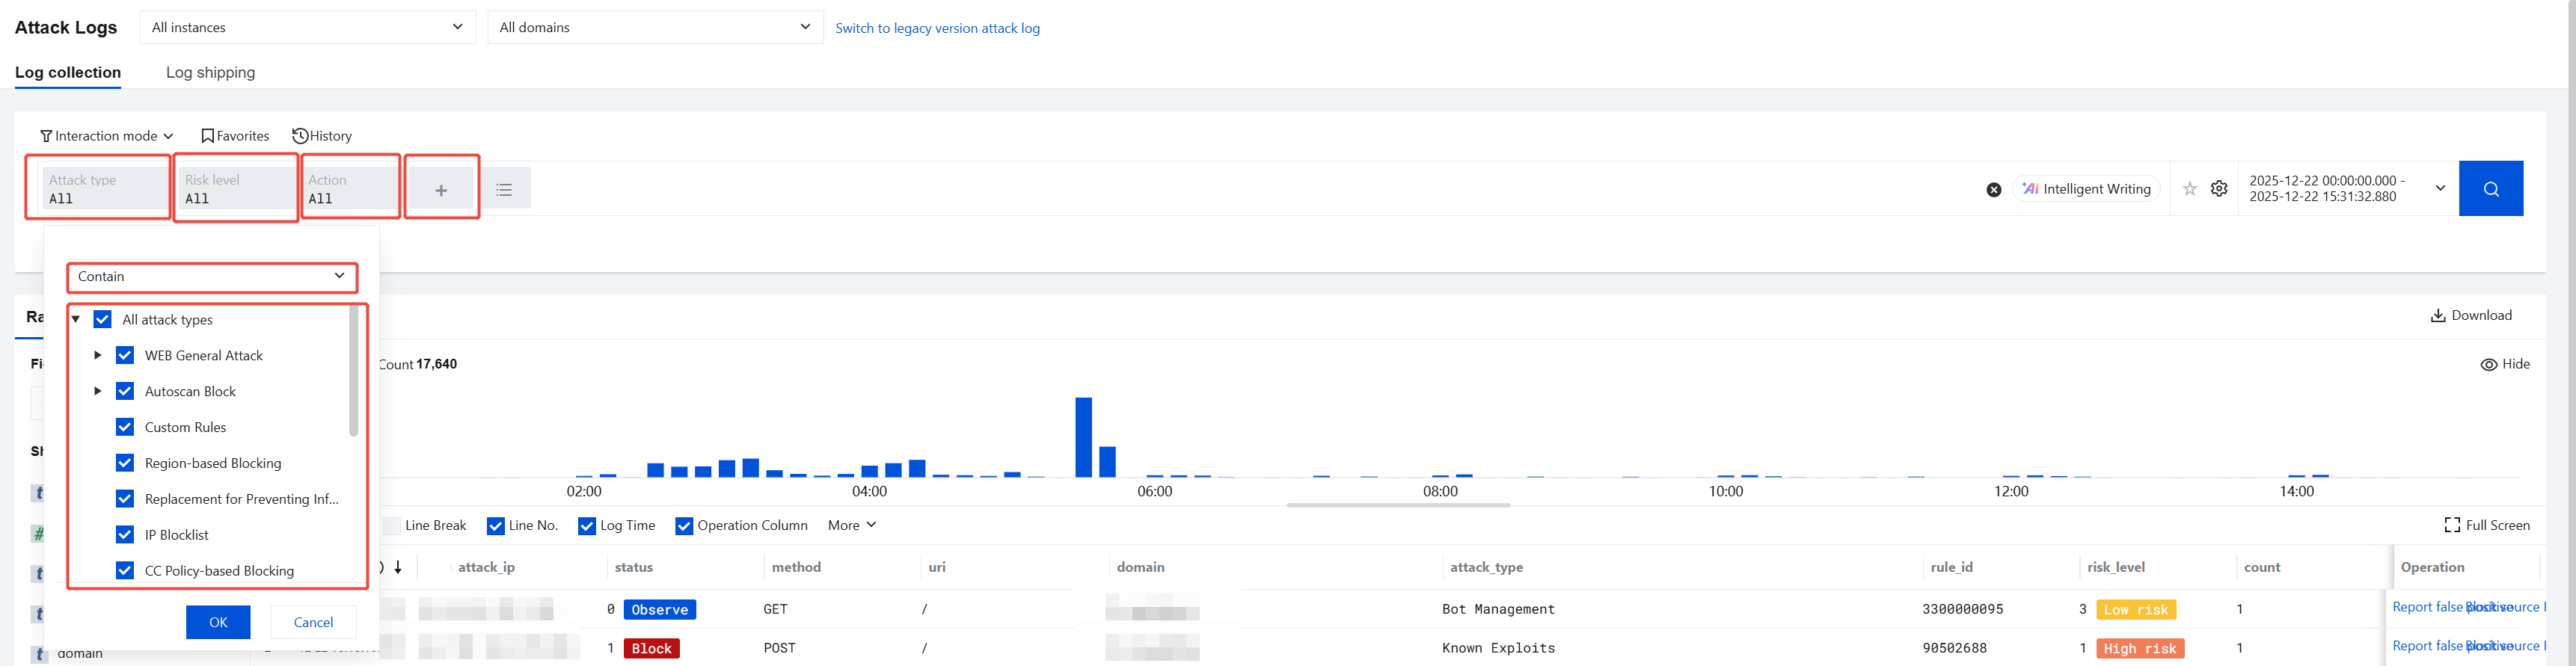
a. On the Attack Logs > Log collection page, choose Interactive mode.
b. You can search by setting logical relations and selecting log fields: either configure directly in preset conditions, or add custom conditions and then configure. For descriptions of the fields in the log details, see Field Descriptions for Log Details. Click OK.
c. Repeat the previous step until all search conditions are added, then click
.
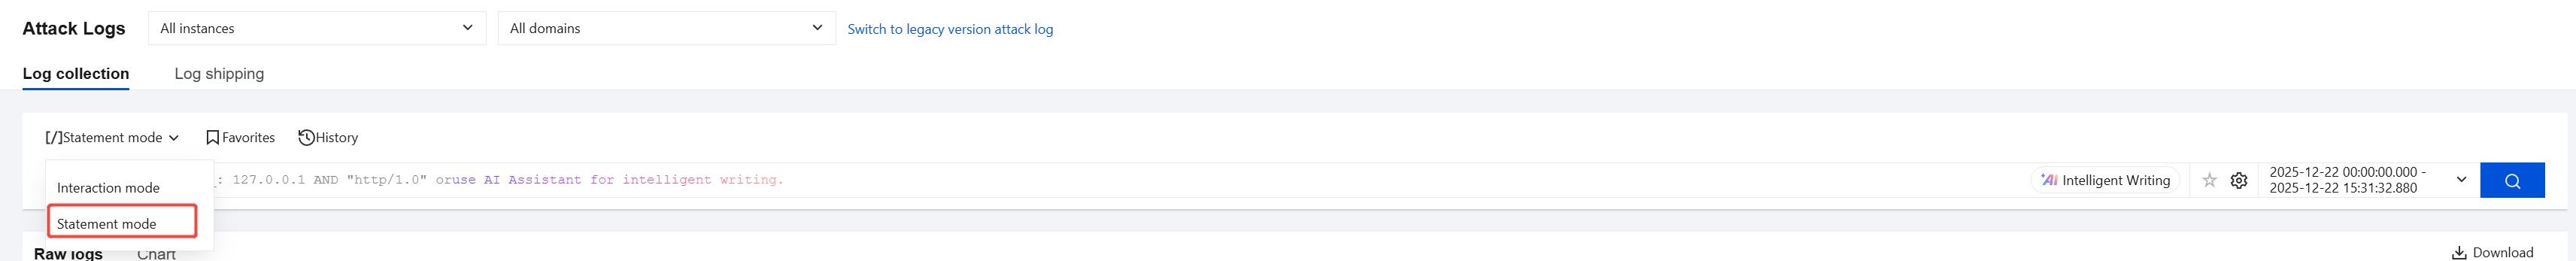
Statement mode: Attack logs are searched based on search statements.
a. On the Attack Logs > Log collection page, choose Statement mode.
b. You can write query statements in the following two ways:
Enter search statements directly in the statement box, and then click
to query. For details about search syntax, see Syntax and Rules.
Click Intelligent Writing beside the input box for query statements. Enter your query requirements, click Send or press the Enter key, and the system will generate the query statement for you.
Analyze Attack Logs
Raw logs
1. Log in to WAF console, in the left sidebar, select Attack Logs.
2. On the Attack Logs page, click Log collection > Rwa logs.
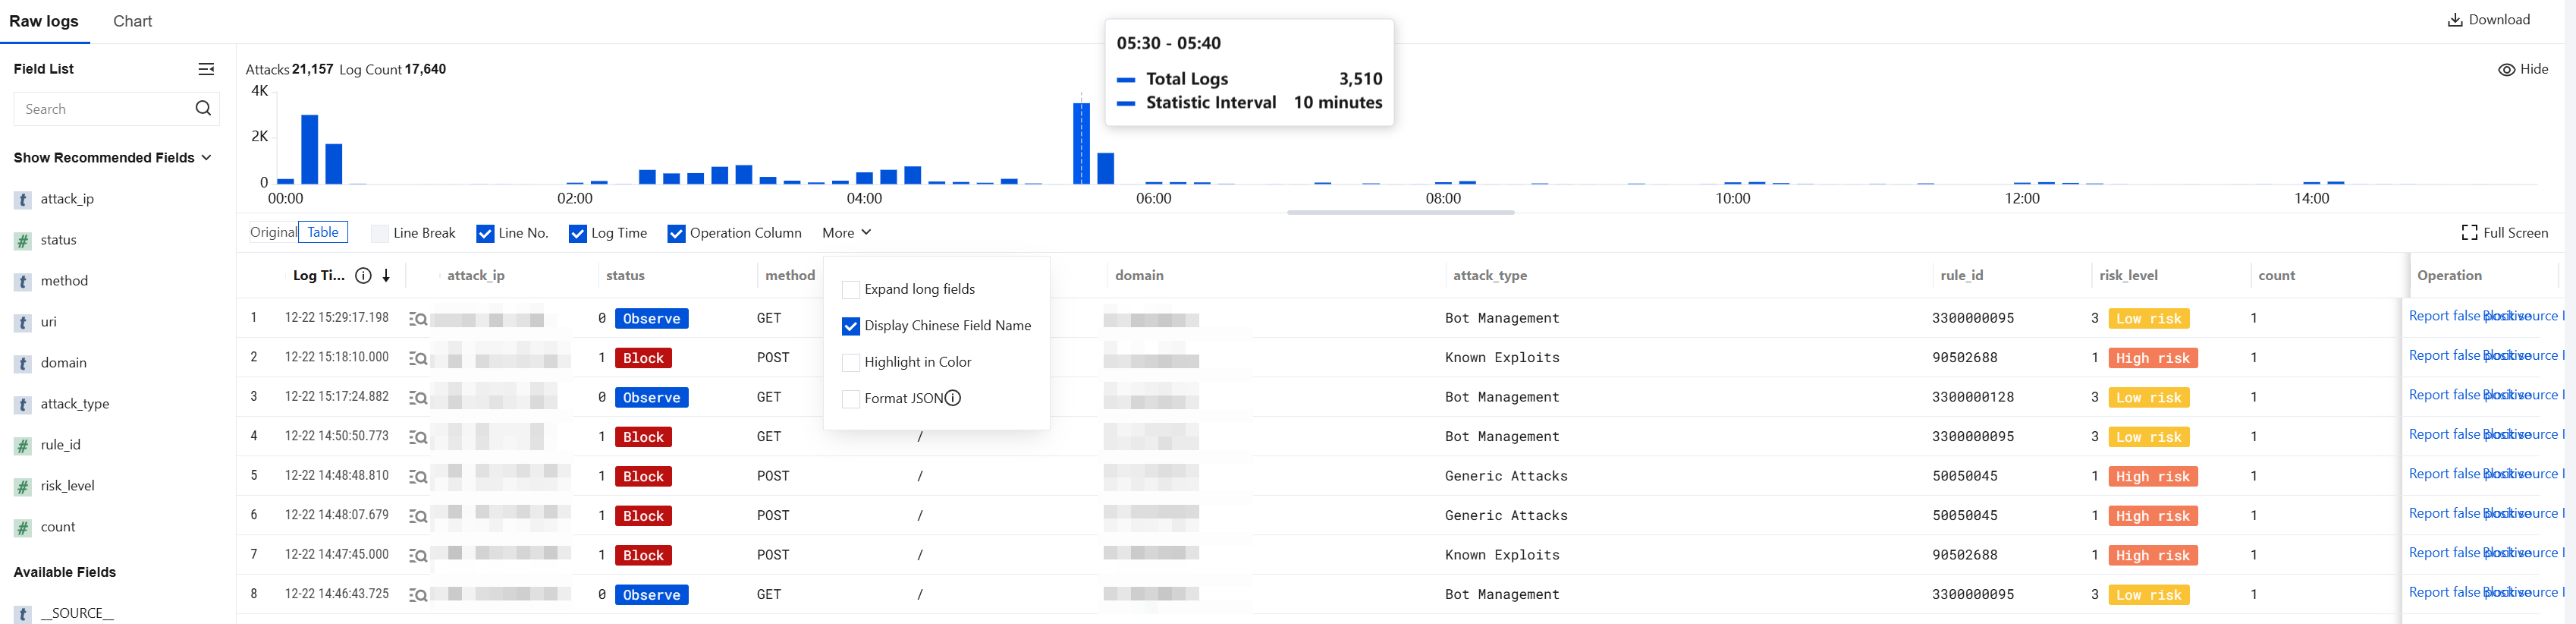
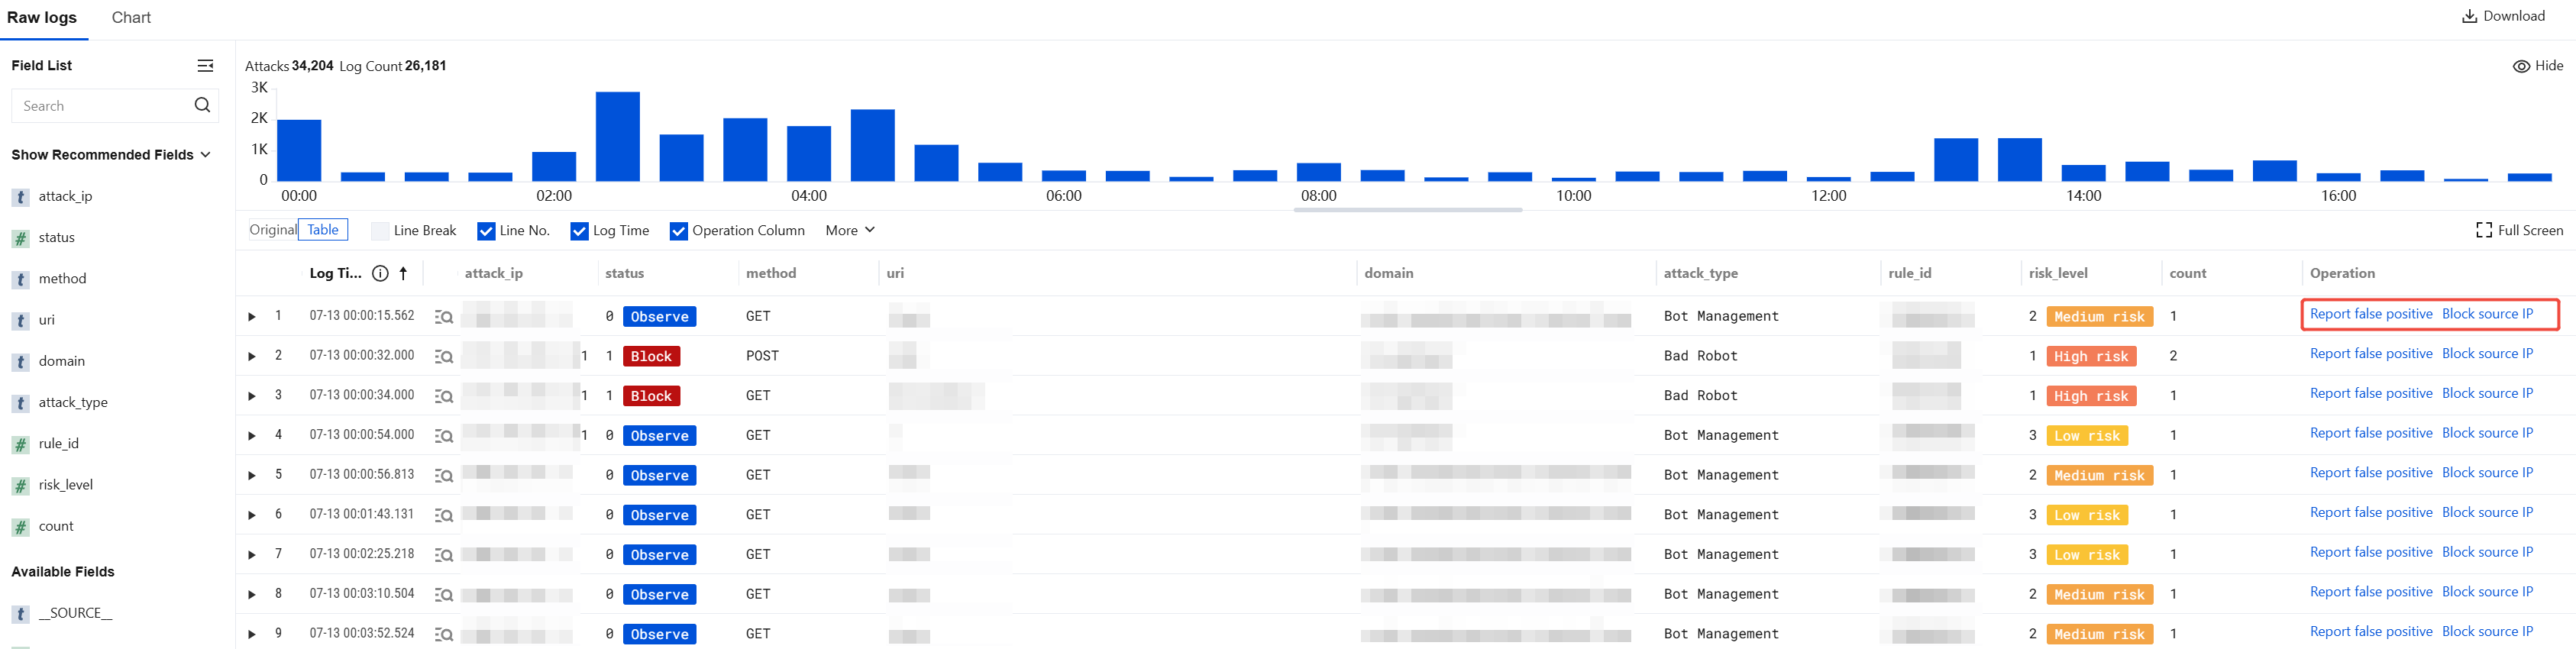
Above the Raw logs, you can view key information such as the total number of logs matching the current search conditions and their time distribution. You can also change the display style of Raw logs using the settings panel below.
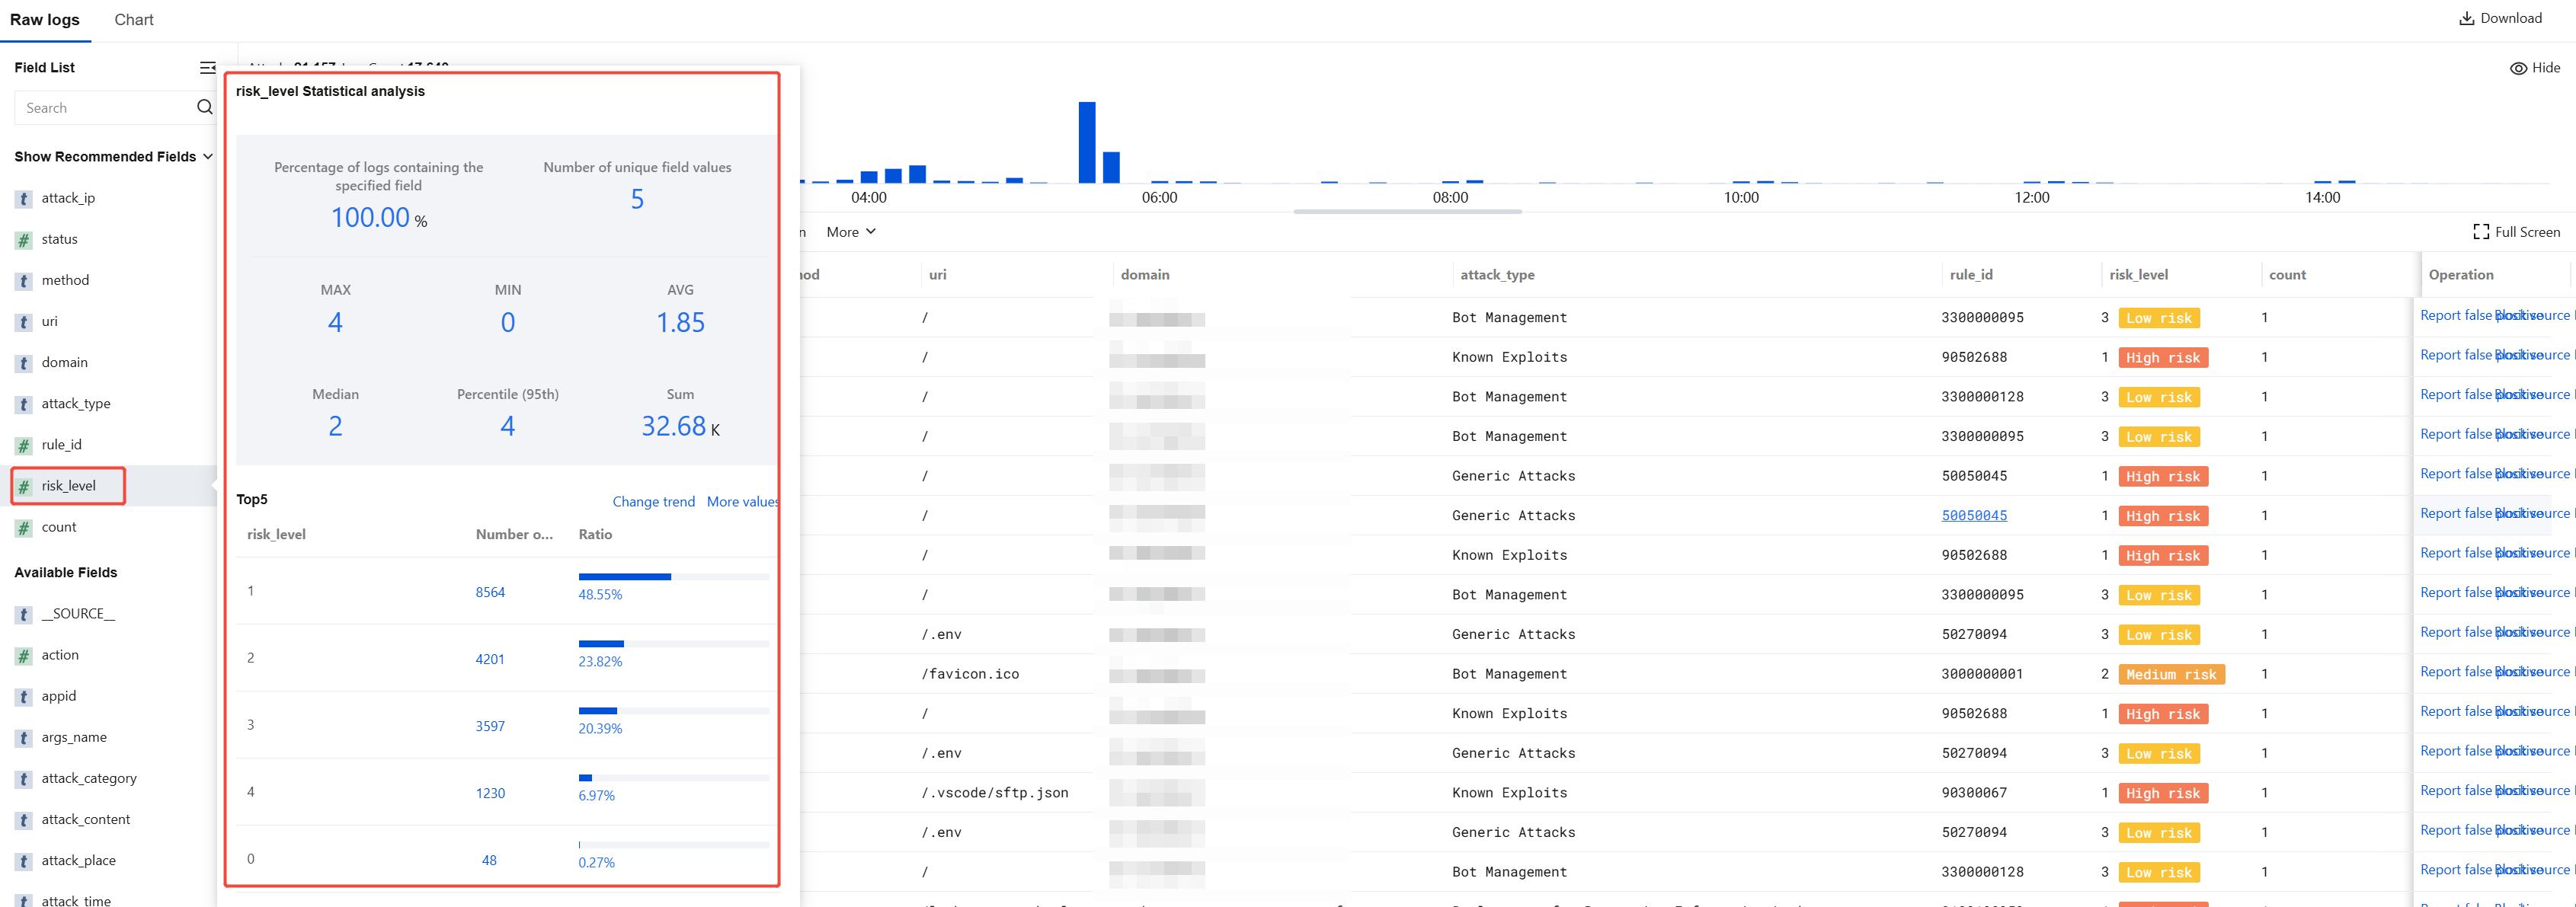
On the left of the raw log data list, click "field name" to display the TOP 5 matching field details sorted by the number of logs, along with their percentage of logs. For descriptions of the fields in the log details, see Field Descriptions for Log Details.
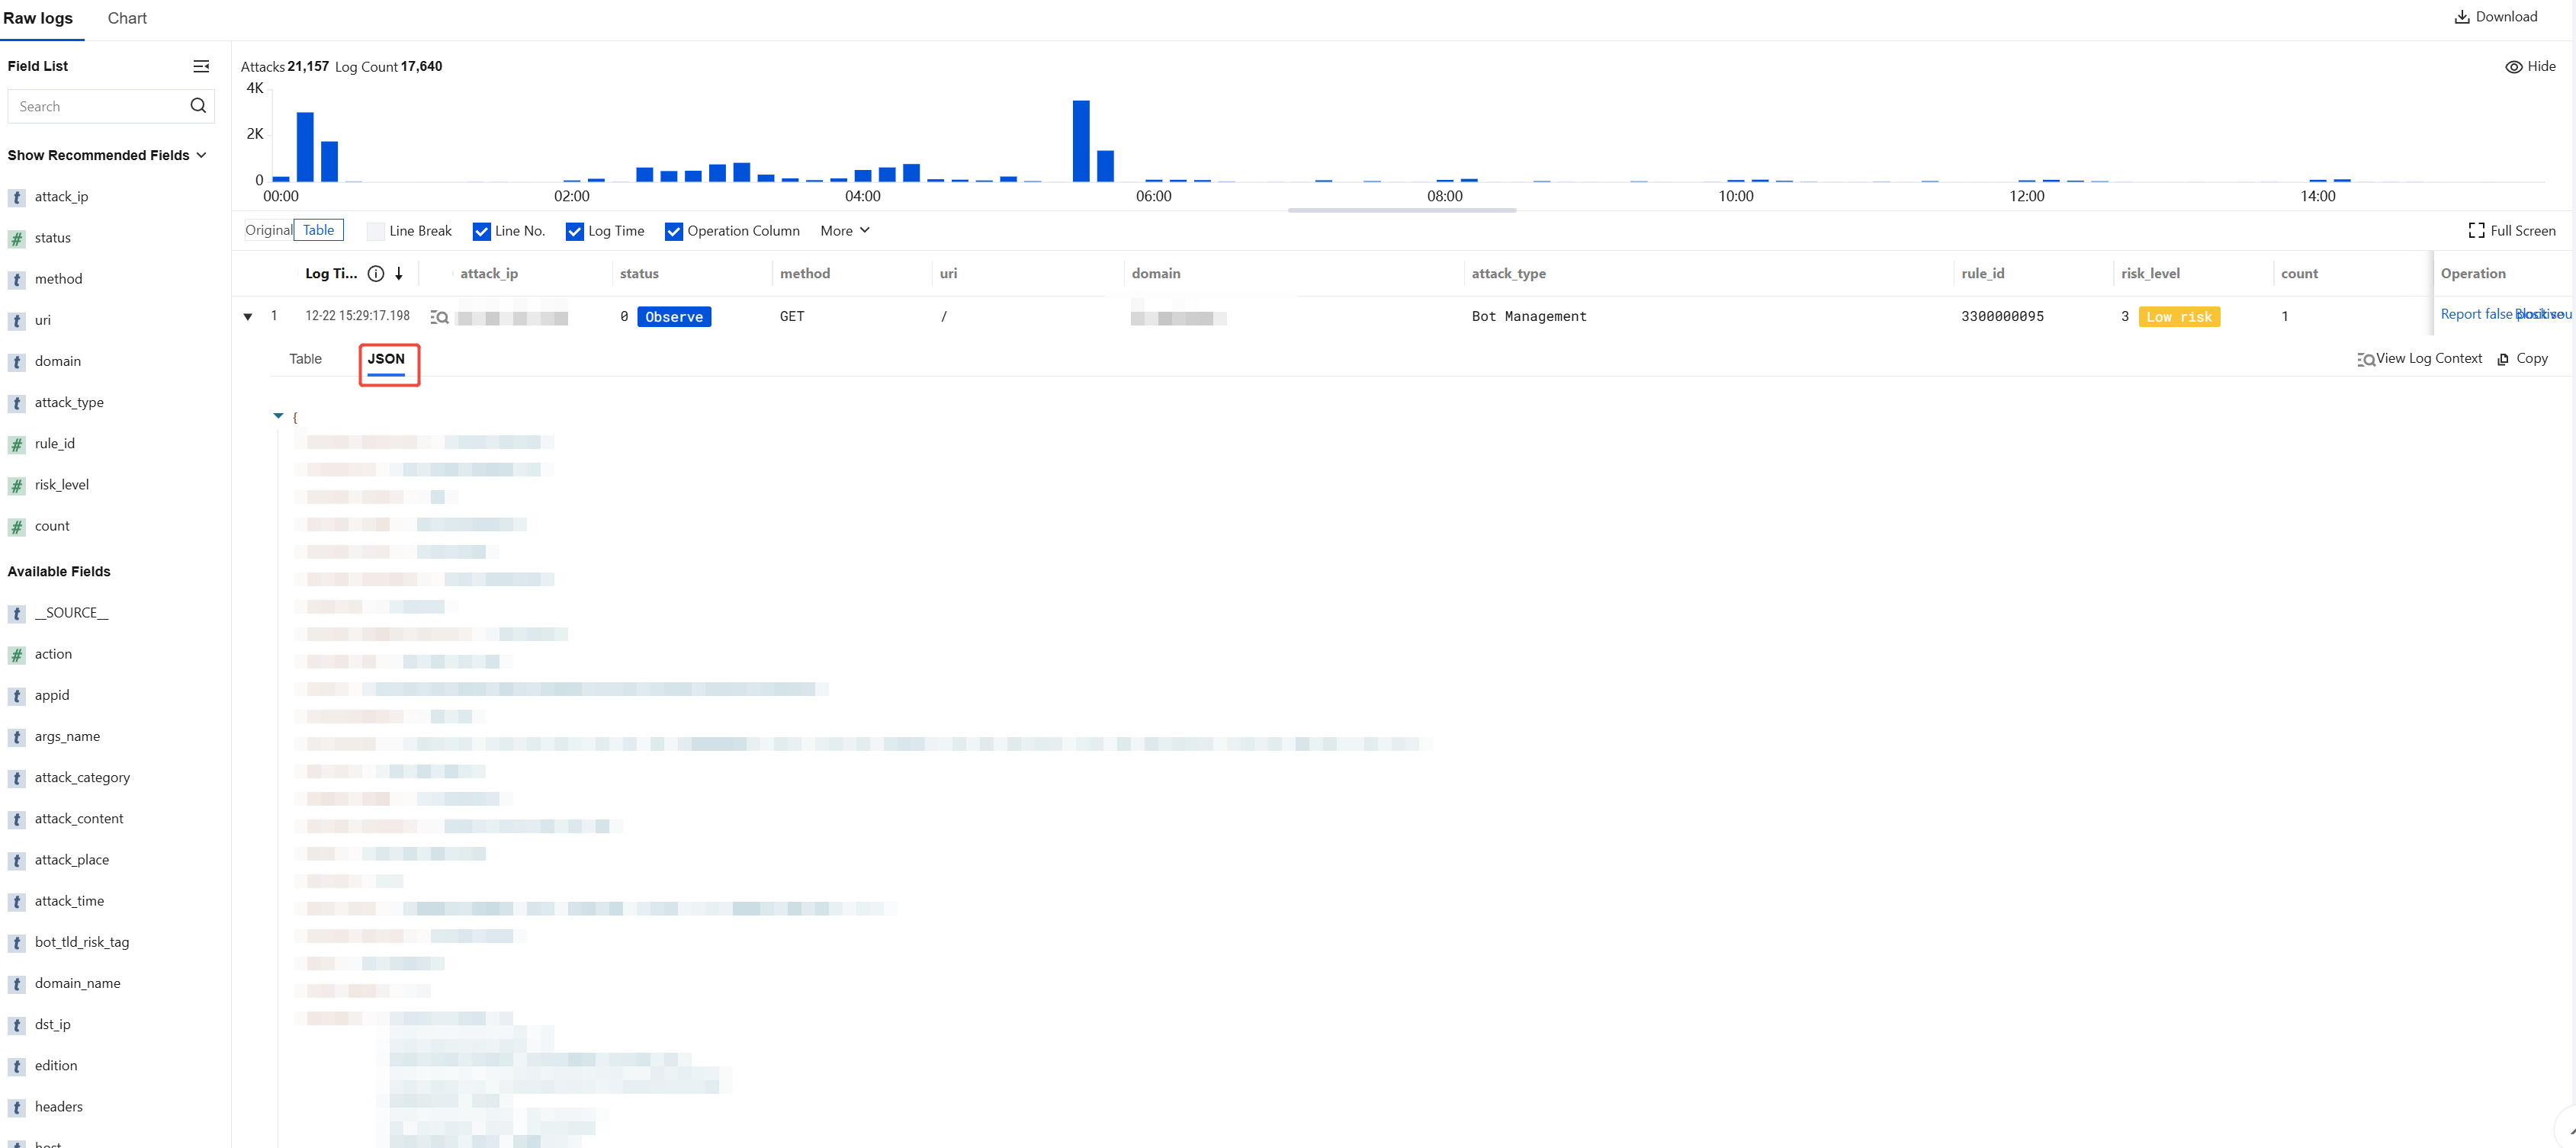
In the Attack Logs data list, click
to the left of the occurrence time of each displayed log to view field details; click JSON to view field details in JSON format. For descriptions of the fields in the log details, see Field Descriptions for Log Details.
Chart
1. Log in to WAF console, select Attack Logs in the left sidebar.
2. On the Attack Logs page, click Log collection > Chart.
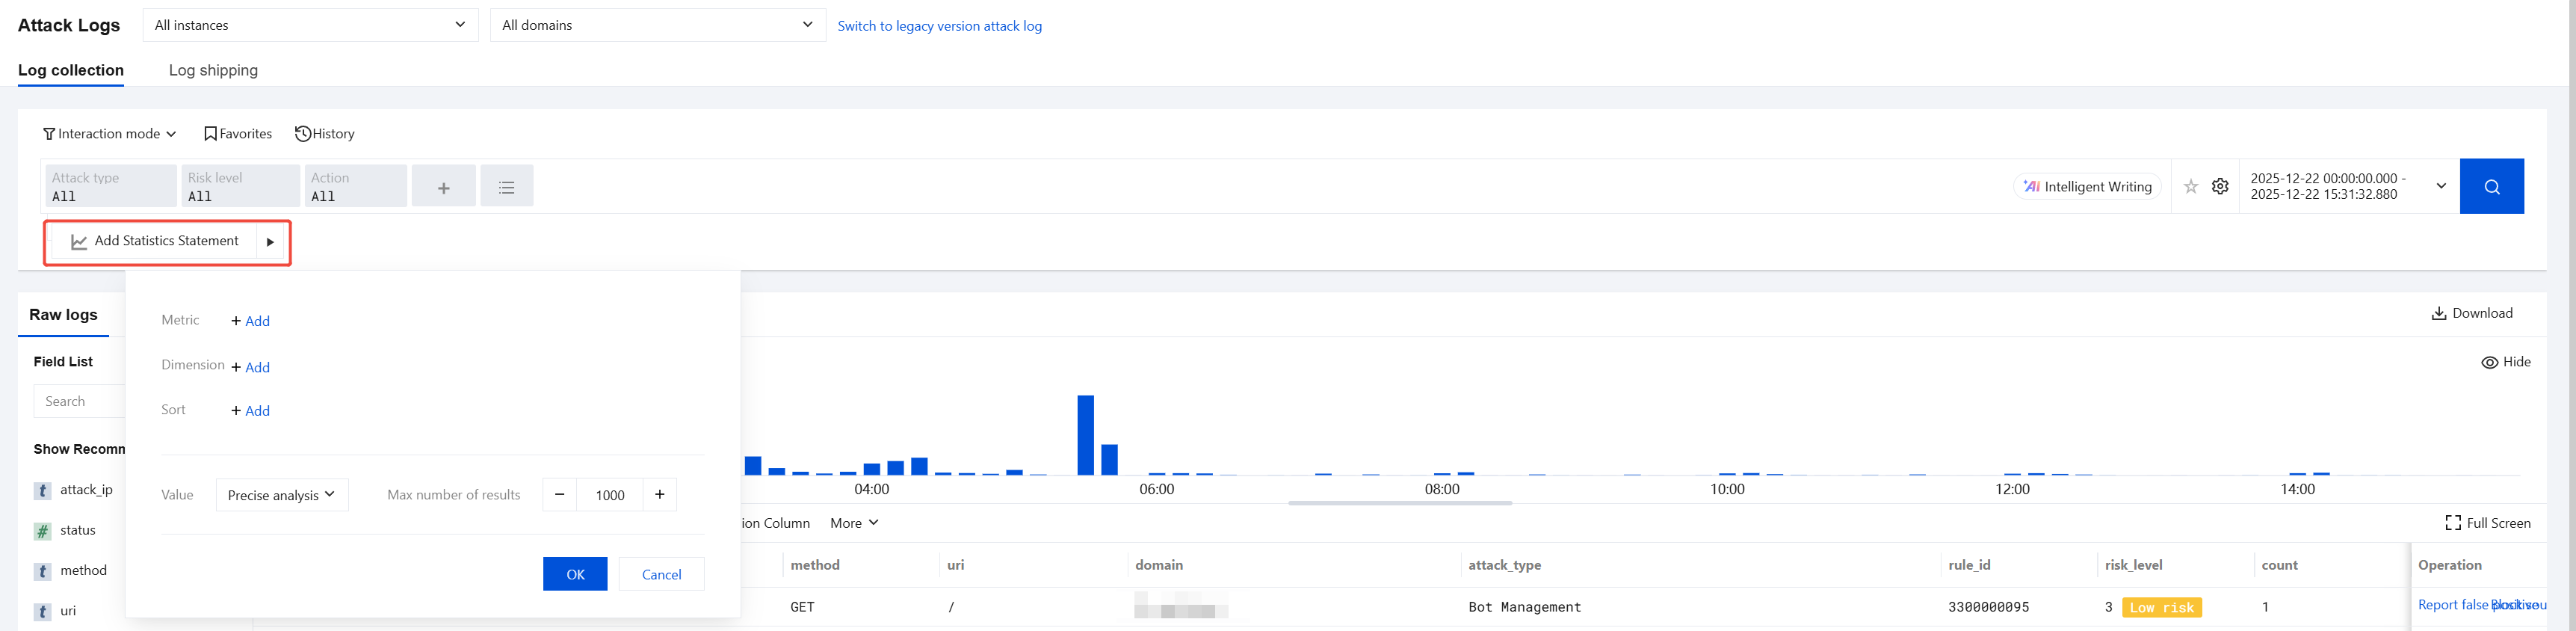
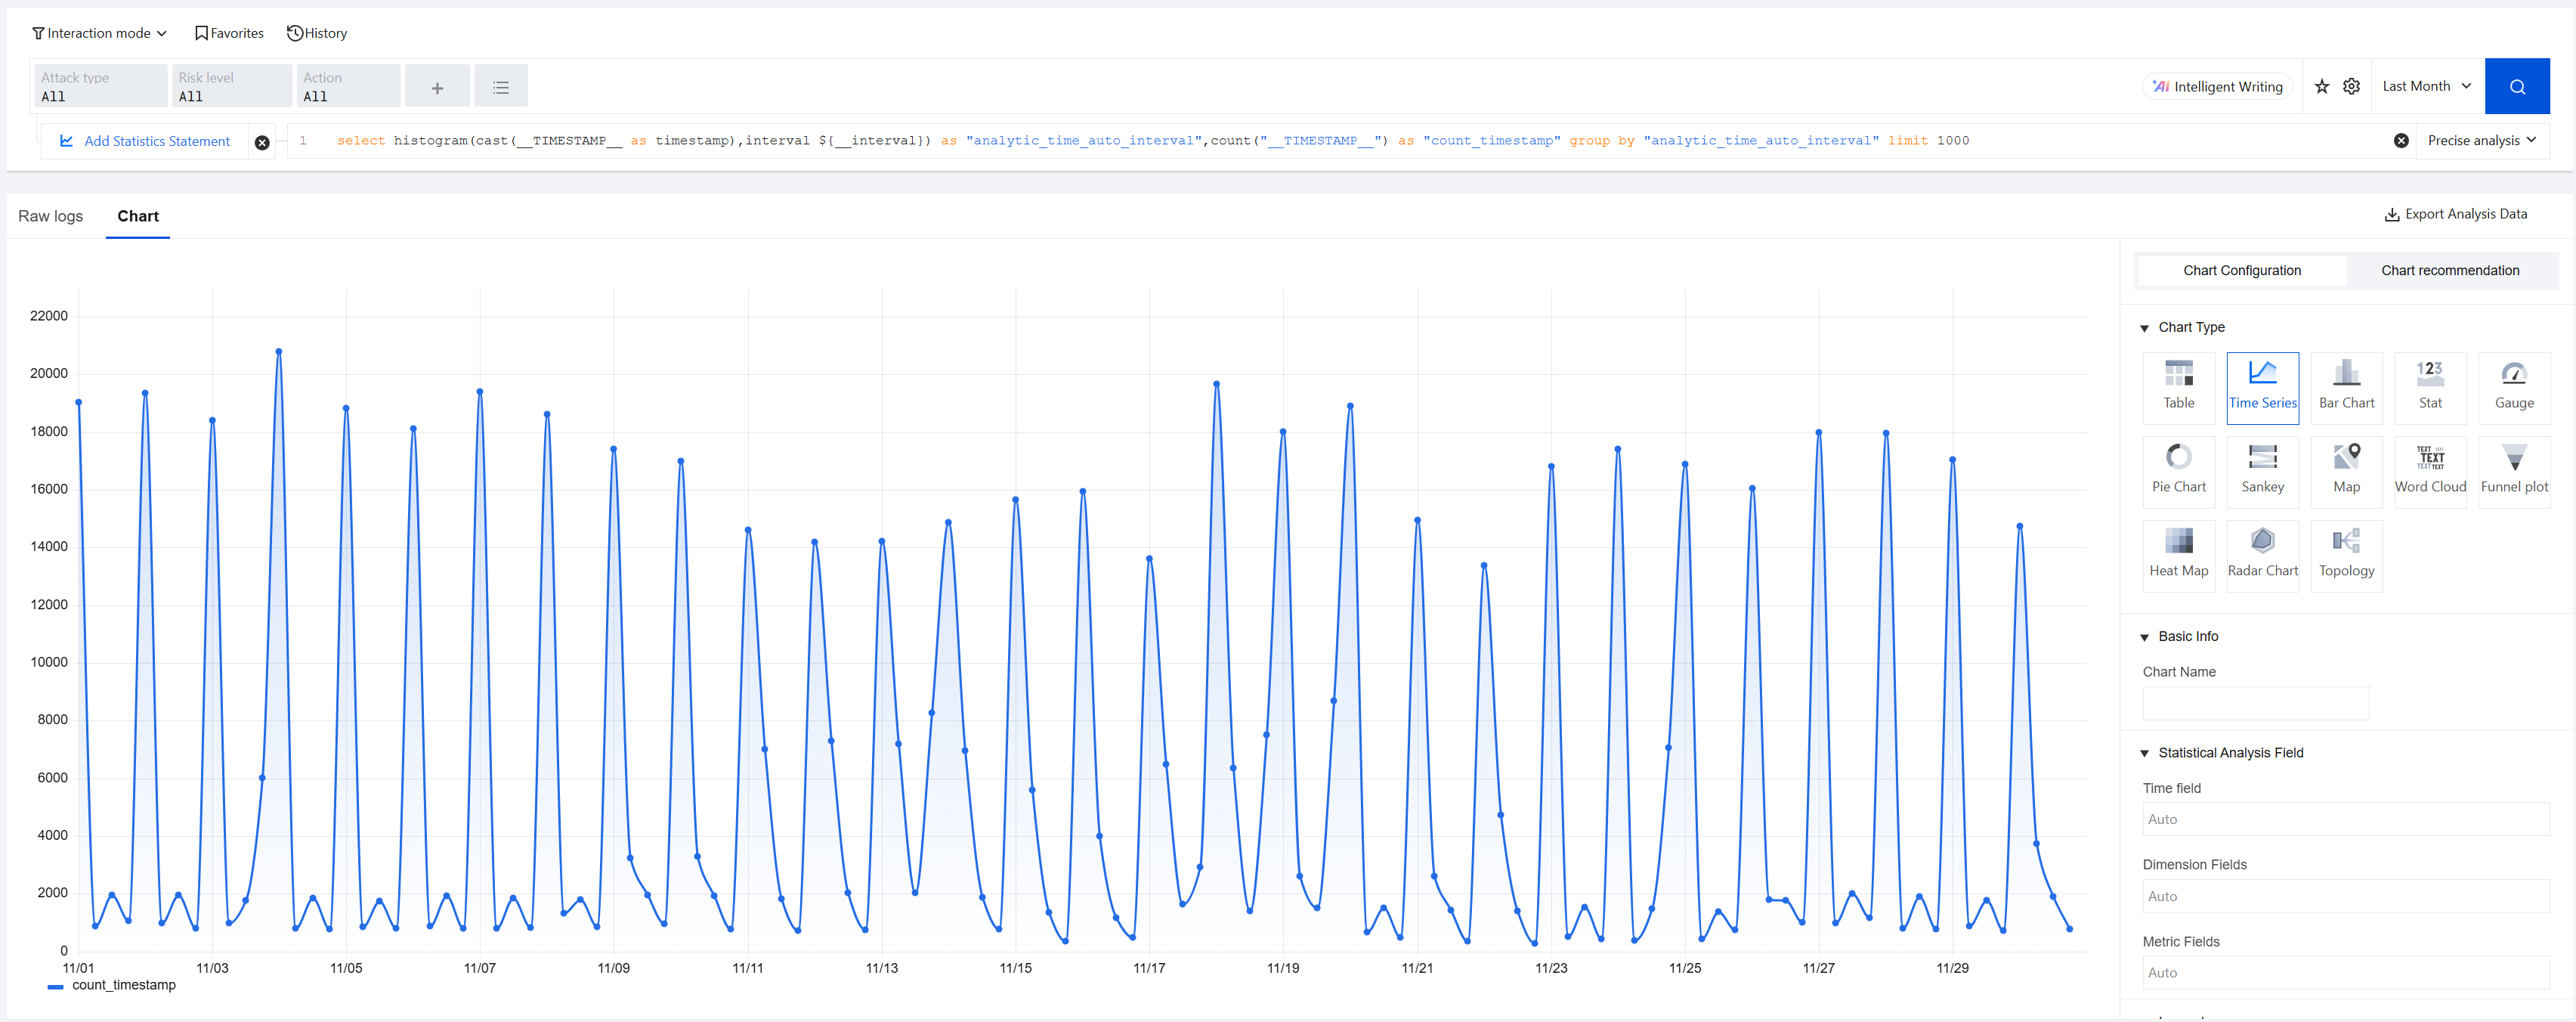
3. When generating charts, you can select:
Interactive mode: Generate charts by adding statistical statements. Click Add Statistical Statement, configure specific metrics, dimensions, sorting methods, and statistical approaches, set the maximum number of results returned, and click OK.
Statement mode: Directly use query statements to generate charts:
Enter search statements directly in the statement box, and then click
to query. For details about search syntax, see Syntax and Rules.
Click Intelligent Writing beside the input box for query statements. Enter your query requirements, click Send or press the Enter key, and the system will generate the query statement for you.
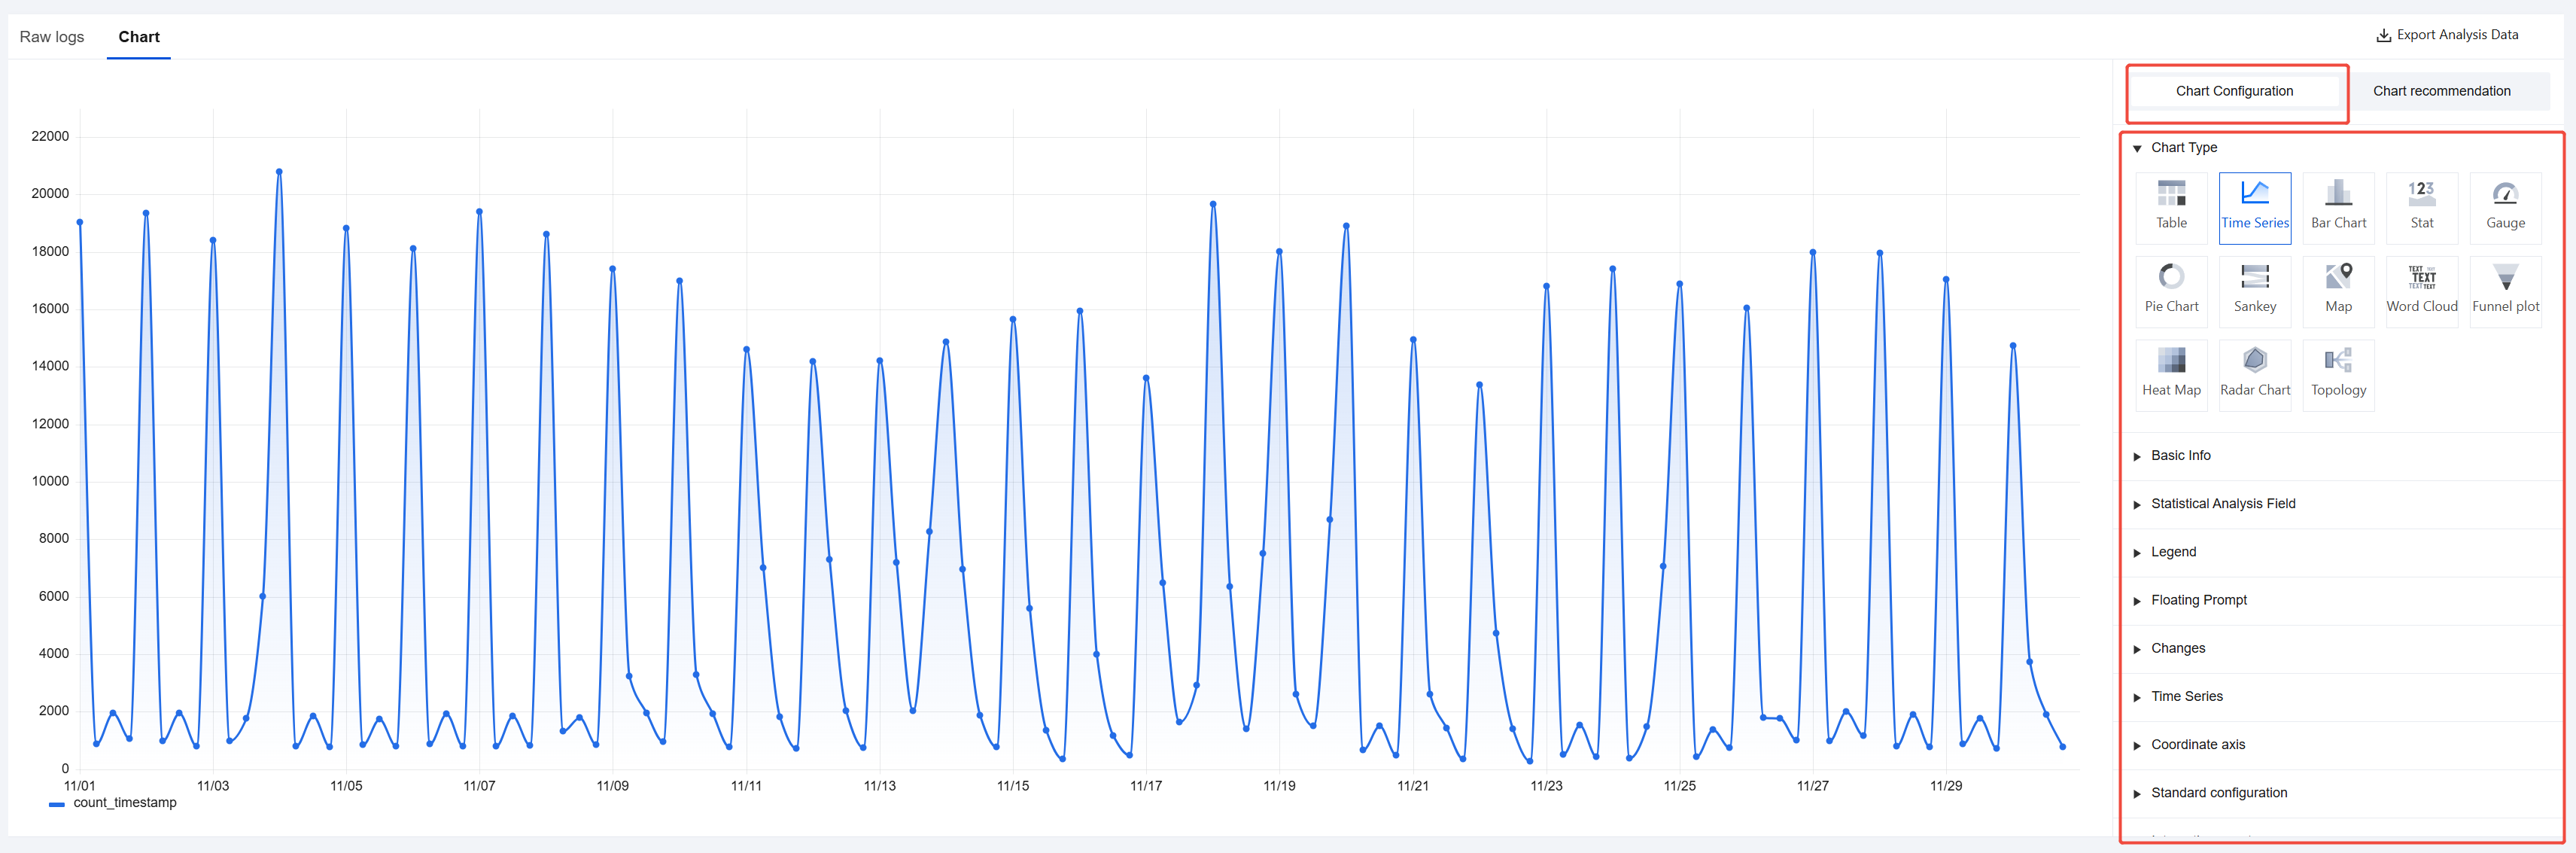
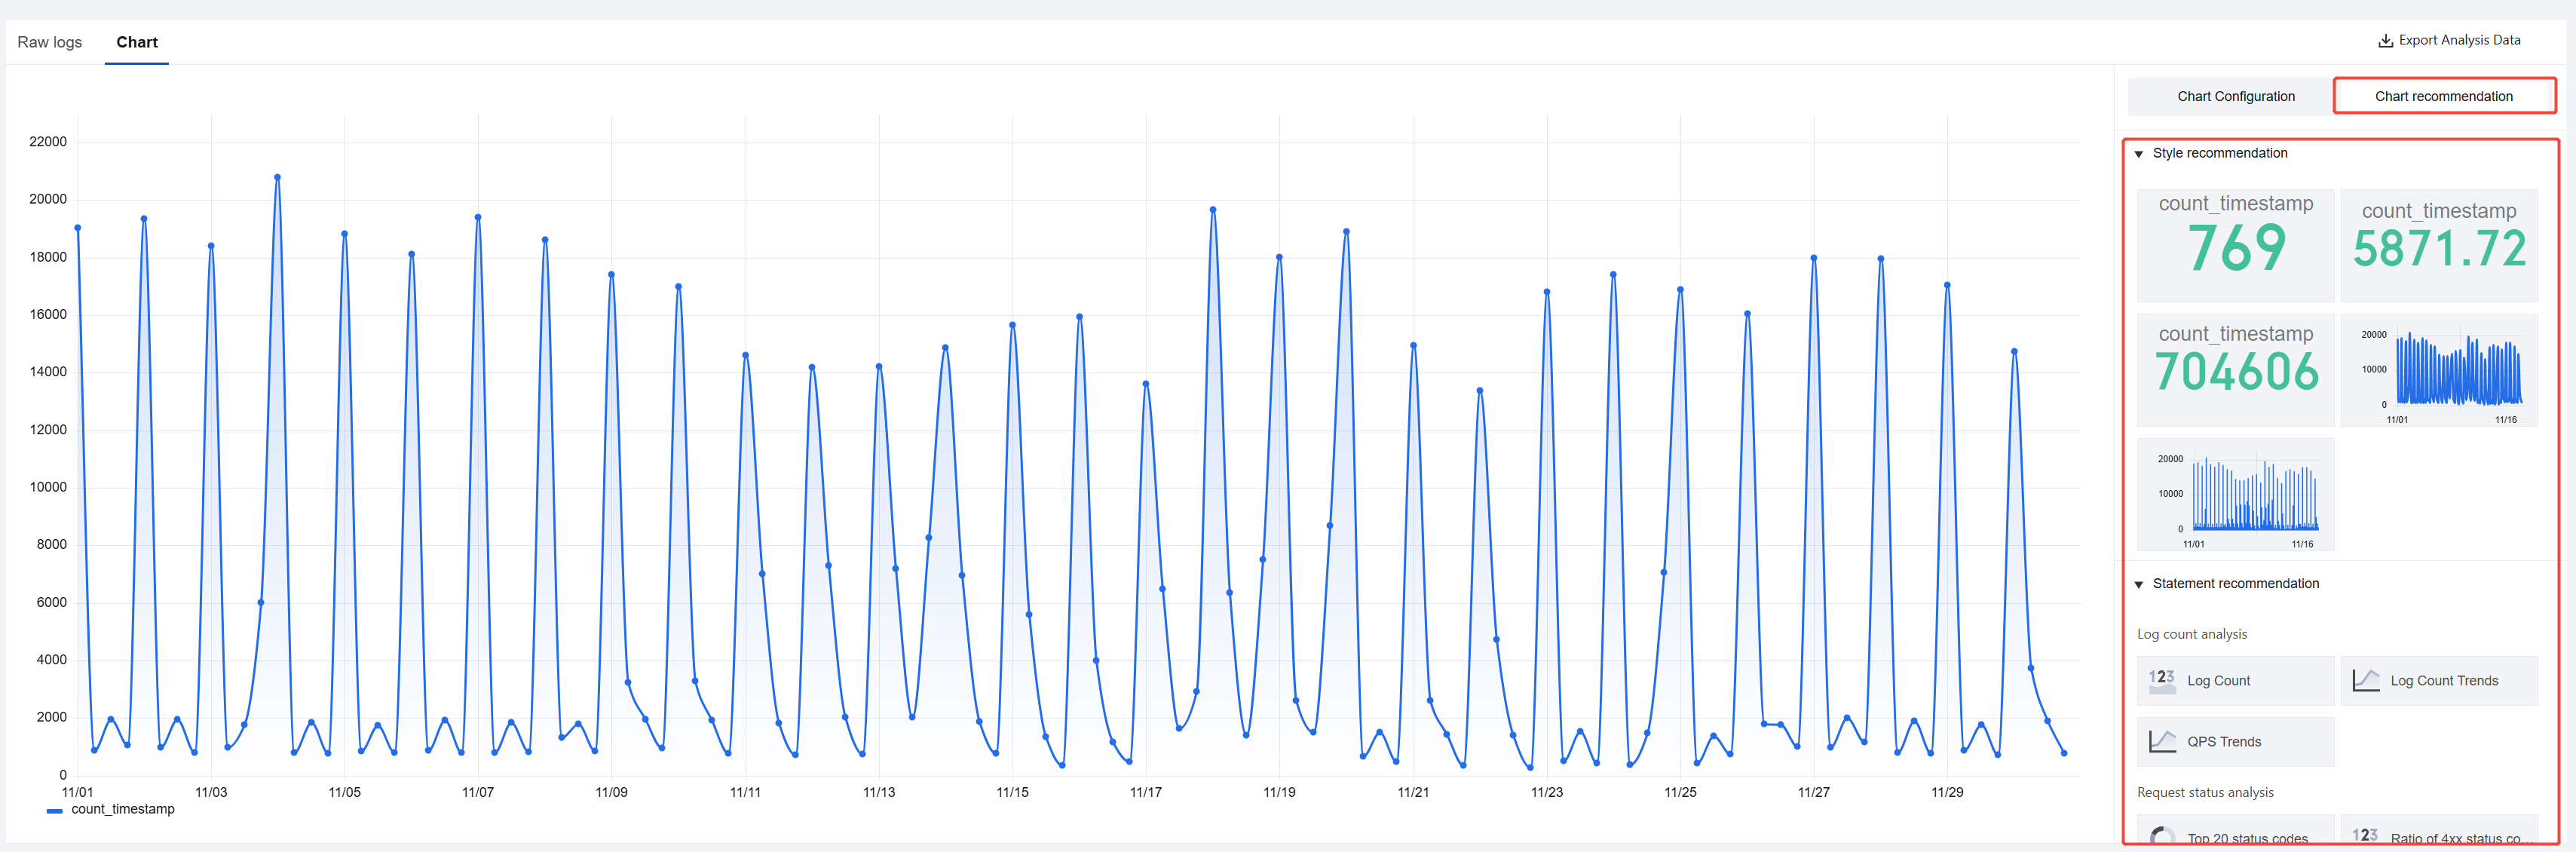
4. After the chart is generated, you can adjust its presentation through the following two methods:
In Chart Configuration, directly modify the chart type.
Use the styles or statement templates provided by Chart recommendation to quickly optimize the display.
Attack Handling
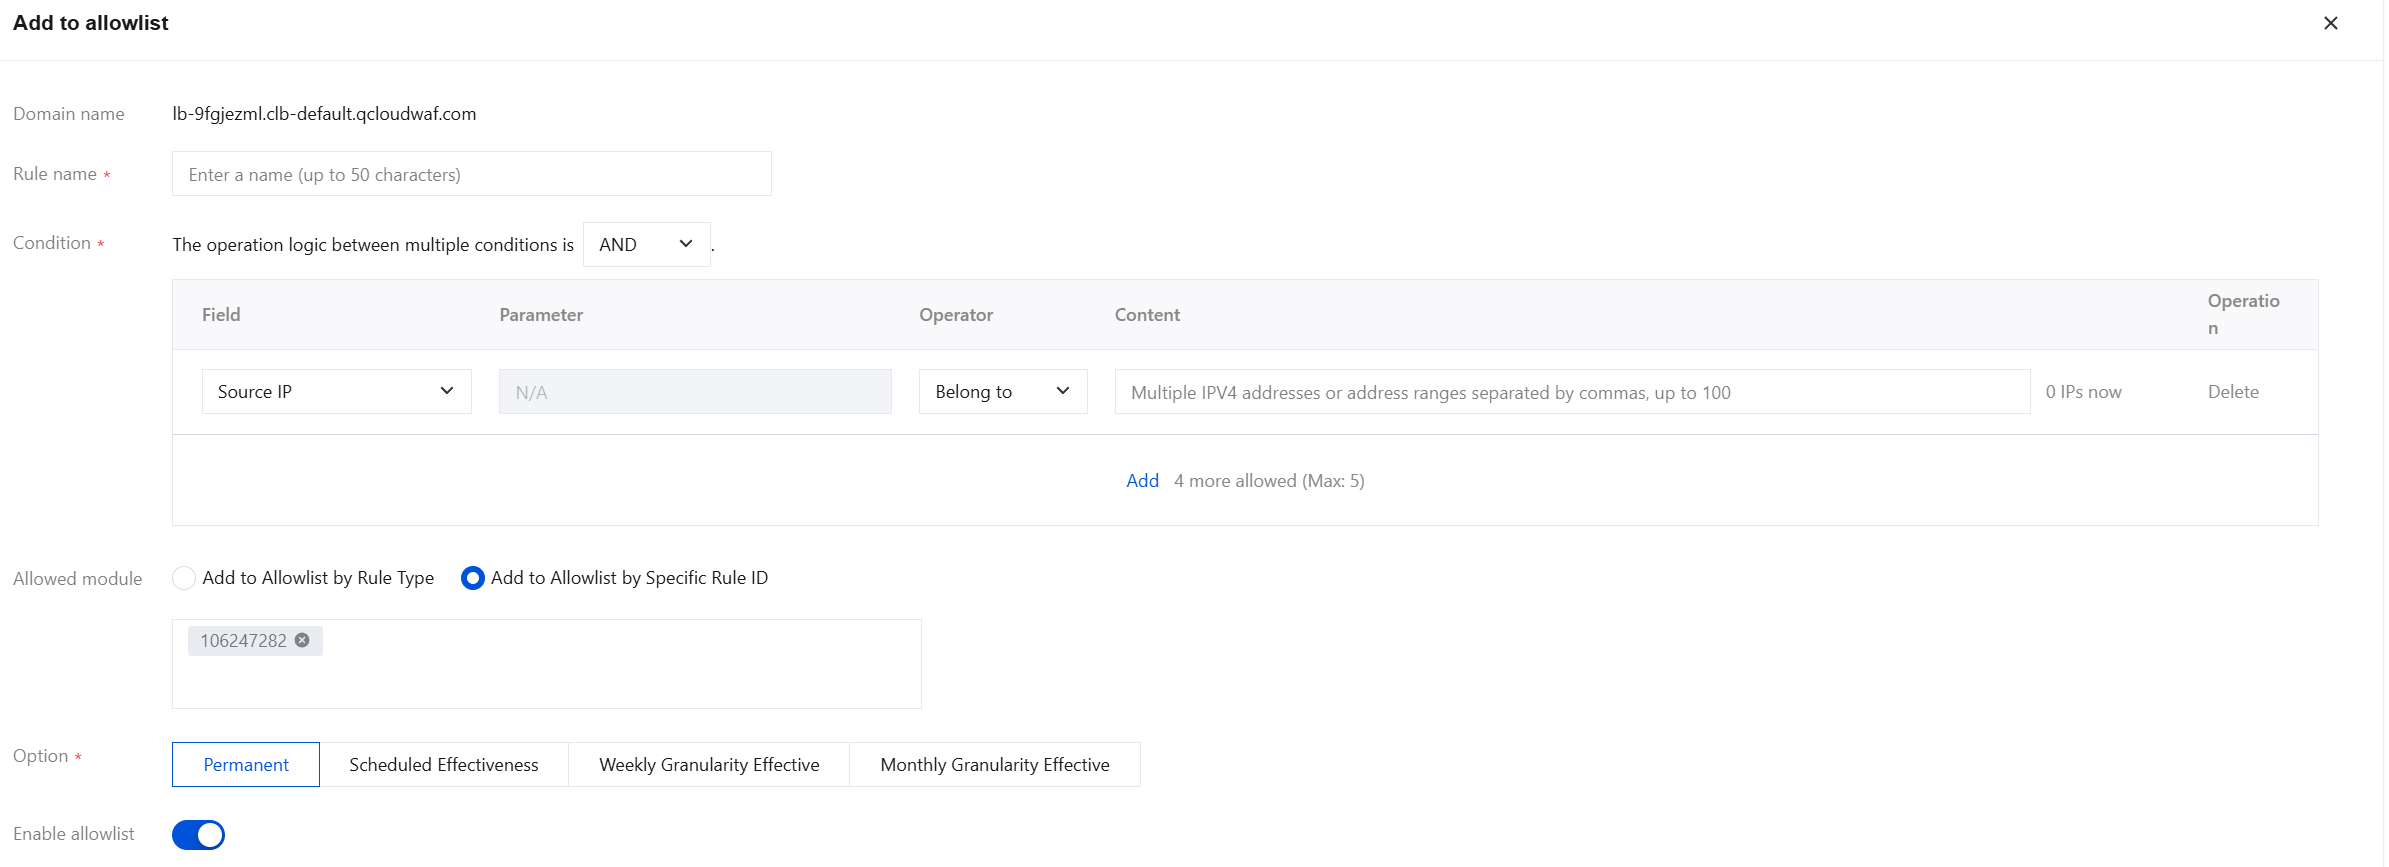
In the Attack Logs data list, you can click Report false positive or Block source IP in the operation column to quickly add handling rules.
Report false positive: Supports one-click addition of precise allowlist rules for the corresponding protection module, no longer blocking access from the corresponding IP address. After the modifications are completed, click OK.
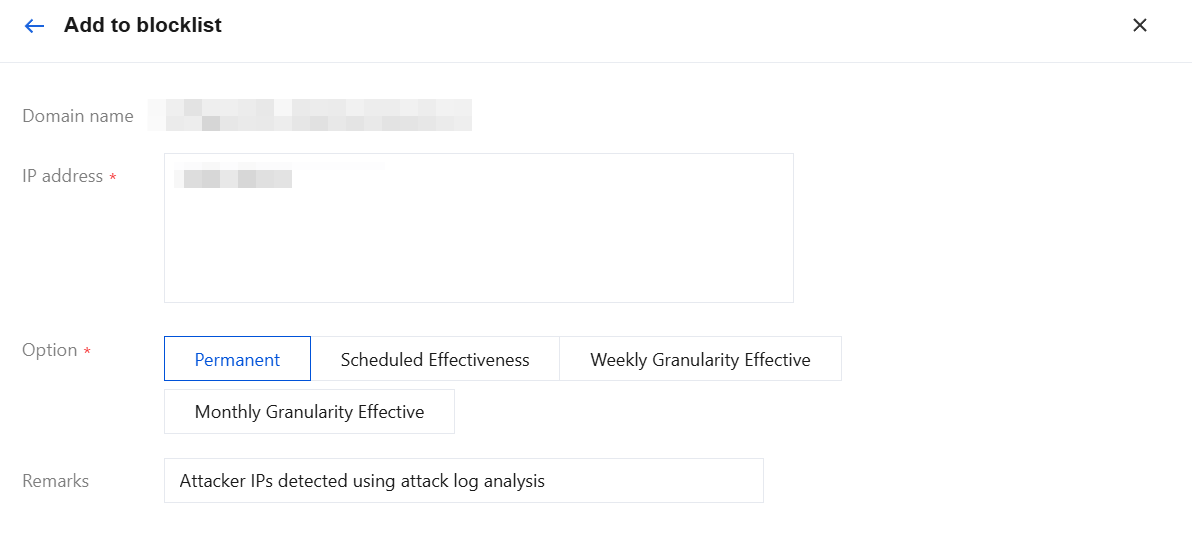
Block source IP: Supports one-click addition of IP blocklists to block access from the corresponding IP address. After completing the modifications, click OK.
Download Attack Logs
1. Log in to WAF console, select Attack Logs in the left sidebar.
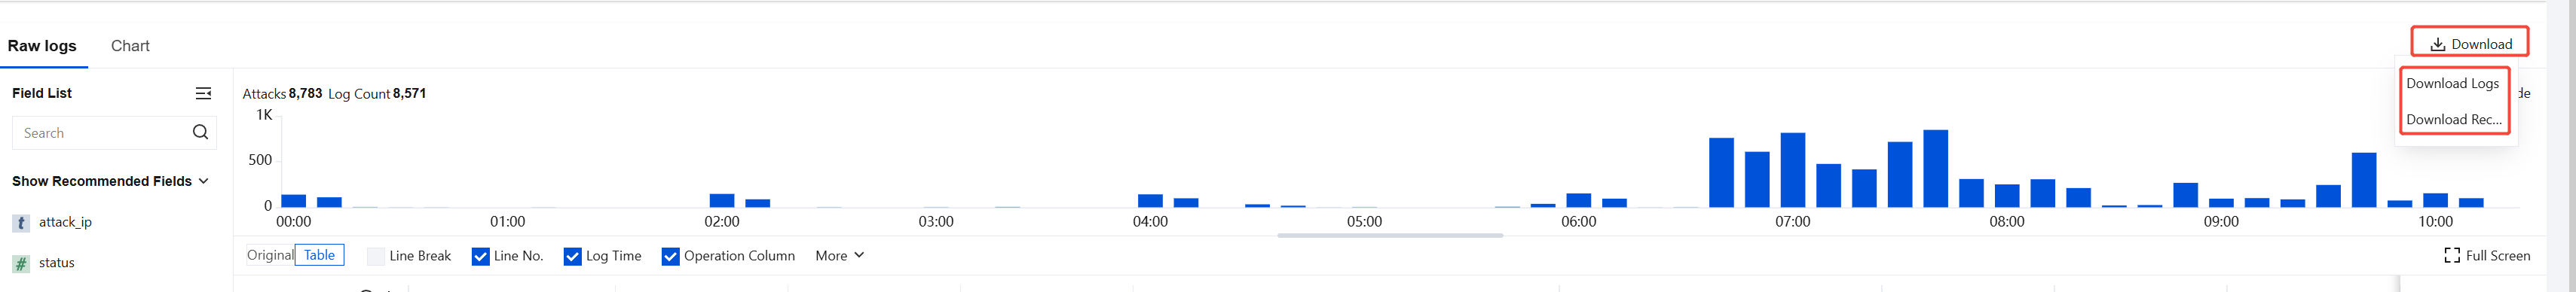
2. On the Attack Logs page, click Log collection > Raw Logs.
3. In the upper-right corner of the Raw logs data list, click
to slide out the download tasks page.
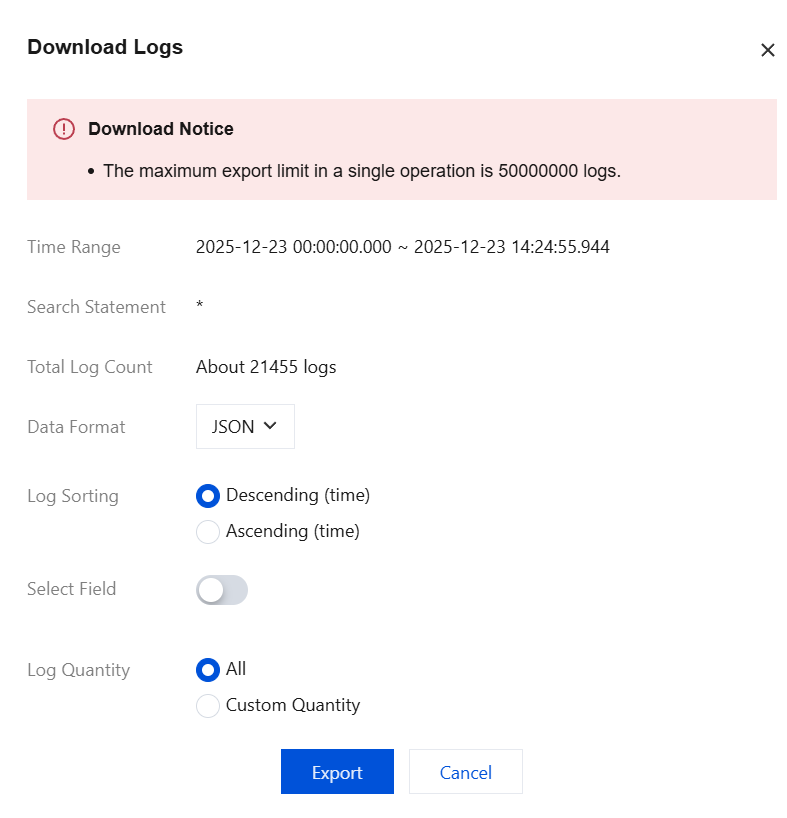
Click Download Logs to go to the download logs data page. Configure options such as data format, log sorting, selected fields, and log quantity as needed, then click Export.
Note:
The scope of logs for the current search is downloaded by default.
Only one download task can be created within the same time period. Please wait patiently.
A maximum of 50 million logs can be downloaded in a single task. If you need to download more than 50 million logs, we recommend that you split the download into multiple tasks.
When a wildcard domain (such as: *.abc.com) is selected, logs from all associated subdomains (ending with .abc.com) will also be downloaded.
A maximum of five download tasks can be created. Please note the number of download tasks.
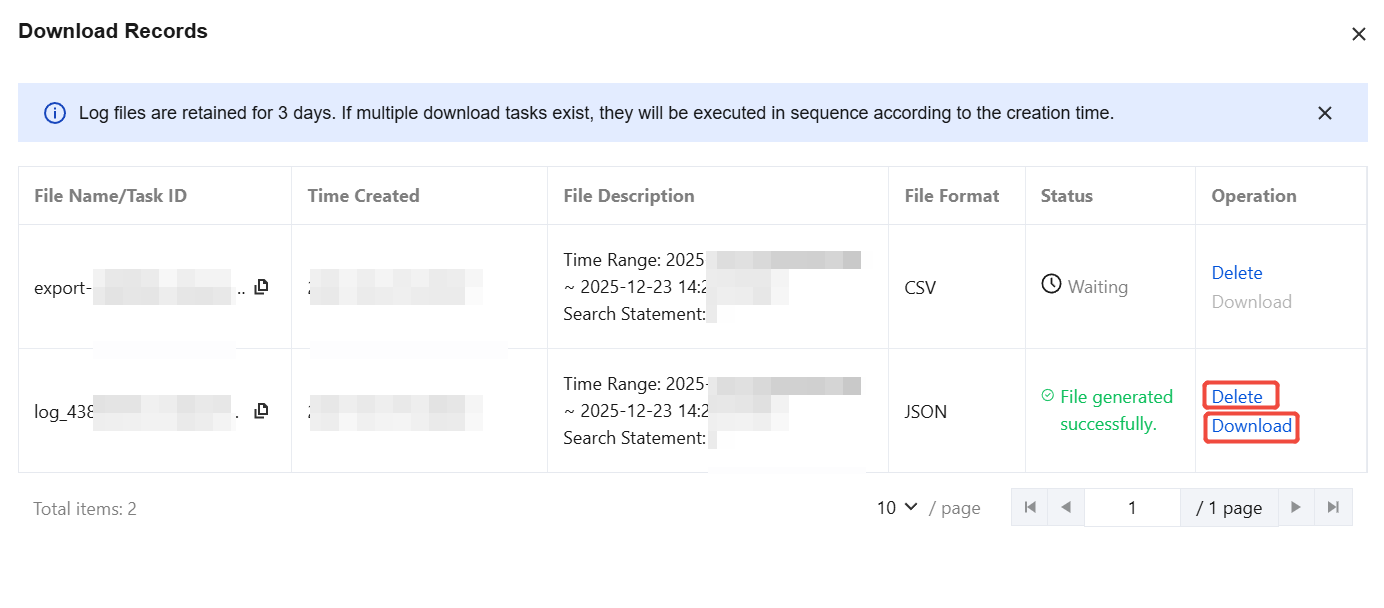
Click Download Records to go to the download records page. Here, you can view all information related to download tasks and perform delete or download operations on completed download tasks.
Note
Successfully created log download tasks are retained for 3 days. Log files will be deleted after 3 days. Please download them in a timely manner.
Log shipping
Log delivery supports all attack log field data currently collected by the WAF engine. Users simply need to configure it in the WAF console to enable a near real-time delivery service for attack log data. For details about log delivery, see Log Shipping.
Appendix
Field Descriptions for Log Details
Field Name
Field Description
Example Value
host
The information of the domain name accessed by the client.
lb-example
url
Request URI: a string used to identify the requested resource.
/about-us
attack_ip
Attacker IP address: the source IP address of client attacks.
1.1.1.1
attack_type
Attack type: the specific attack type that the attack hit.
XSS Attacks
rule_id
Rule ID: the rule ID that triggers the protection policy. For attack details detected by the AI engine, the rule ID is 0.
10000244
scene_id
Scenario ID: the ID of the scenario that triggers the protection policy.
10000111
scene_module
Scenario module: the scenario module that triggers the protection policy, including frontend countermeasure (jsinject), custom rules (ucb), and intelligent analysis (autoanalyze).
jsinject
method
Request method: the request method of client attacks.
GET
user_agent
Attacker IP: information such as the browser type and operating system identification declared to the server by the attacker's IP address.
Mozilla/5.0 (Macintosh; Intel Mac OS X 10_14_0) AppleWebKit/537.36 (KHTML, like Gecko) Chrome/72.0.3626.119 Safari/537.36 (contact:menshen)
risk_level
Risk level: the risk level triggered by client attacks, including high-risk (1), medium-risk (2), and low-risk (3).
1
status
Execution status: the disposition result of the attack request, including Observe (0), Block (1), CAPTCHA (2), and Redirect (3).
1
count
Number of attacks: the number of attacks aggregated every 10 seconds for the same attacker's IP address and attack type.
1
domain
Domain name information for client attacks.
lb-example
pan
Access domain name or information of CLB objects.
lb-example
domain_name
The information of the domain name accessed by the client.
lb-example
attack_time
Attack time: the time when the client-side attack is triggered.
2025-06-23T11:55:42+08:00
attack_place
Attack location: the location within the HTTP request where the attack occurs.
Parameter
action
Action taken: the action taken in response to client-side attacks, including Observe (0), Block (1), CAPTCHA (2), and Redirect (3).
1
ipinfo_nation
Country of origin for the attacker IP address.
China
ipinfo_province
Province information for the attacker's IP address.
Guangdong
ipinfo_city
City of origin for the attacker's IP address.
Dongguan
ipinfo_state
Country of origin for the attacker's IP address, in ISO country code format.
CN
ipinfo_dimensionality
Latitude information for the attacker's IP address.
22.79327
ipinfo_detail
Details of the access IP.
-
instance
Name of the WAF instance associated with the domain.
waf_examplename
attack_category
Level 1 attack category not available.
Web generic attack
edition
Types of WAF instances for domain access: include sparta-waf (SaaS-based WAF) and clb-waf (CLB-based WAF).
Handling action: the enforcement action triggered by client-side attacks, including four outcomes: Observe (0), Block (1), CAPTCHA verification (2), and Redirect (3).
1
request_time
Request time: refers to the time taken for a client request to reach WAF and return from WAF. Unit: second.