本文主要讲述在监控仪表盘中,进入指定房间后您可通过通话详情页获取什么数据信息。
操作步骤
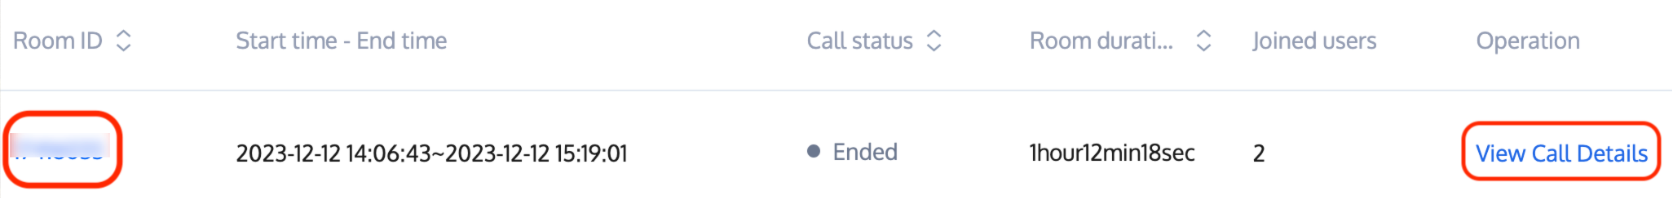
2. 单击房间 ID(Room ID) 或右侧的查看通话详情(View Call Details),进入通话详情页。
信息解读
基本信息
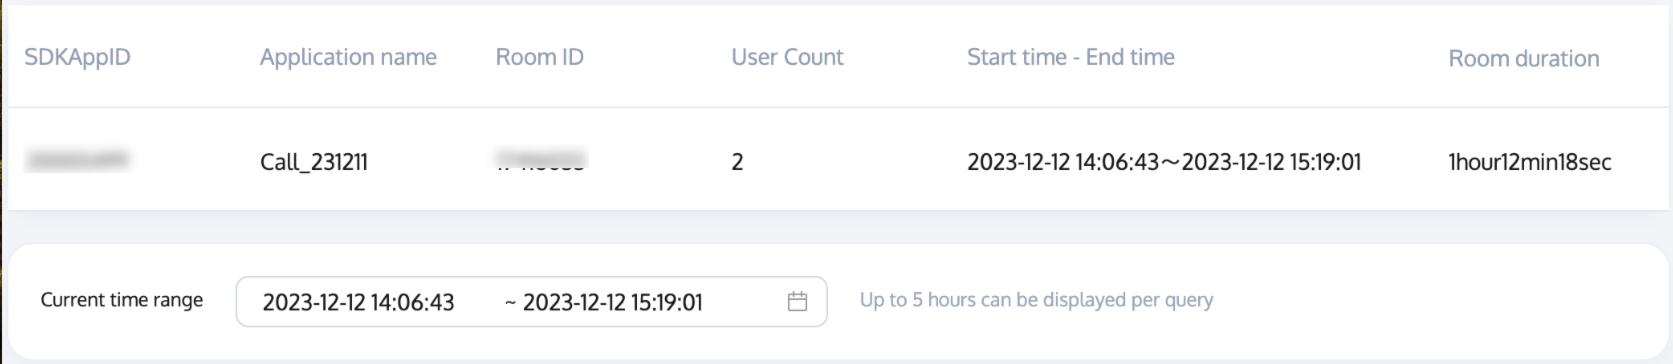
通话房间信息:当前房间的基本信息,包括 SDKAppID、应用名、房间 ID、房间累计用户数、通话起止时间、持续时长等数据。
当前显示时间范围:显示当次查询对应的时间段,单次查询最多显示 5 小时。
通话用户列表
展示包括用户 ID、用户角色、用户类型、区域、用户在当前时间范围内停留情况、用户进出房时间、持续时长、SDK 版本、SDK 类型、设备信息及网络信息。
|
用户 ID | 默认展示最近的6名用户,最多同时展示20名用户。当用户数超过6人时,开发者可以手动添加用户,或查看全部用户后选择添加。 |
用户角色 | 分为主播、观众两种,主播具有上行、下行权限,观众只有下行权限。 |
用户类型 | 展示用户的上、下行类型,绿色上箭头表示用户有过数据上行,黄色下箭头表示用户有过数据下行。 |
区域 | |
用户在当前时间范围内停留情况 | 在当次查询显示时间范围之内,用户在房间中停留的时段以蓝色区块显示,用户不在房间内的时间段以灰色区块显示。 |
用户进出房时间 | |
持续时长 | |
| |
| |
设备 | |
网络 | |
收发端数据
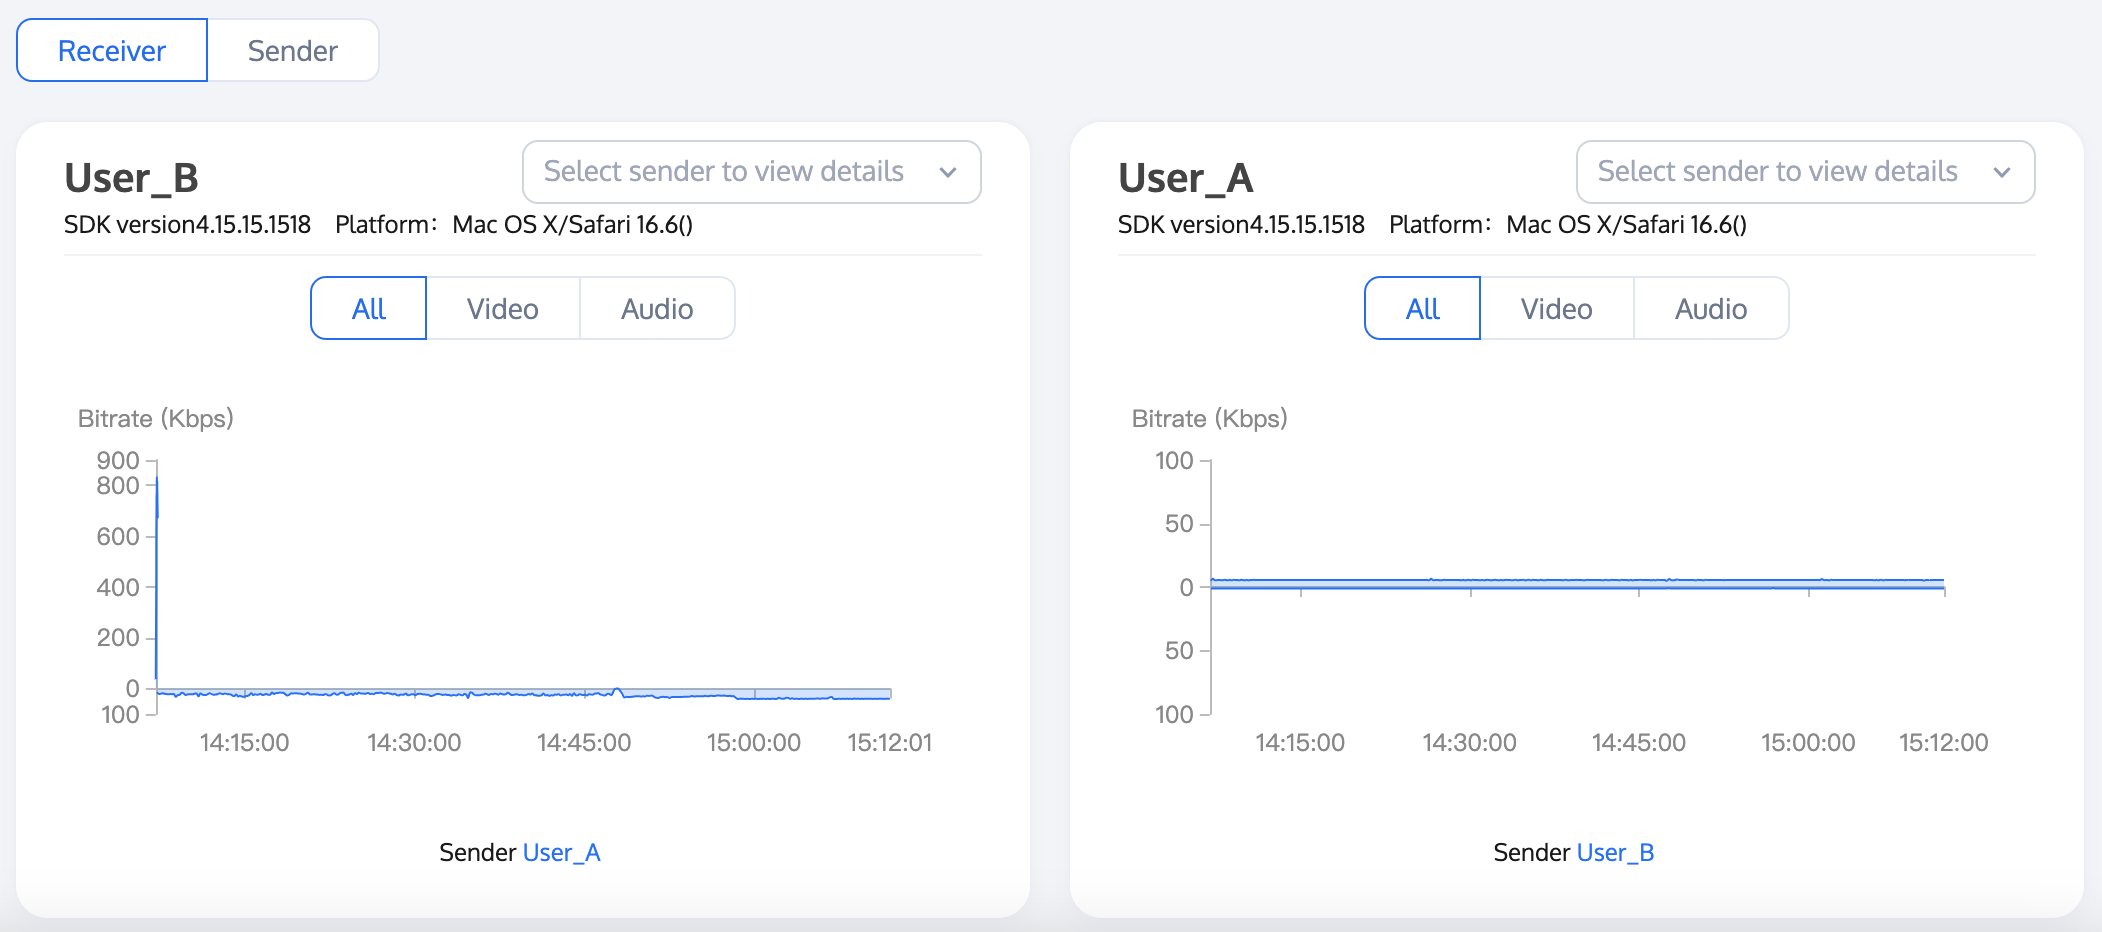
对于通话用户而言,在接收远端其他人数据的同时,也会将自己本地的数据发送出去,因此需要有接收与发送两个方向的数据信息。默认情况下,监控仪表盘通话详情页展示的是 接收端视角 下的数据概览,也可单击切换到 发送端视角 查看。 接收端视角
分为全部、视频、音频以及屏幕共享四个子视角,有接收到对应类型的数据时,在监控仪表盘页面会展示对应的标签项,若没有则不展示。
概览图表默认展示用户接收到的所有其他用户的数据情况,通过不同颜色的区域标记,开发者可通过单击右上角的选择发送端查看详情,选择指定的发送端用户查看单个用户的数据概览。
概览图表中出现红线的地方,表示在此时间点出现过网络抖动,单击接收端右上角的选择发送端查看详情选择指定的用户 ID,即可进入 全链路详情 查看详细通话数据。 当显示的时间段较长时,可以将鼠标悬浮于数据图表中,使用滚轮放大或缩小以查看更详细的时间点数据。
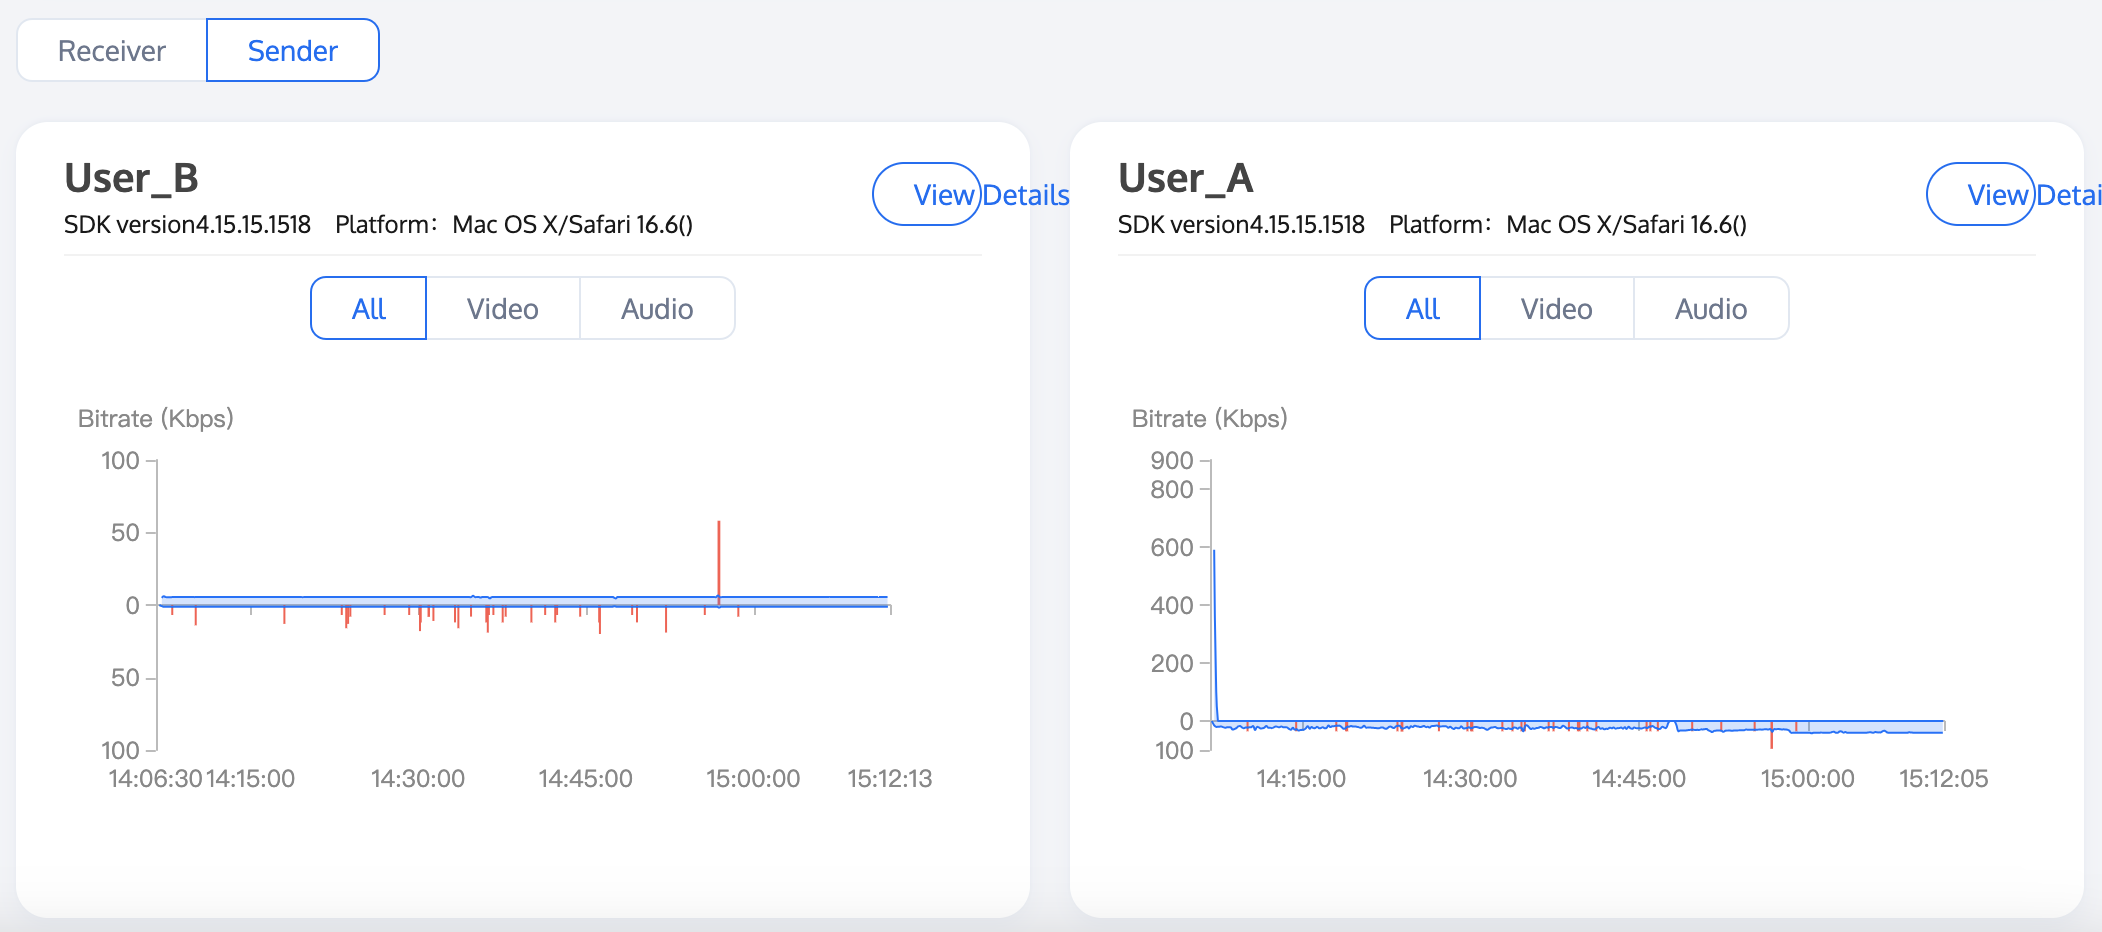
发送端视角
分为全部、视频、音频以及屏幕分享四个子视角,有发送对应类型的数据时,在监控仪表盘页面会展示对应的标签项,若没有则不展示。
概览图表中出现红线的地方,表示在此时间点出现过网络抖动,其中,在横轴上方的红线表示视频丢包率,在横轴下方的红线表示音频丢包率。可单击发送端右上角的查看详情跳转到 全链路详情 页查看发送端的详细数据与事件。 当显示的时间段较长时,可以将鼠标悬浮于数据图表中,使用滚轮放大或缩小查看更详细的时间点数据。