End-to-end call details are the details of data transferred across the sender-receiver link. The preconditions of a smooth audio/video call are good network connections and stable device performance, which are what you should start with when checking the end-to-end details of a call.
Directions
1. Log in to the TRTC console, click Monitoring Dashboard, and find the room whose call details you want to view.
2. Click the room ID or View Call Details on the right to go to the Call Details page.
3. On the receiver/sender page, select the ID of the user whose data you want to view, and go to the end-to-end details page via either of two methods.
On the Receiver page, click Select sender to view details on the right and select a user ID.
On the Sender page, click View Details.
Information Displayed
The end-to-end details page shows the data of Video, Audio, and Screen Sharing, which can be viewed from the perspective of the receiver or sender.
Entering from the receiver page, the end-to-end details are the call details information between the sender end and the receiver, including Basic Information and the detail information of Sender and Receiver under the video and audio indicators.
Entering from the sender page, the end-to-end details are the call details information of the sender, including BasicInformation and the details of Sender under the video and audio indicators.
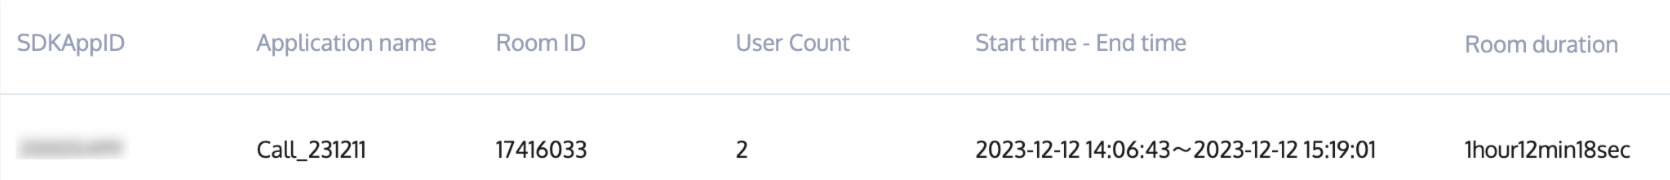
Basic Information
At the top of the page, 6 fields of basic information are displayed, including SDKAppID, Application name, Room ID, User Count, Start time - End time, and Room duration.
Sender
Video Details
Video details include 4 major segments, video upstream and network packet loss, control metrics, video frame rate, and video send resolution, with multiple metrics in each segment presented as multi-dimensional visual charts.
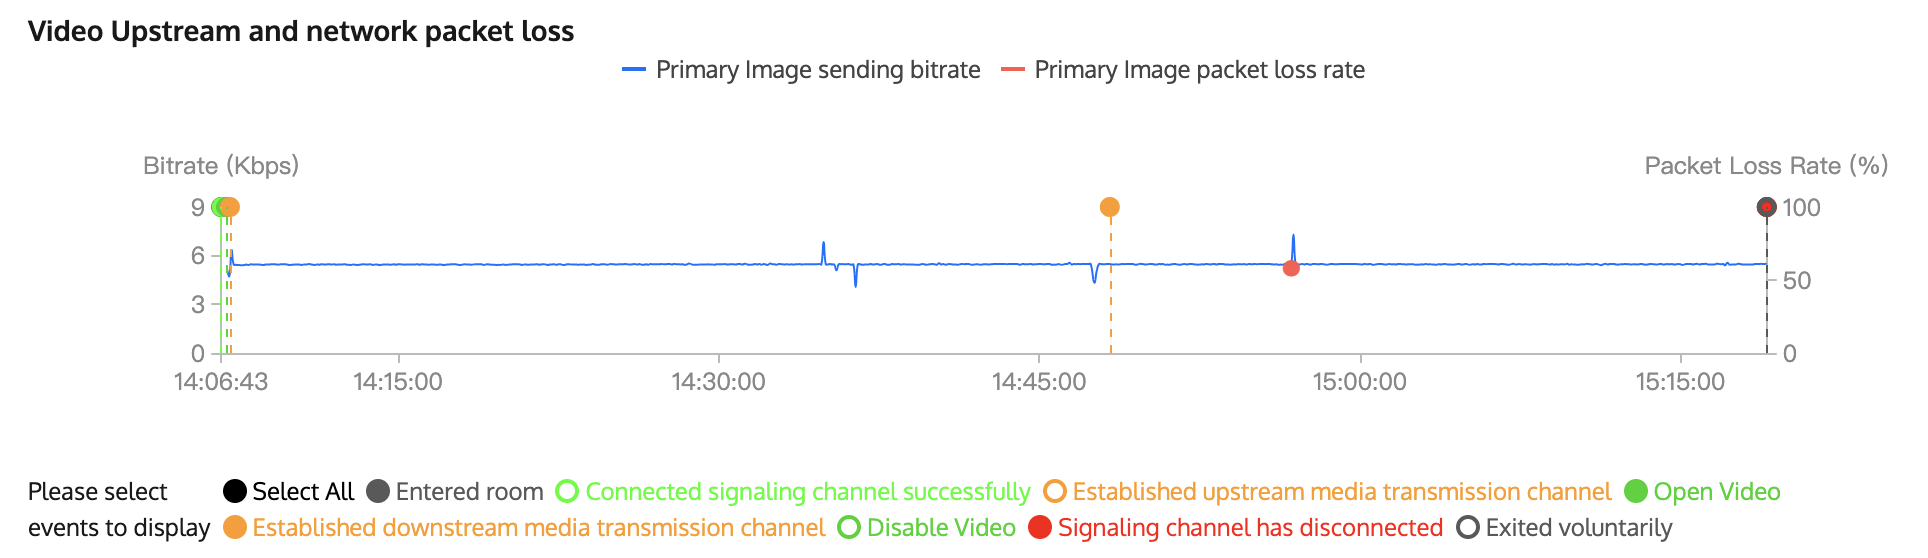
Video Upstream and Network Packet Loss
The image horizontal axis is the time granularity, whose size can be changed by sliding the scroll wheel; the left vertical axis is the primary image sending bit rate (blue line); the right vertical axis is the primary image packet loss rate (red line).
Different colored dots in the image indicate different types of events, you can filter and view different types of events by clicking the corresponding colored buttons below the image.
8 event types: Entered Room, Connected Signaling Channel Successfully, Establishing Upstream Media Transmission Channel, Open Video, Established Downstream Media Transmission Channel, Disable Video, Signal Channel Disconnected, and Exited Voluntarily.
Note: When entering end-to-end details from the sender, there are 7 event types, except for "Established downstream media transmission channel".
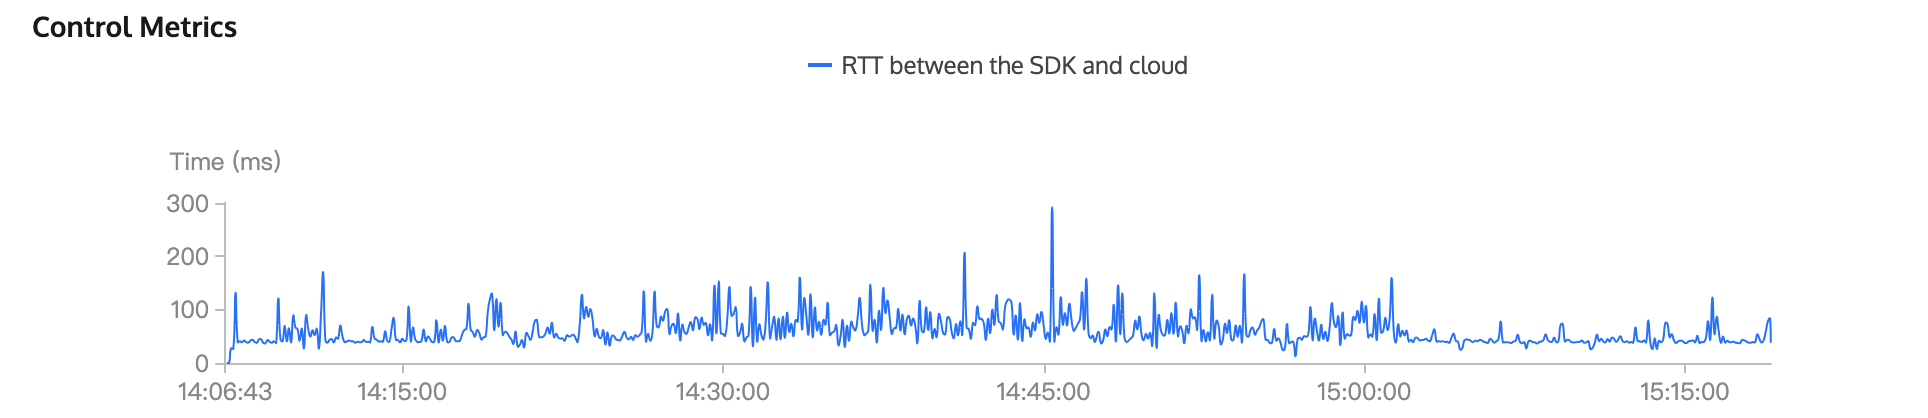
Control Metrics
The horizontal axis of the image is the time granularity, whose size can be changed by sliding the wheel.
The vertical axis is the round-trip time (RTT) between the SDK and cloud in milliseconds, which is represented by the blue line.
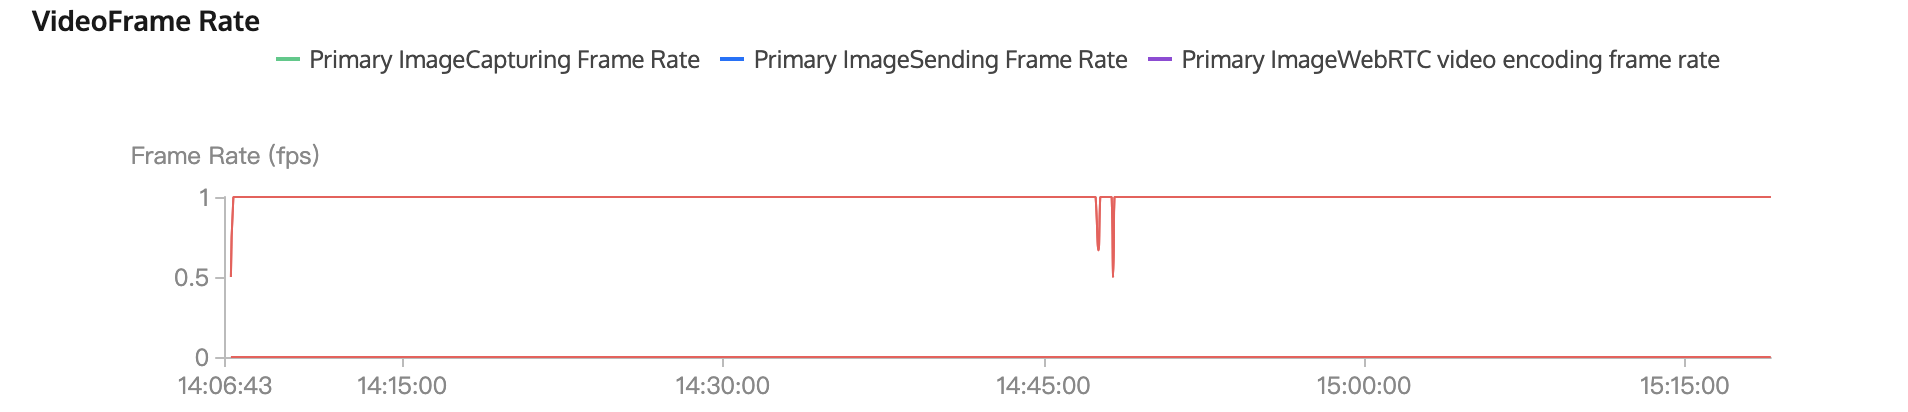
Video Frame Rate
The horizontal axis of the image is the time granularity, whose size can be changed by sliding the wheel;
The vertical axis is the frame rate. Hover the mouse over the image to view three metrics: primary image capturing frame rate, primary image sending frame rate, and primary image RTC video encoding frame rate.
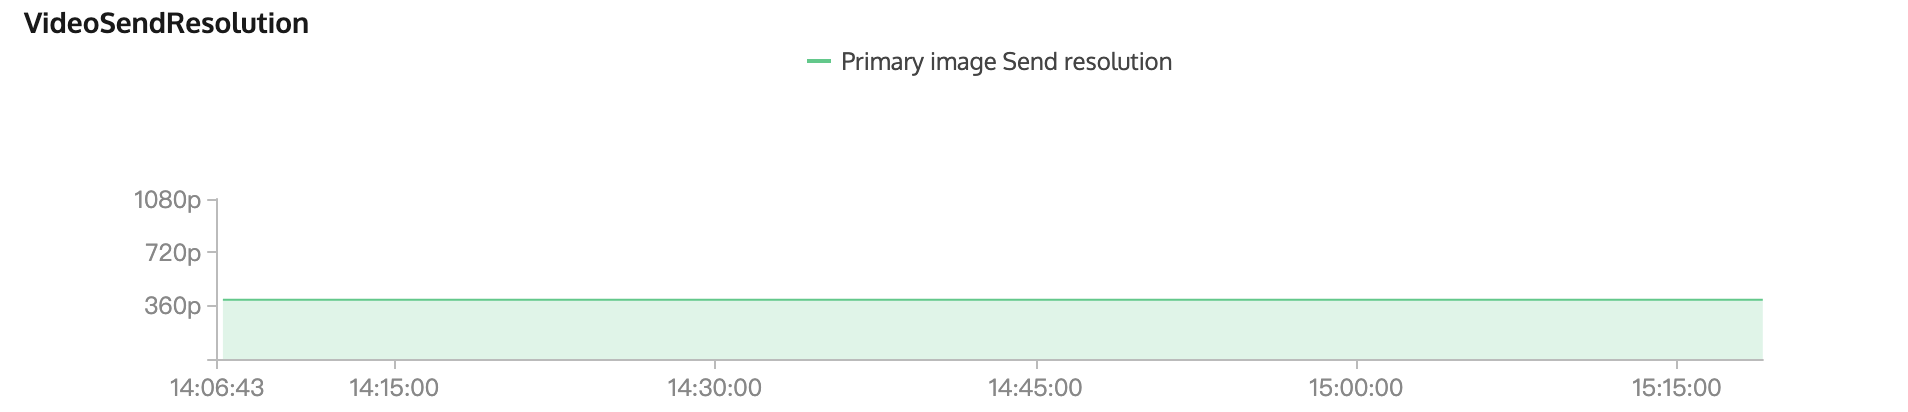
Video Send Resolution
The horizontal axis of the image is the time granularity, whose size can be changed by sliding the wheel.
The vertical axis is the resolution and the primary image resolution can be viewed by hovering the mouse over the image.
Audio Details
Audio details include 3 major segments, audio upstream and network packet loss, control metrics, and audio capturing volume, with multiple metrics in each segment presented as multi-dimensional visual charts.
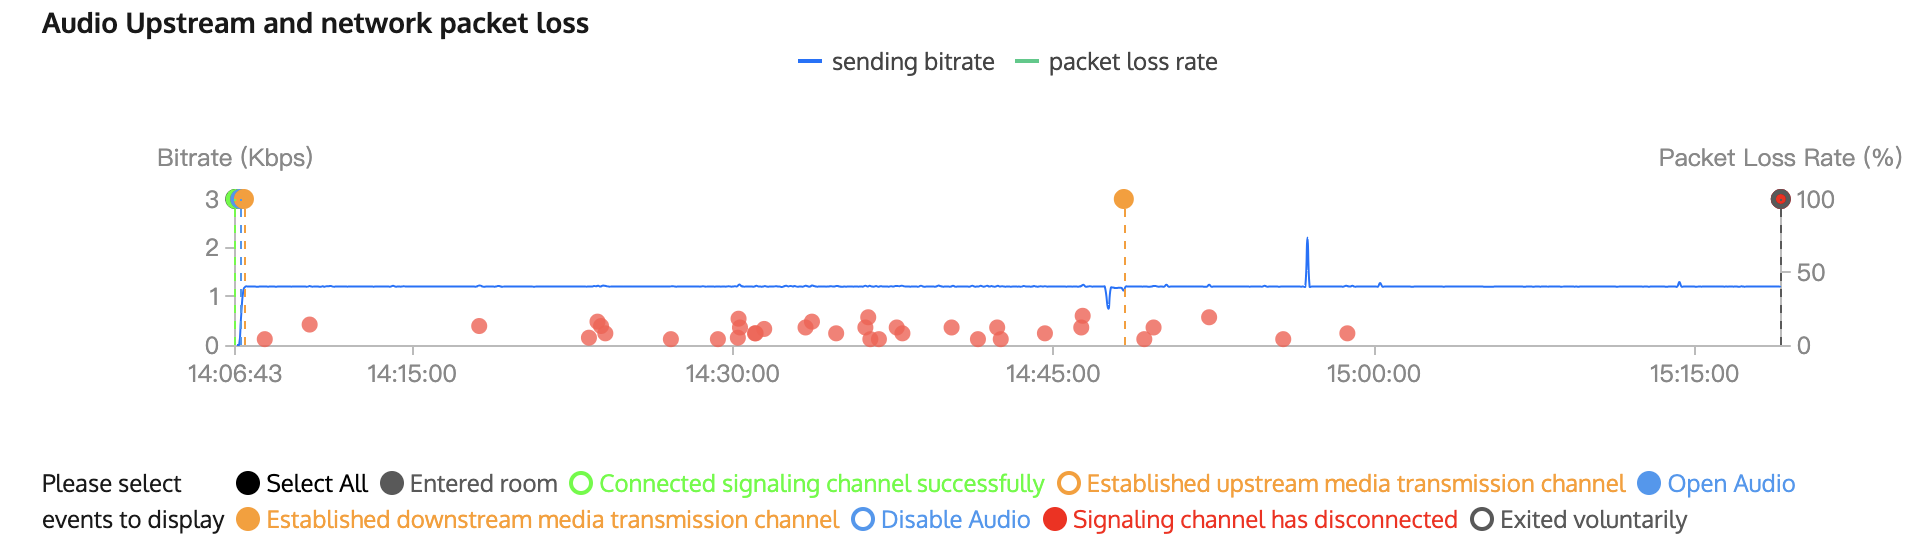
Audio Upstream and Network Packet Loss
The horizontal axis of the image is the time granularity, whose size can be changed by sliding the scroll wheel; the left vertical axis is the audio sending bit rate (blue line); the right vertical axis is the audio packet loss rate (green line).
Different colored dots in the image indicate different types of events, you can filter and view different types of events by clicking the corresponding colored buttons below the image.
8 event types: Entered Room, Connected Signaling Channel Successfully, Establishing Upstream Media Transmission Channel, Open Audio, Established Downstream Media Transmission Channel, Disable Audio, Signal Channel Disconnected, and Exited Voluntarily.
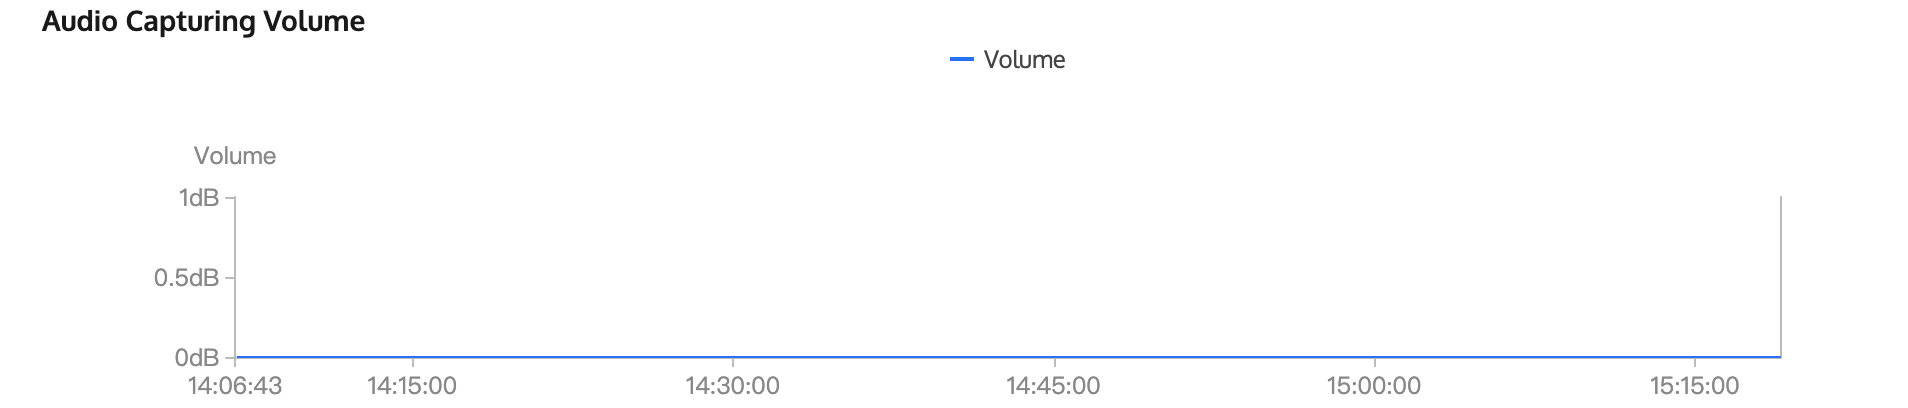
The vertical axis is the audio capturing volume (blue line).
Receiver
Video Details
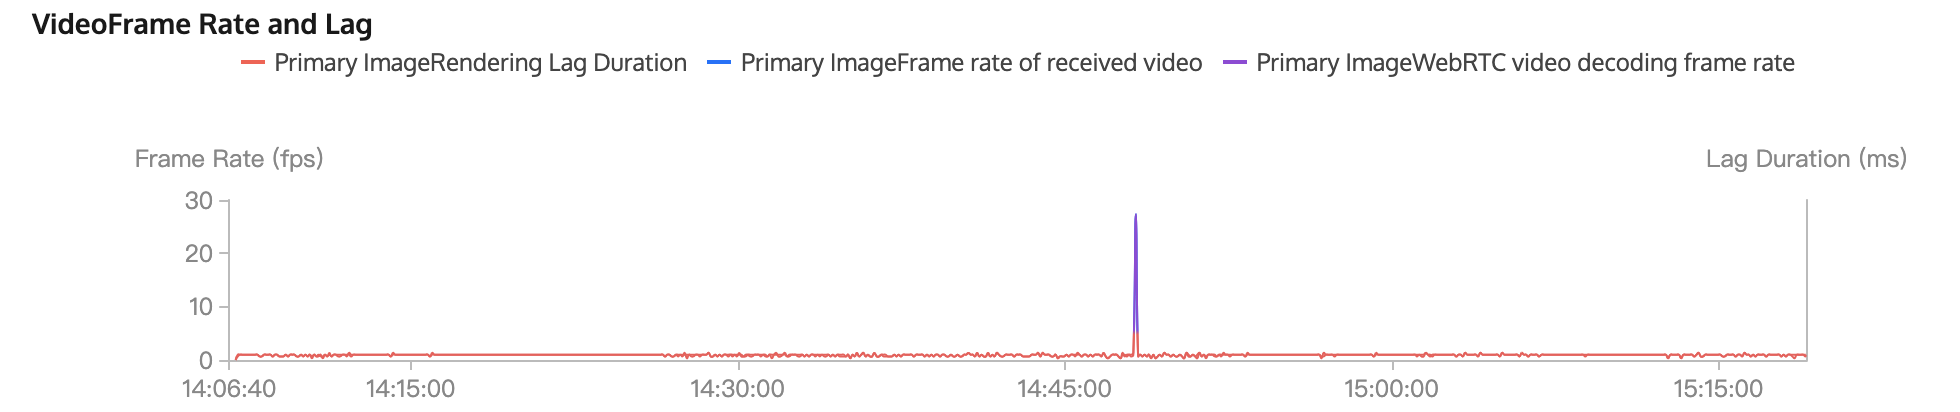
Video details include 4 major segments: video downsteam and network packet loss, control metrics, video frame rate and lag, and video receive resolution, with multiple metrics in each segment presented as multi-dimensional visual charts.
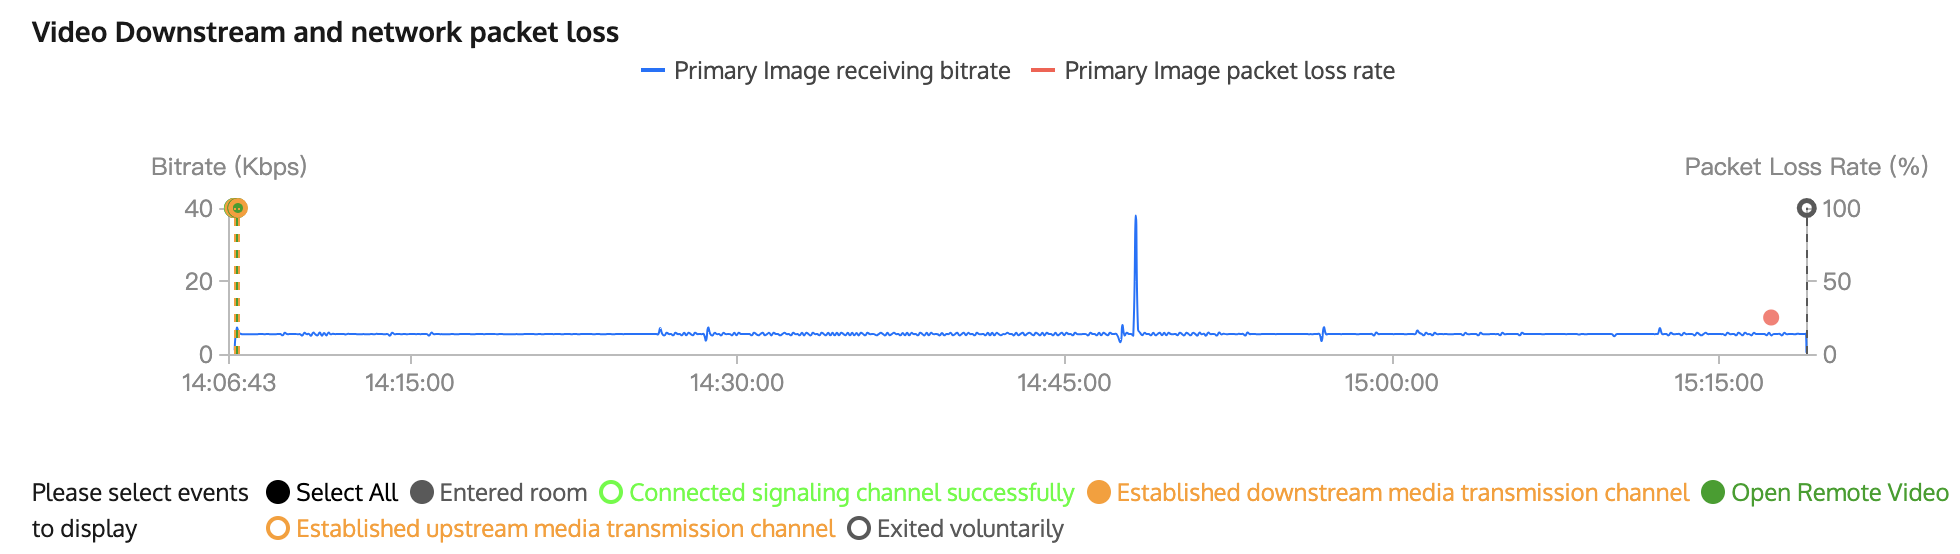
Video Downsteam and Network Packet Loss
The left vertical axis is the primary image receiving bit rate (blue line) and the right vertical axis is the primary image packet loss rate (red line).
Different colored dots indicate different types of events, you can filter and view them by clicking the corresponding colored buttons at the bottom of the image.
6 event types: Entered Room, Connected Signaling Channel Successfully, Established Downstream Media Transmission Channel, Open Remote Video, Established Upstream Media Transmission Channel, and Exited Voluntarily.
The left vertical axis indicates the primary image frame rate of received video (blue line); the right vertical axis indicates the primary image rendering lag duration (red line); the purple line indicates the primary image RTC video decoding frame rate.
Video Receive Resolution
The vertical axis is the primary image received resolution, hover the mouse over the image to view the resolution details.
Audio Details
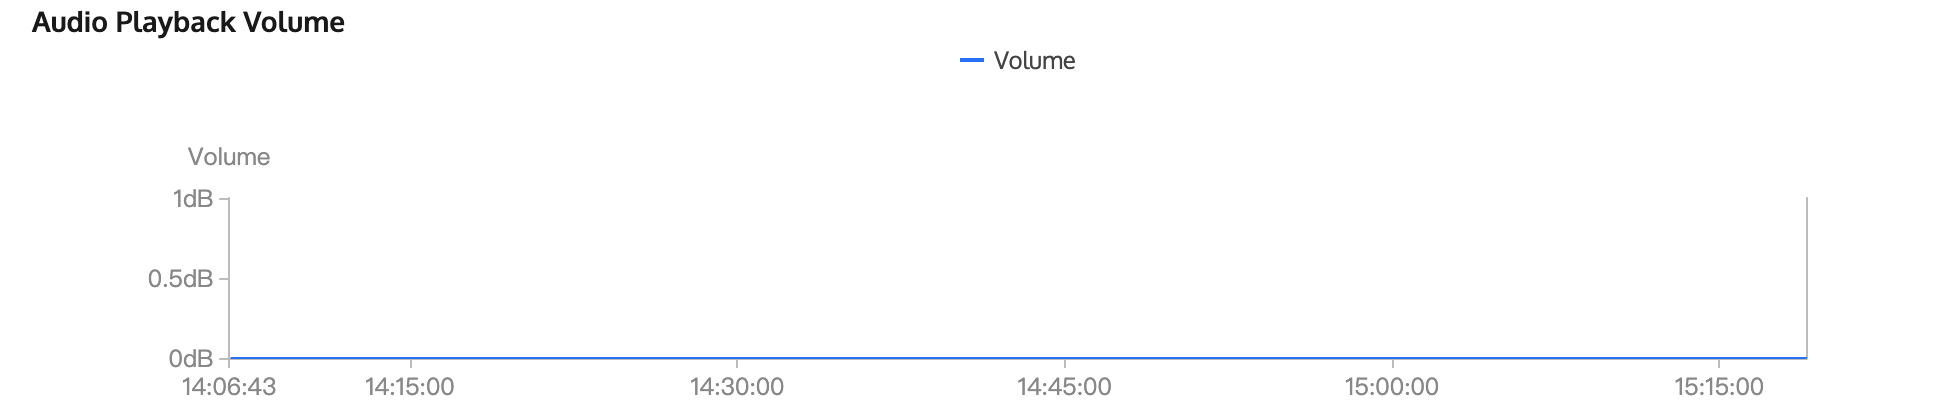
Audio details include 4 major segments: audio downsteam and network packet loss, control metrics, audio playback volume, and audio playback lag, with multiple metrics in each segment presented as multi-dimensional visual charts.
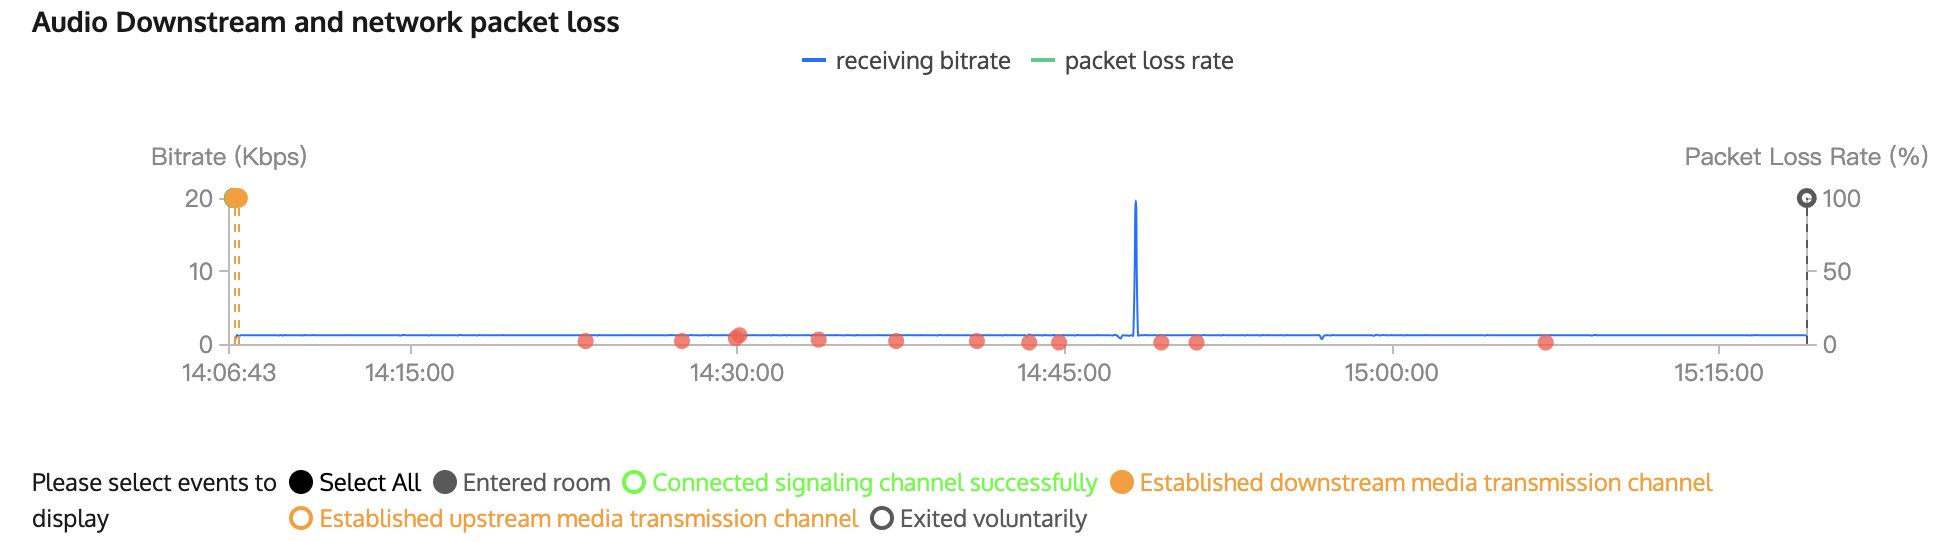
Audio Downsteam and Network Packet Loss
The left vertical axis is the audio receiving bit rate (blue line), and the right vertical axis is the audio packet loss rate (green line).
Different colored dots in the image indicate different types of events, which can be filtered and viewed by clicking on the corresponding colored buttons at the bottom of the image.
5 event types: Entered Room, Connected Signaling Channel Successfully, Establishing Upstream Media Transmission Channel, Established Downstream Media Transmission Channel, and Exited Voluntarily.
The vertical axis is the audio playback volume (blue line).
Audio Playback Lag
Priority Metrics
End-to-end details can be analyzed in terms of network transmission and device status:
Network Transmission
Ideally, data should be transferred at high bandwidth, with zero packet loss and no delay, but in reality, packet loss, delay, and instability are common, and bandwidth is often limited. Given this, you need to pay special attention to the following points when analyzing network conditions.
Packet loss: In the graph, packet loss is represented by a red line.
Packet Loss Rate
Network Conditions
= 0
Excellent
< 2%
Good
> 5%
Poor
> 10% (or constant packet loss)
Serious network congestion
Bitrate: Normally, the fluctuations of audio/video bitrate should be smaller than 10%. If the bitrate experiences dramatic fall or fluctuations larger than 30%, it indicates network congestion or jitter.
Note
Because the GOP duration of screen sharing is relatively long (5-10 seconds), normally, the bitrate follows a regular cycle, represented by a curve which peaks at keyframes.
Upstream bitrate and packet loss for screen sharing
The bitrate curve of screen sharing follows a cycle with regular peaks.
Frame rate: Normally, video frame rate should stabilize at around 15 fps or higher (5-10 fps for screen sharing). If the frame rate experiences fluctuations larger than 5 fps or falls and stays below 10 fps, it indicates network congestion or jitter. When this happens, users experience stutter. Periods of excessively low frame rates are marked red in the graph.
Upstream video frame rate (capture or send)
Video rendering frame rate. Excessively low frame rates are marked red, and the stutter time is provided.
Device Status
Stable device performance is necessary for a successful audio/video call. Preferably, the device uses a small amount of system resources, does not compete for resources with other devices, and collects data without interference. Pay attention to the following aspects when checking device status.
CPU usage: Both system CPU usage and application CPU usage are displayed. Normally, system CPU usage should be lower than 50%. The lower, the better. If system CPU usage exceeds 85%, the application may stop responding or respond slowly. This is marked by red lines in the graph.
Time consumption of SDK task: Some Android devices and system versions are unable to calculate CPU usage, in which case you can use Time Consumption of SDK Task to assess device performance. If a task takes longer than 60 ms to complete, it indicates high system CPU usage, and the application may not respond or be slow to respond. Consider closing other processes in the background or update your hardware.
Volume:
Capturing volume is the volume of audio captured from the sender's mic. If it changes, it indicates that the SDK is capturing audio, i.e., the device functions properly.
Playback volume is the volume of decoded and rendered audio sent to the receiver’s speaker. If it changes, it indicates that the SDK has sent audio to the speaker, i.e., the SDK functions properly.
The normal volume range is 40-80 dB. If the volume is lower than 40 dB, and the user cannot hear any audio, check for hardware failure or whether the user’s phone is muted.
Resolution: The resolutions of video and screen sharing are additional information used mainly to analyze relayed live streaming and the replay of recorded streams. Fluctuations in resolutions indicate that audience watching relayed live streams via CDN or replaying recorded videos, especially web users, may be experiencing player compatibility issues such as stuttering or pixelated video.
Note
Resolution, bitrate, and frame rate are related to each other. Generally, when resolution is fixed, the higher the bitrate, the clearer the image; when bitrate is fixed, the higher the resolution, the blurrier the image. Set resolution, bitrate, and frame rate properly to ensure good video quality.
Client events: Client events correspond to the calling of SDK APIs by the application and are usually used to help locate software problems, analyze bugs, as well as simulate scenarios by analyzing users’ operations. Pay attention to these client events:
Entering/Exiting a room
Enabling/Disabling the camera or mic
Device change, such as switching cameras, connecting/disconnecting headphones, and connecting Bluetooth headphones.
Starting/Stopping stream pushing or playback
Disabling/Enabling audio or video
Switching networks, for example, from 4G to Wi-Fi
Click View Detailed Event to open the event list and view the operations of key client events.


 Yes
Yes
 No
No
Was this page helpful?