性能データ
Download
フォーカスモード
フォントサイズ
このドキュメントでは主に、開発者が最も関心を寄せている、オーディオビデオの品質、レイテンシー、スムーズさ、安定性、CPU、メモリ、電力消費量および発熱といった主な指標に焦点を当てています。通常のネットワーク環境、脆弱なネットワーク環境および**さまざまなリアルタイムのインタラクティブシーン(1v1、1vNなど)で、客観テストと分析の総括を行います。
ロスレスで脆弱なネットワーク環境での効果の品質
テストシーン
ビデオ通話とオンラインライブストリーミングのオーディオビデオシーンと音声通話シーン
パラメータ設定
ビデオ通話:
パラメータタイプ | 設定情報 |
解像度 | 368 × 640 |
ビットレート | 400Kbps |
フレームレート | 15 |
インタラクティブライブストリーミング:
パラメータタイプ | 設定情報 |
解像度 | 720 × 1280 |
ビットレート | 1200Kbps |
フレームレート | 15 |
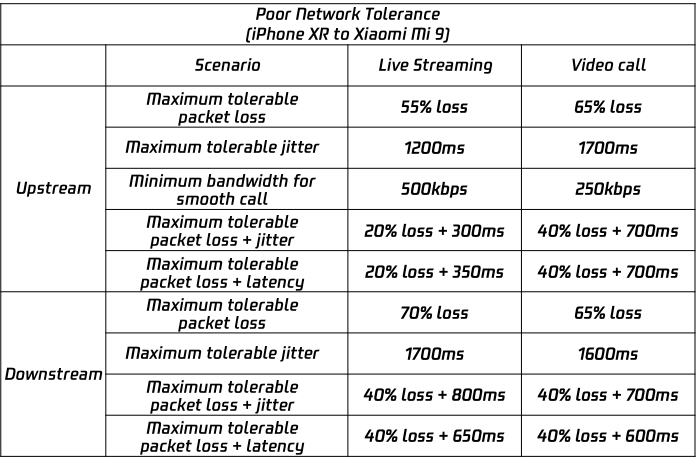
極限ネットワーク耐性テストデータ
極限ネットワーク耐性テストとは、SDKがさまざまなネットワーク障害環境において耐えられる最大のネットワーク障害をテストすることをいいます。
説明:
オーディオ脆弱ネットワークMOS値
データの解読:Tencent Real-Time Communication (TRTC)は、非常に理想的ではないネットワーク環境で、より低いレイテンシーでより高い音質を保証します。
以下の脆弱なネットワーク環境におけるTRTCの客観的なMOS評価結果は次のとおりです。

クライアントSDK性能データ
テストデバイス情報
デバイスタイプ | プロセッサタイプ | メモリ |
Androidデバイス1 | Snapdragon835-8コア | 6G |
Androidデバイス2 | Kirin980-8コア | 8G |
iOSデバイス1 | A8-デュアルコア | 1G |
iOSデバイス2 | A13-6コア | 4G |
テストパラメータ設定
パラメータタイプ | 設定情報 |
解像度 | 240 × 320 |
ビットレート | 100kbps |
フレームレート | 15 |
テストプランの説明
テストシーン:1v1、1v2、1v4、1v8。
テスト時間:各シーンで30分間テストされます。
テストプラン:Linuxプッシュロボットを使用して他人数のシーンを作成し、各テストデバイスを個別にテストします。
テスト結果
データの解読:TRTC SDKは、CPU使用率、メモリ使用量、発熱および電力消費量など、さまざまな性能において優れたパフォーマンスを発揮します。少ないハードウェアリソースで、高品質のオーディオビデオサービスを提供することができます。
App CPU使用率: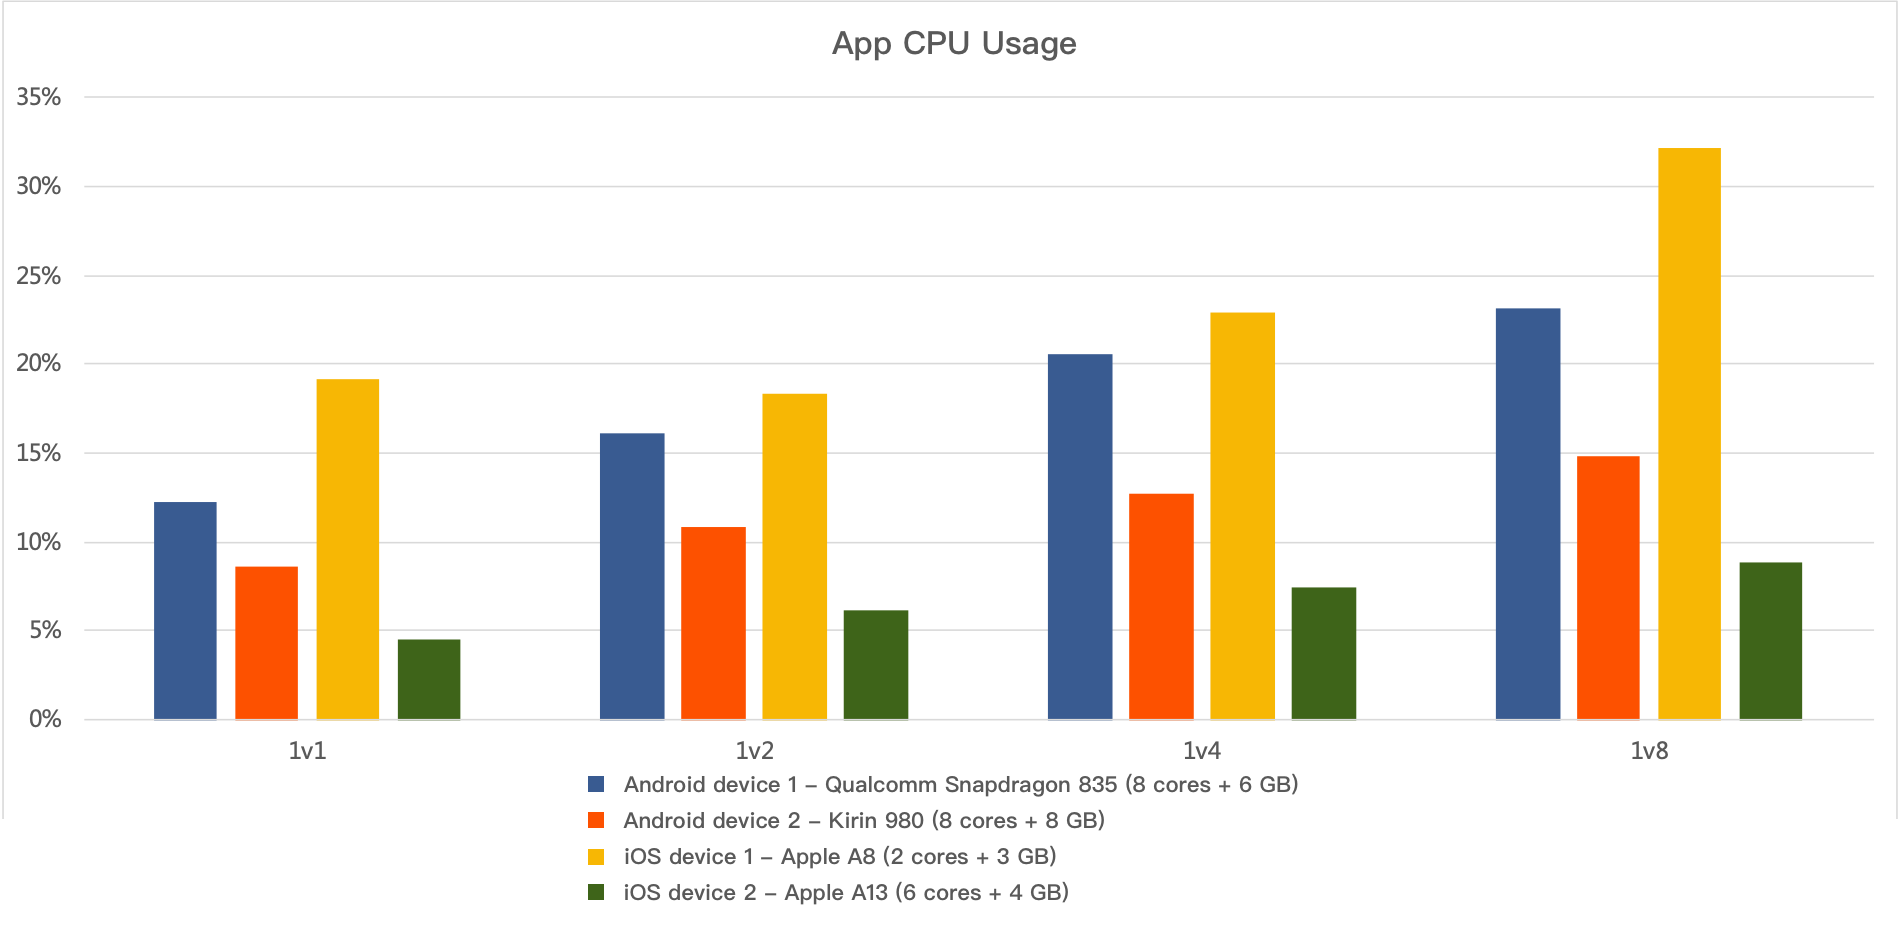
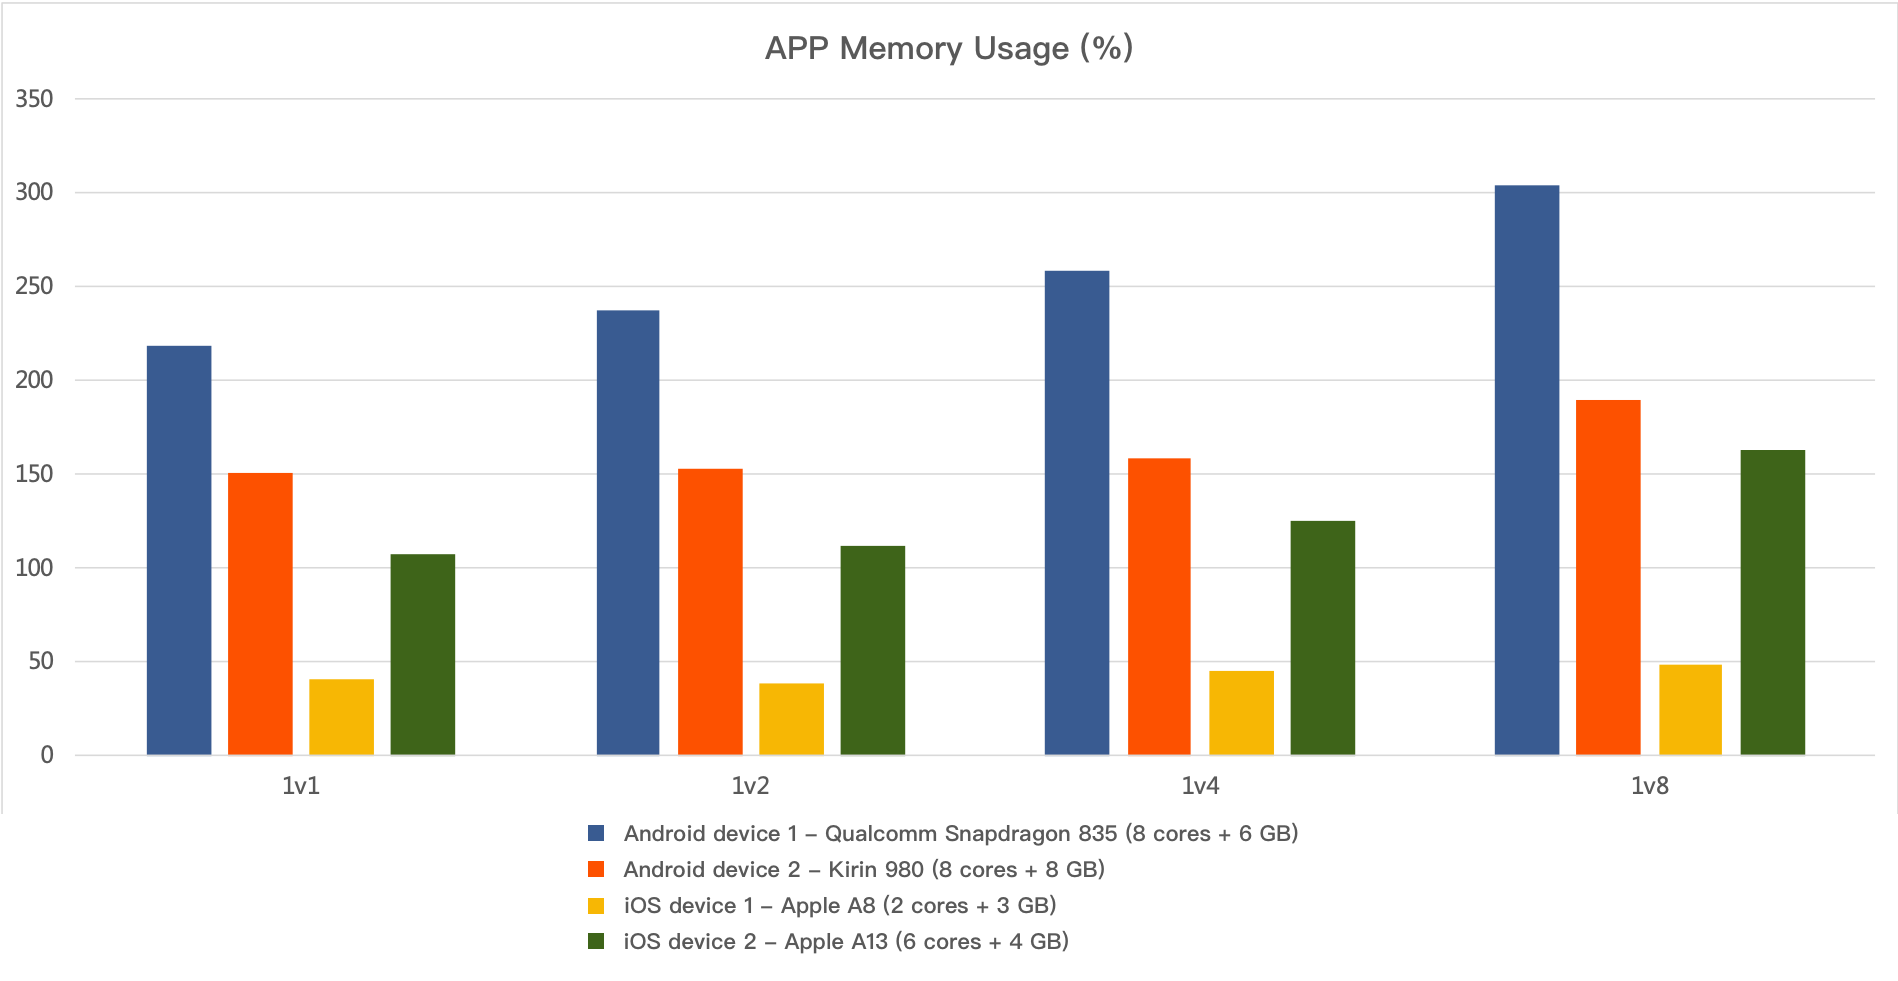
Appメモリ使用率:
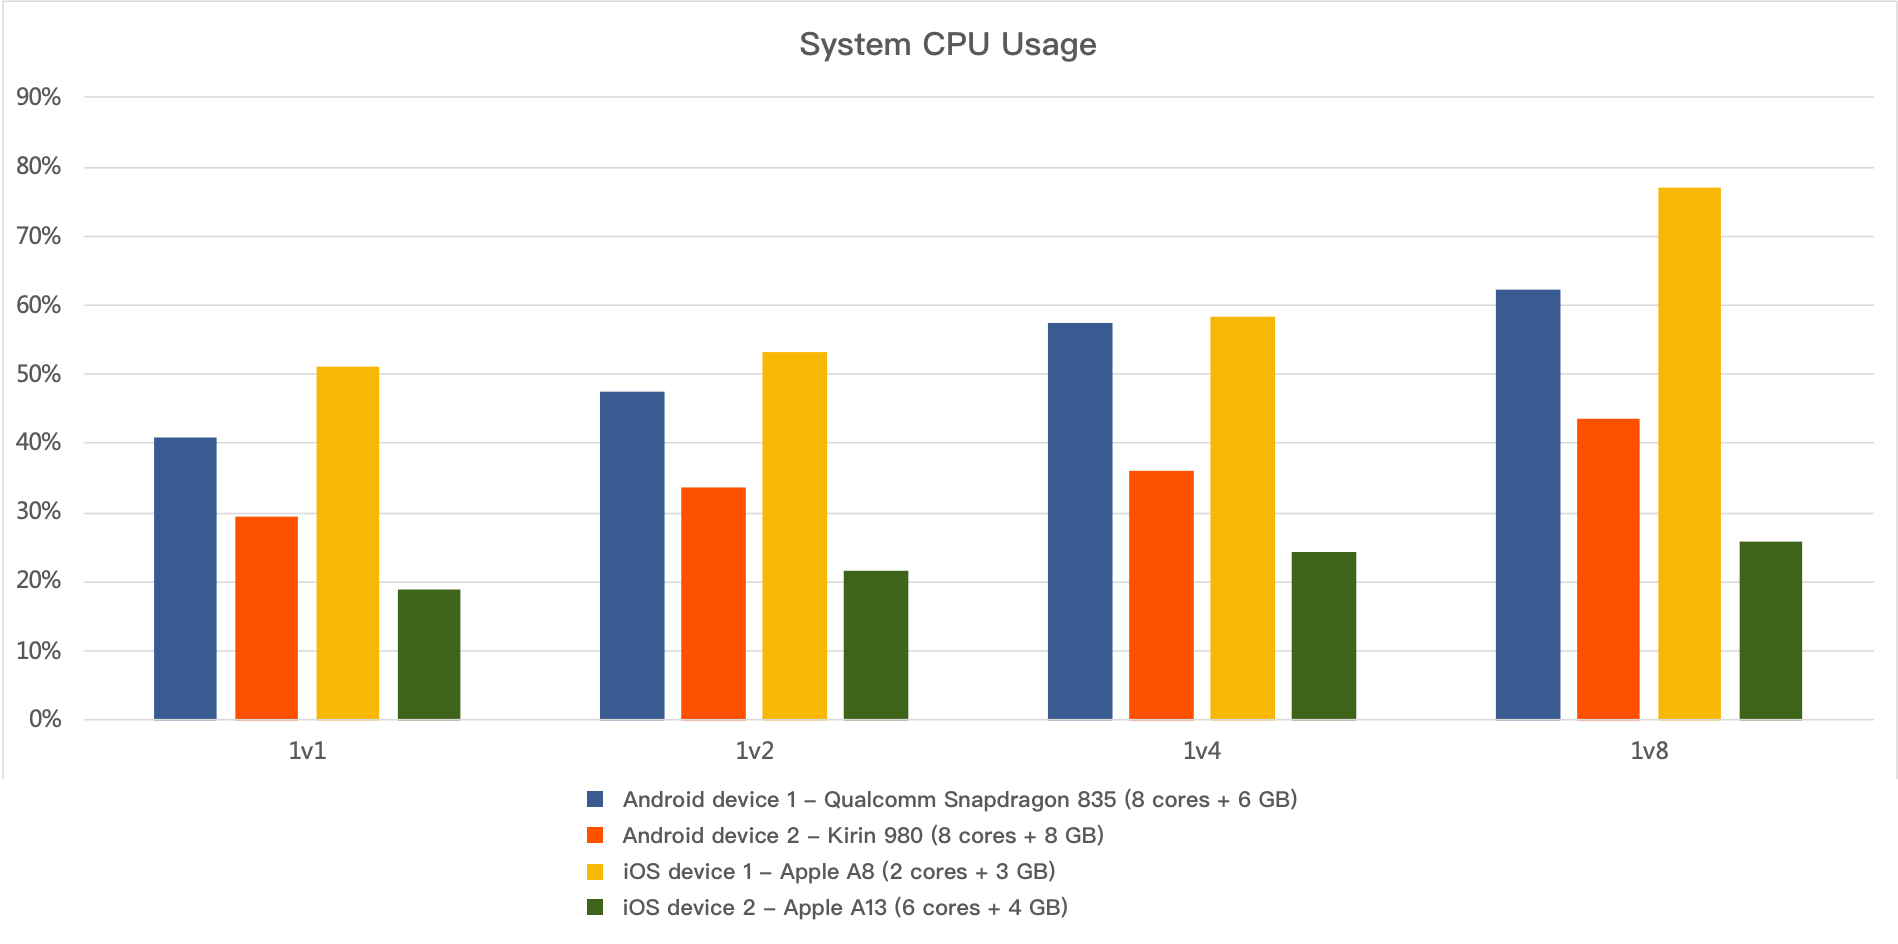
-システムの合計CPU使用率:
-システムの合計メモリ使用率: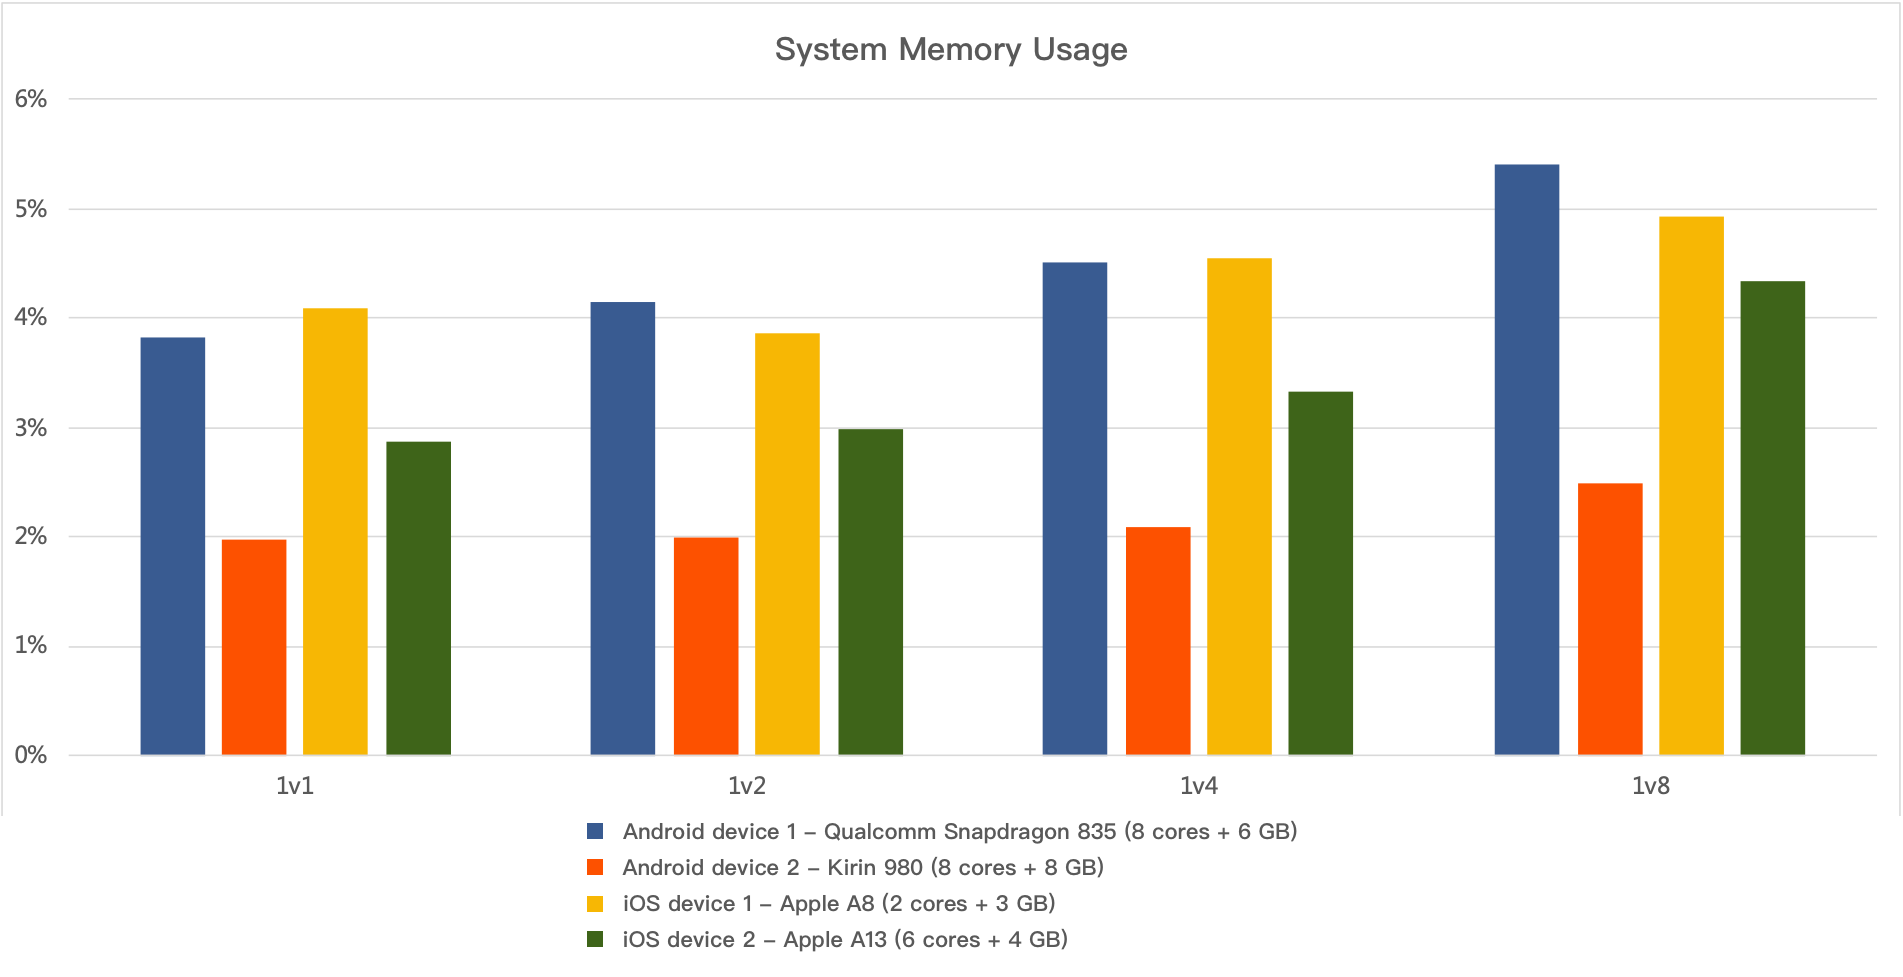
稼働30分間の電力消費量: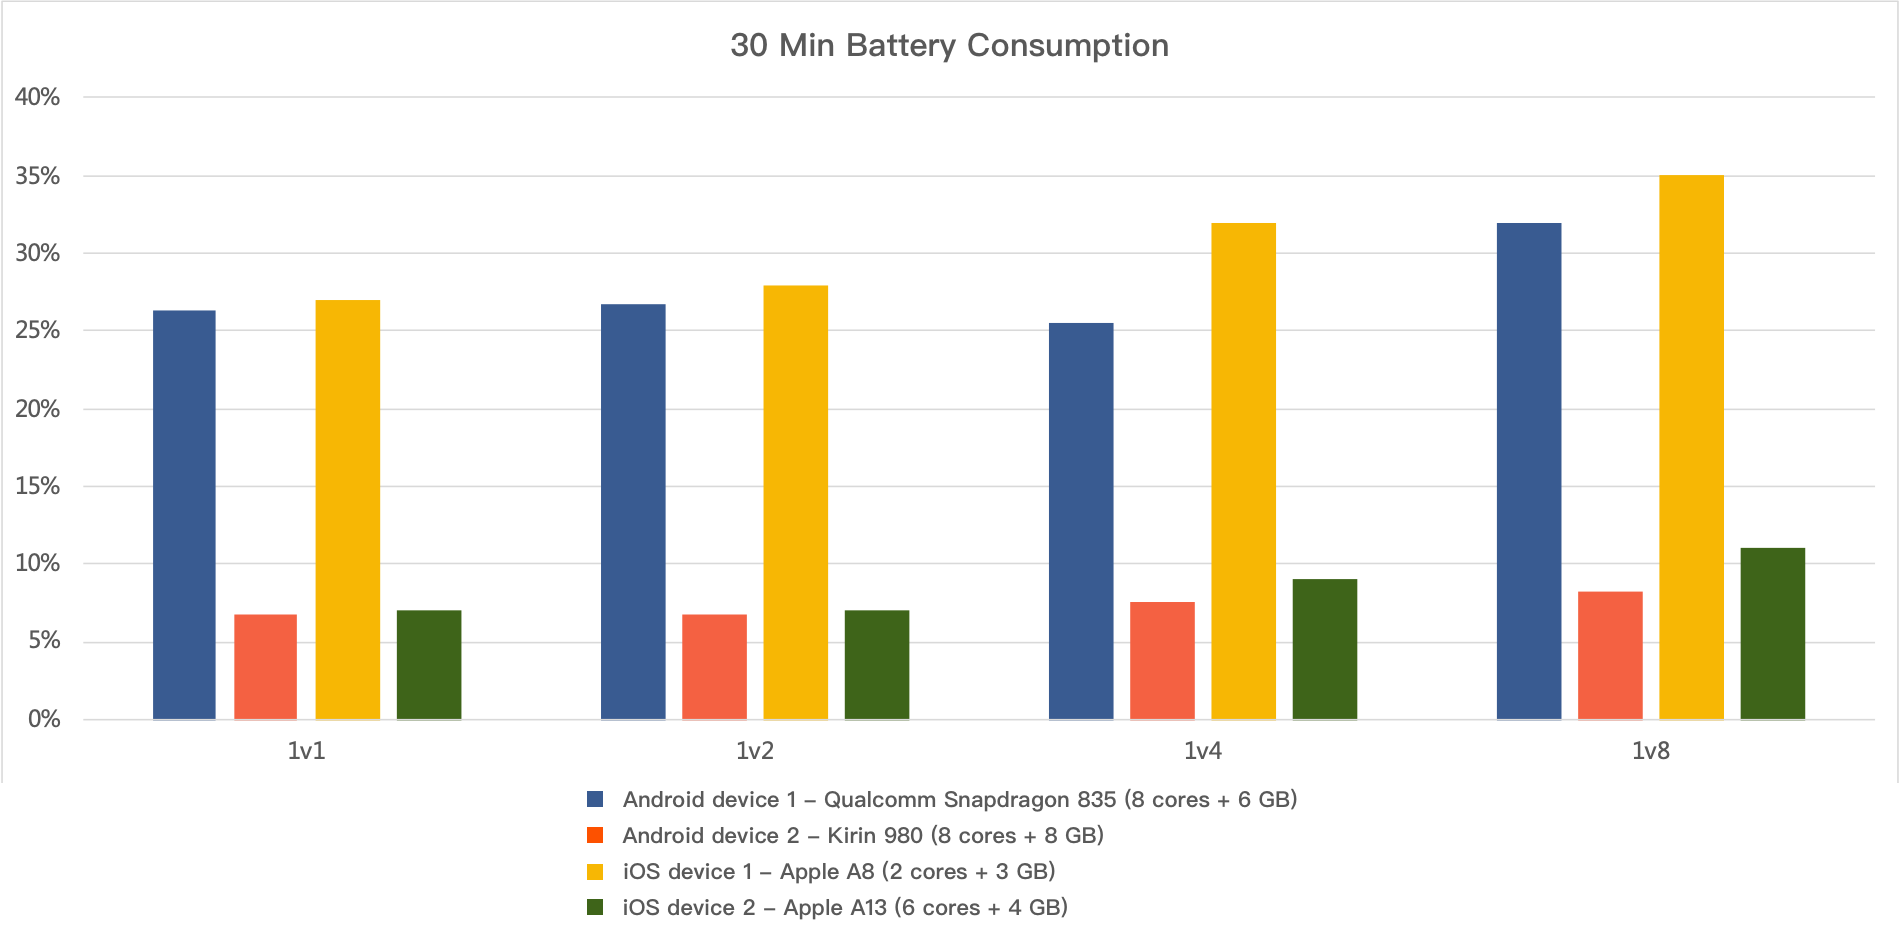
稼働30分間の発熱量の増分: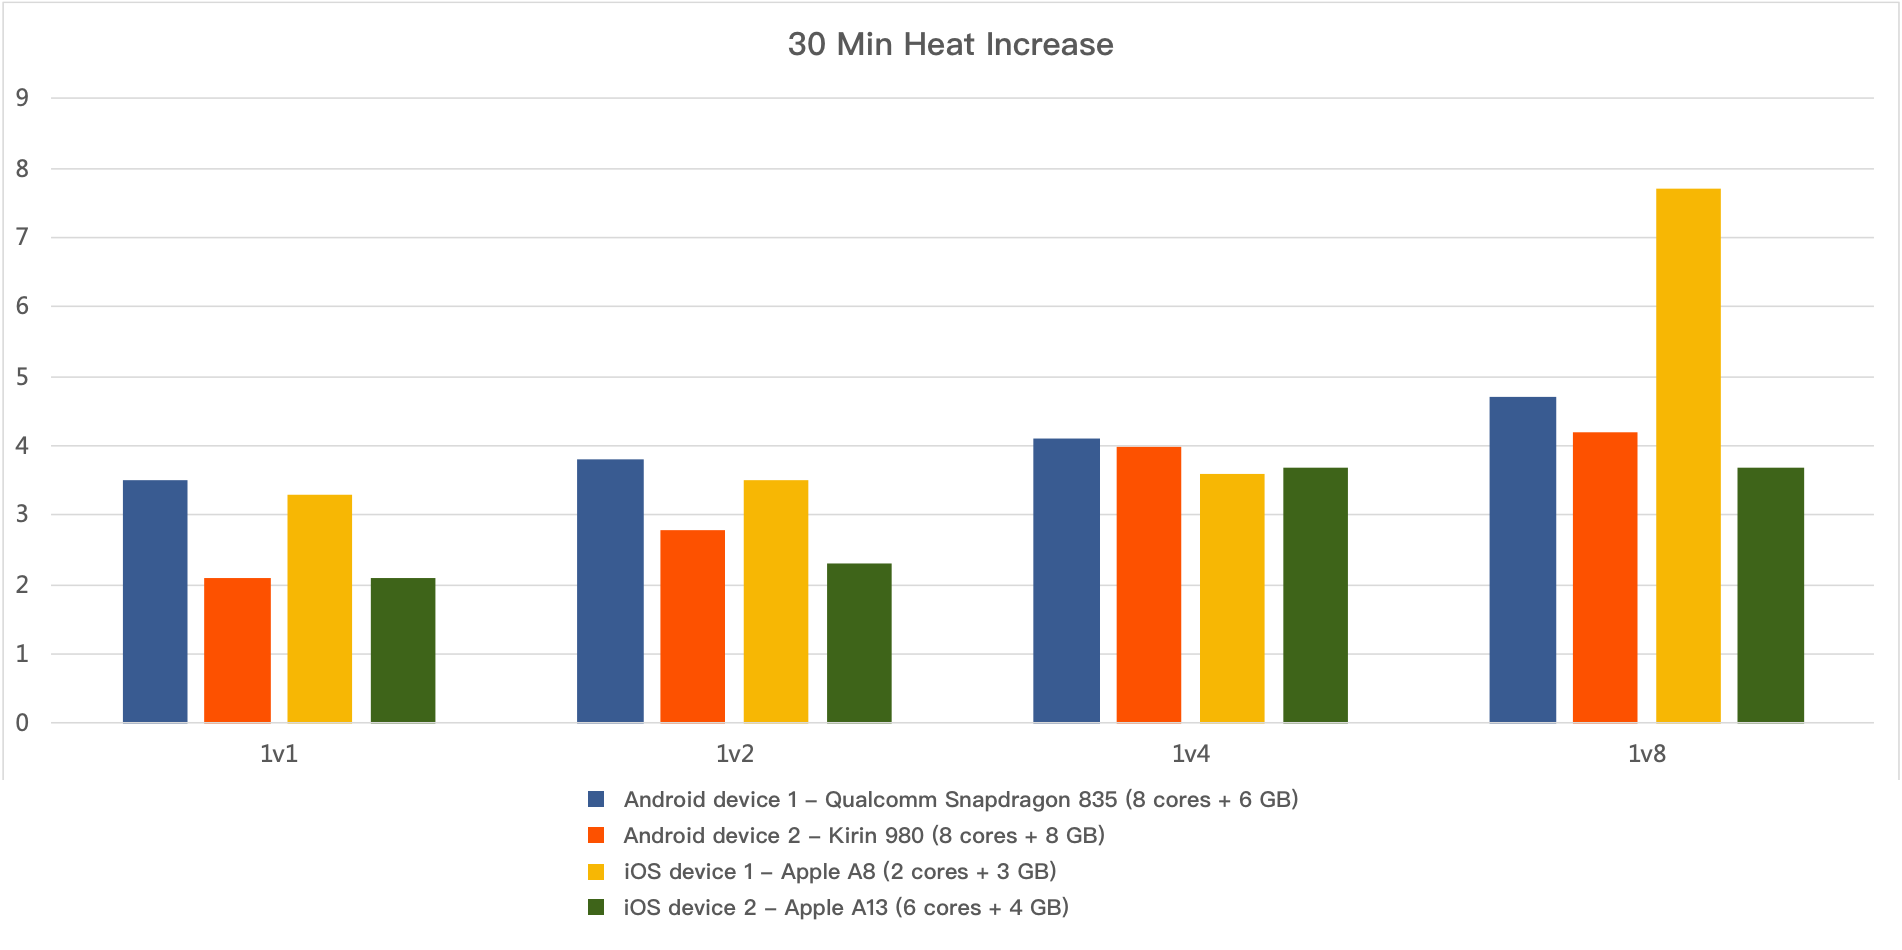
付録1:オーディオ・ビデオネットワーク障害指標の説明
ネットワーク障害指標 | 説明 | 事例 |
Loss | Networkingパケット損失 | 50% Lossとは、10パケットのうち5パケットが失われることを意味します |
Delay | レイテンシーを意味します | 200ms DelayはSDKによって送信されるパケットであり、200ms後にネットワークから送信されます |
Jitter | ジッターを意味します | 300 JitterはSDKが送信するパケットです。ランダムな確率で20ms、280ms、50ms、250msなど遅延する可能性があります。最大レイテンシーは300ms、平均レイテンシーは150msです |
付録2:ネットワーク障害下の効果データの説明
効果データ | 説明 |
MOS値 | 通常、通信システムの音声品質を測定するための重要な指標として用いられます。客観的なMOS値は、Spirent Nomadデバイスを採用してPOLQAのスコアリングを行います。スコアが高いほど、音質が良いことを意味します |
エンドツーエンドの遅延 | エンドツーエンドの遅延とは、送信側での音声収集から受信側での再生までの時間をいいます |
極限オーディオビデオ耐性テスト基準 | ネットワークの障害を追加した後、Spirent Nomadデバイスを使用して、POLQAをスコアリングし、foremanビデオシーケンスを使用して受信側のフレーム間隔状況を検出します。10分以上観察を続け、30個のデータポイントを取得します。3分間に3回以上の主観的に知覚できる効果の異常または1回の長時間の使用不可といった現象がある場合、耐性能力を超えているとみなします |
ご注意:
POLQA(知覚的客観的聴取品質評価)基準。国際規格ITU-T P.863に基づいてスコアリングを行い、人間の音声評価に使用します。POLQAとは、さまざまなネットワークシーン向けのグローバルな音声品質分析基準です。
付録3:SDK性能指標の説明
指標タイプ | 説明 | |
App CPU使用率 | Android | App CPUは、プロセスが標準化されていないCPU使用率を表し、統計結果はAndroid StudioProfilerと一致します。 |
| iOS | App CPUはプロセスのCPU使用率を表し、統計結果はXcodeと一致します。PerfDog使用率 = Xcode使用率 / コア数。 |
システムCPU使用率 | Android | Total CPUは、マシン全体が標準化されていないCPU使用率を表し、統計結果はAndroid StudioProfilerと一致します。 |
| iOS | Total CPUはマシン全体のCPU使用率を表し、統計結果はXcodeと一致します。PerfDog使用率 = Xcode使用率 / コア数。 |
メモリ使用率 | Android | PSS Memory、統計結果はAndroid Java API基準の結果と一致し、Meminfoとも一致します。 |
| iOS | Xcode Memory、XCode Debug gauges統計方法。 |
電力消費量 | テスト中に監視電力が100%から99%に低下すると記録を開始し、終了電力値が設定され、その比率に基づいて30分間の電力消費量が算出されます。 | |
発熱量の増分 | Appが起動していない場合は、ガンタイプ温度計を使用して現在の温度を測り、アプリを起動して各シーン、30分間実行します。発熱量の増分=30分後の温度 - アプリが起動していないときの温度。 | |
フィードバック