- User Guide
- Release Notes
- Product Introduction
- Purchase Guide
- ES Kernel Enhancement
- Getting Started
- Data Application Guide
- Elasticsearch Guide
- Best Practices
- API Documentation
- History
- Introduction
- API Category
- Making API Requests
- Instance APIs
- UpdateInstance
- RestartInstance
- DescribeInstances
- DeleteInstance
- CreateInstance
- DescribeInstanceOperations
- DescribeInstanceLogs
- UpgradeLicense
- UpgradeInstance
- UpdatePlugins
- RestartNodes
- RestartKibana
- UpdateRequestTargetNodeTypes
- GetRequestTargetNodeTypes
- DescribeViews
- UpdateDictionaries
- UpdateIndex
- DescribeIndexMeta
- DescribeIndexList
- DeleteIndex
- CreateIndex
- Data Types
- Error Codes
- FAQs
- Service Level Agreement
- Glossary
- New Version Introduction
ES allows access to your cluster through private VIP within your VPC. You can write code to access your cluster through the Elasticsearch REST client and import your data into the cluster. You can also ingest your data through Elasticsearch's official components such as Logstash and Beats.
This document takes the official components Logstash and Beats as examples to describe how to connect your data source of different types to ES.
Preparations
You need to create a CVM instance or a Docker cluster in the same VPC as the ES cluster, as accessing the ES cluster needs to be done within the VPC.
Using Logstash to Access ES Cluster
Accessing ES cluster from CVM
- Install and deploy Logstash and Java 8.
wget https://artifacts.elastic.co/downloads/logstash/logstash-5.6.4.tar.gz
tar xvf logstash-5.6.4.tar.gz
yum install java-1.8.0-openjdk  java-1.8.0-openjdk-devel -y
Please note that the Logstash version should be the same as the Elasticsearch version.
- Customize the
\*.confconfiguration file based on the data source type. For more information, please see Data Source Configuration File Description. - Run Logstash.
nohup ./bin/logstash -f ~/*.conf 2>&1 >/dev/null &
Accessing ES cluster from Docker
Creating Docker cluster
- Pull the official image of Logstash.
docker pull docker.elastic.co/logstash/logstash:5.6.9 - Customize the
\*.confconfiguration file based on the data source type and place it in the/usr/share/logstash/pipeline/directory which can be customized. - Run Logstash.
docker run --rm -it -v ~/pipeline/:/usr/share/logstash/pipeline/ docker.elastic.co/logstash/logstash:5.6.9
Using TKE
Tencent Cloud Docker clusters run on CVM instances, so you need to create a CVM cluster in the TKE Console first.
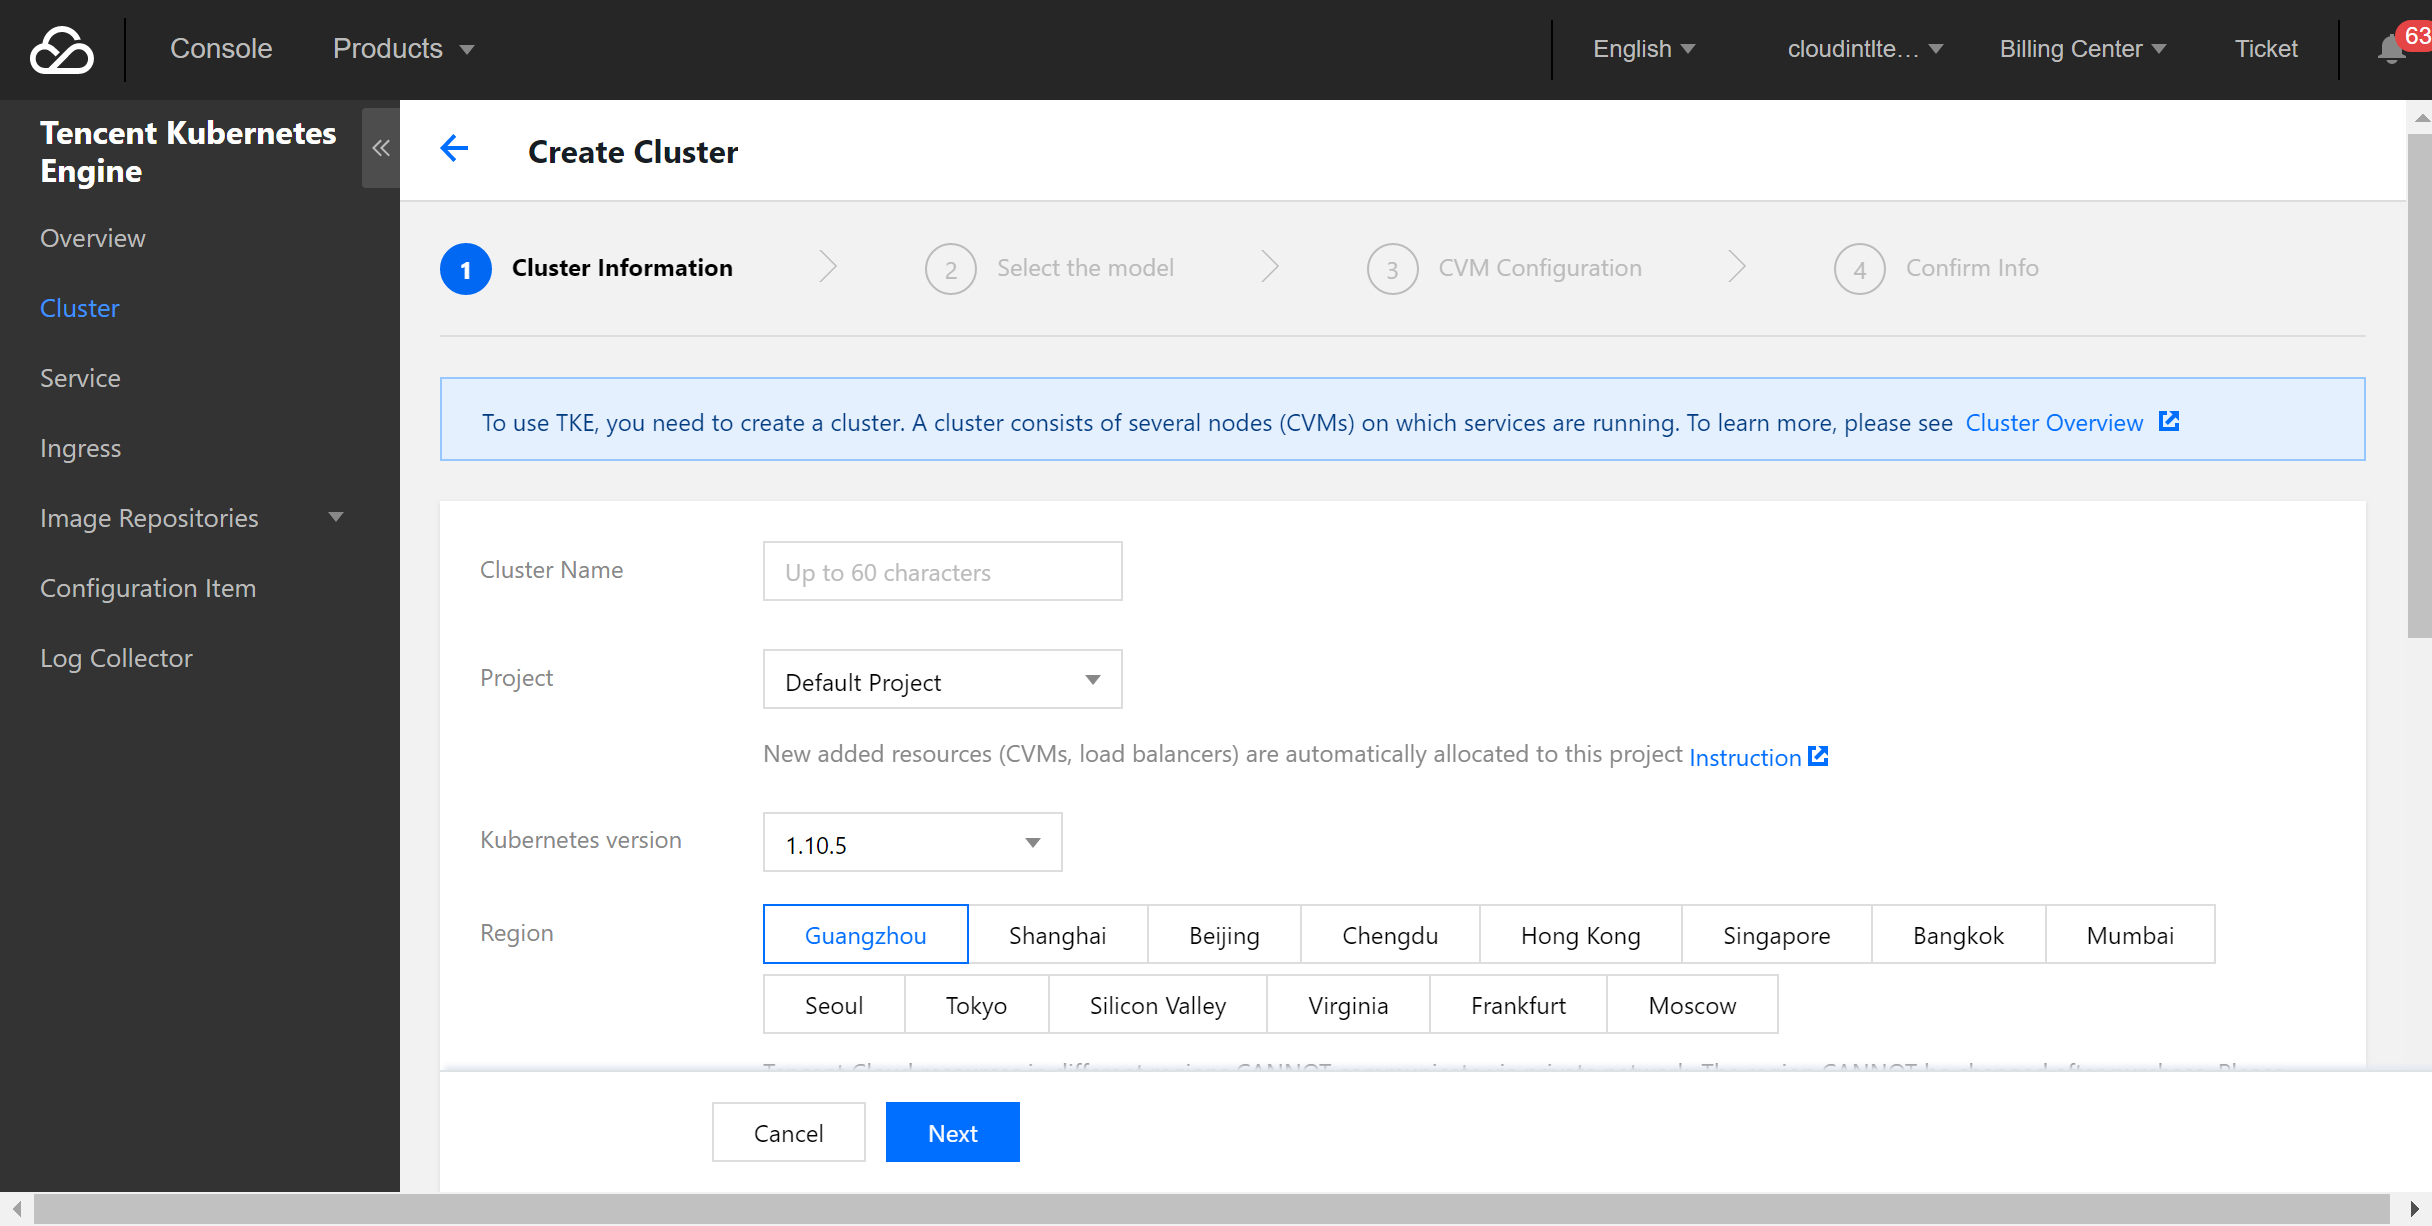
- Log in to the TKE Console and select Cluster > Create on the left sidebar to create a cluster.
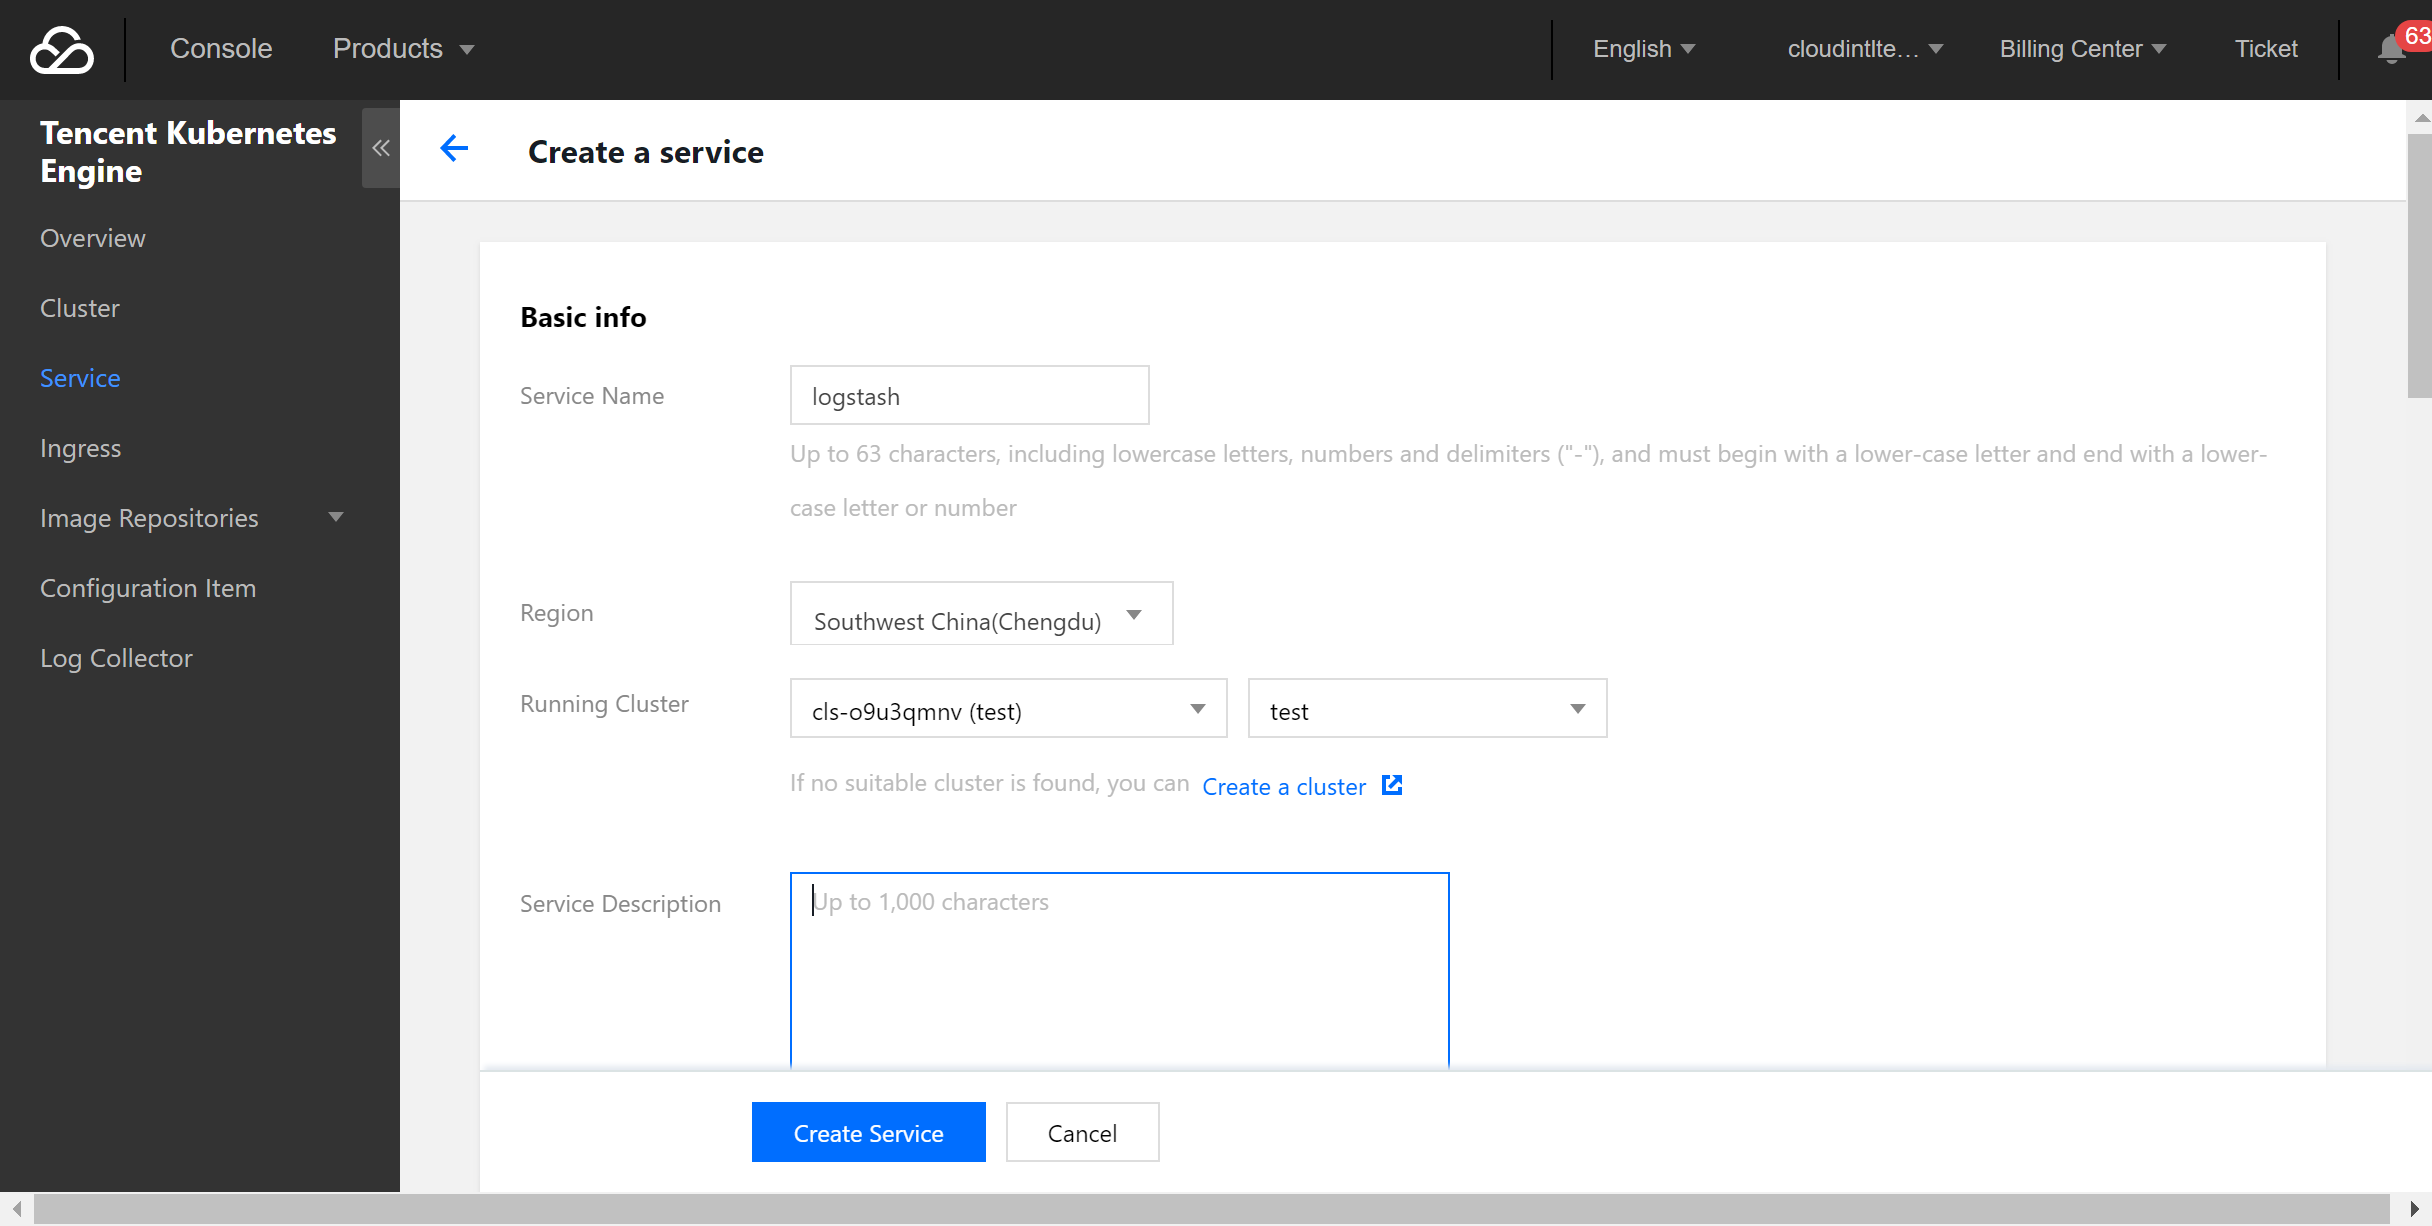
- Select Service on the left sidebar and click Create to create a service.
- Select the official image of Logstash.
In this example, the Logstash image provided by TencentHub image registry is used. You can also create a Logstash image by yourself.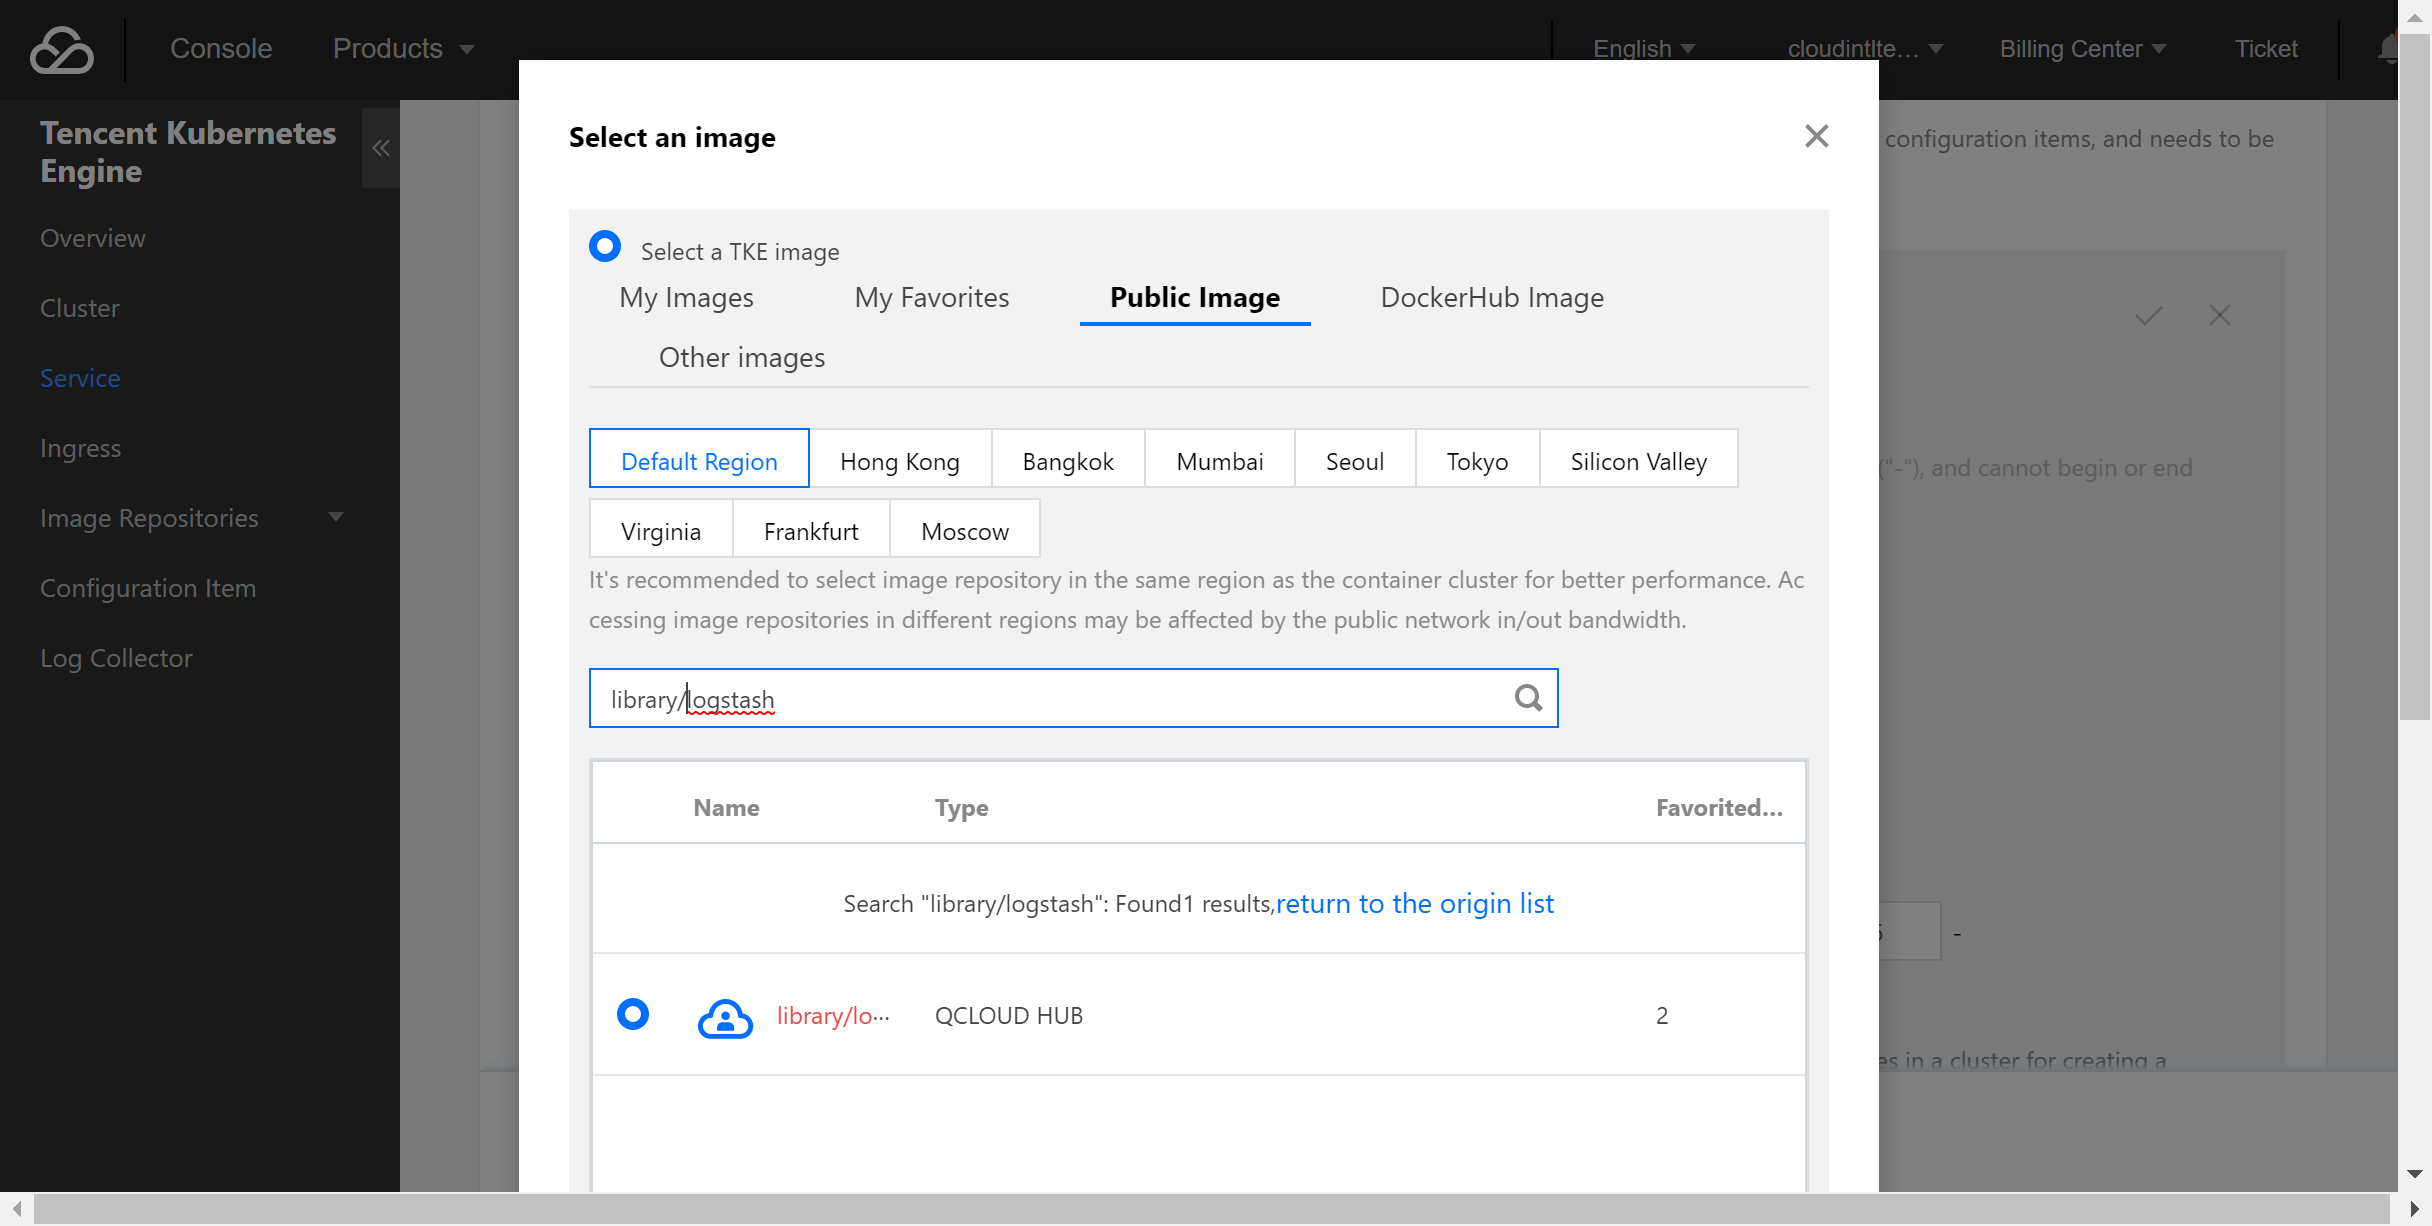
- Create a data volume.
Create a data volume to store the Logstash configuration file. In this example, a configuration file namedlogstash.confis added to the/data/configdirectory on the CVM instance and mounted to the/datadirectory of Docker, so that thelogstash.conffile can be read when the container starts.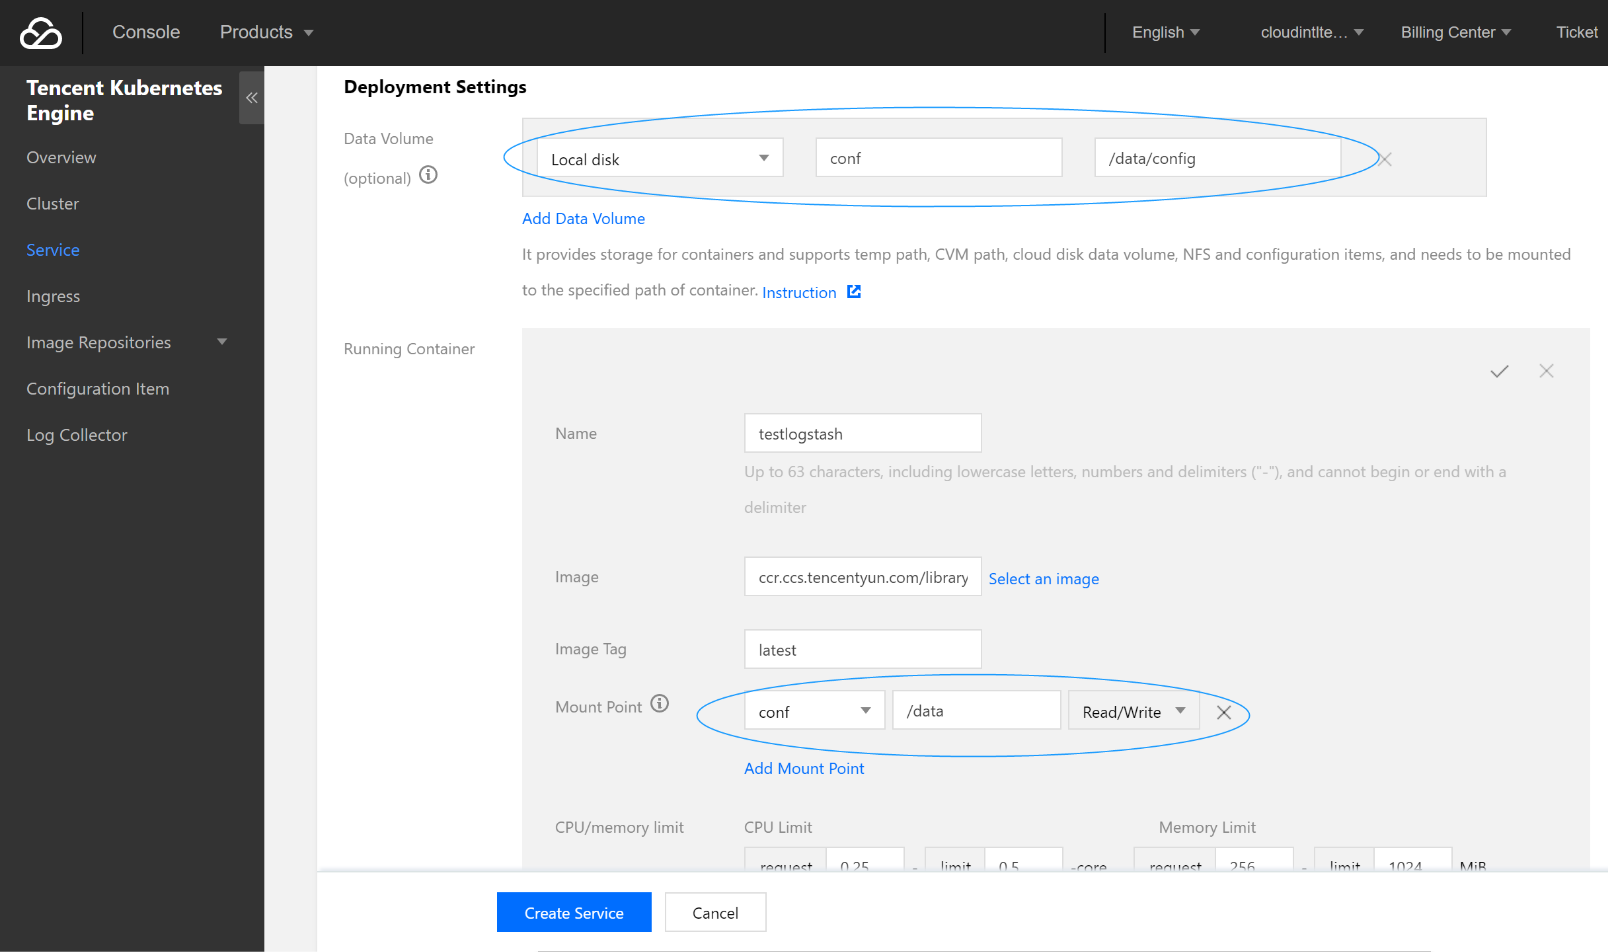
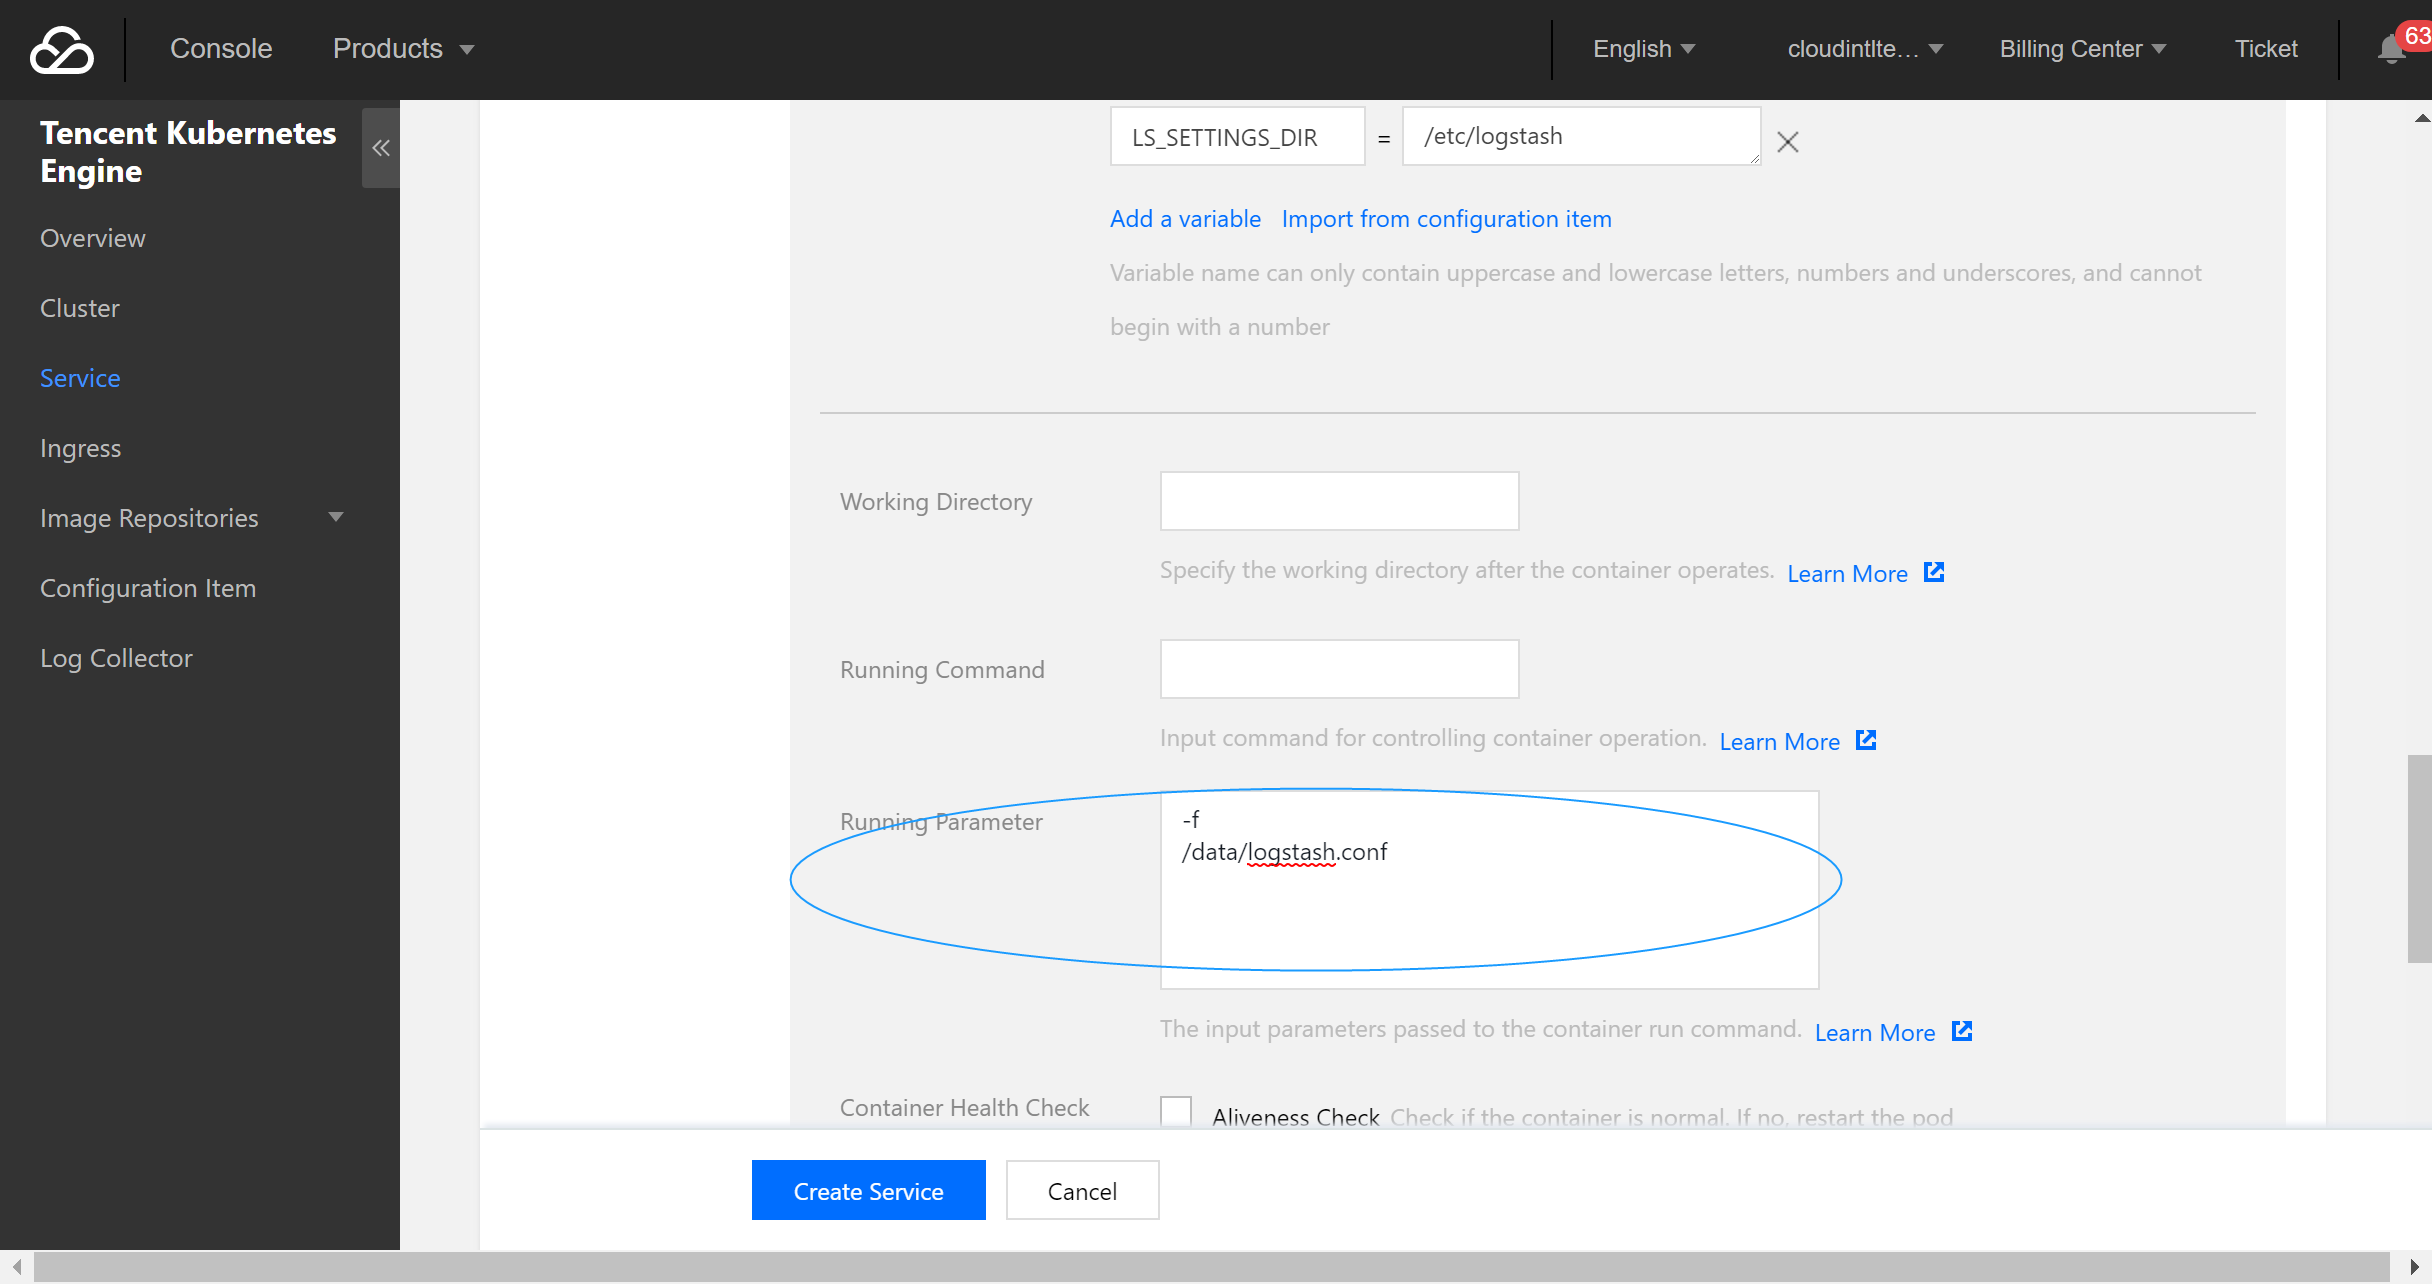
- Configure the execution parameters.
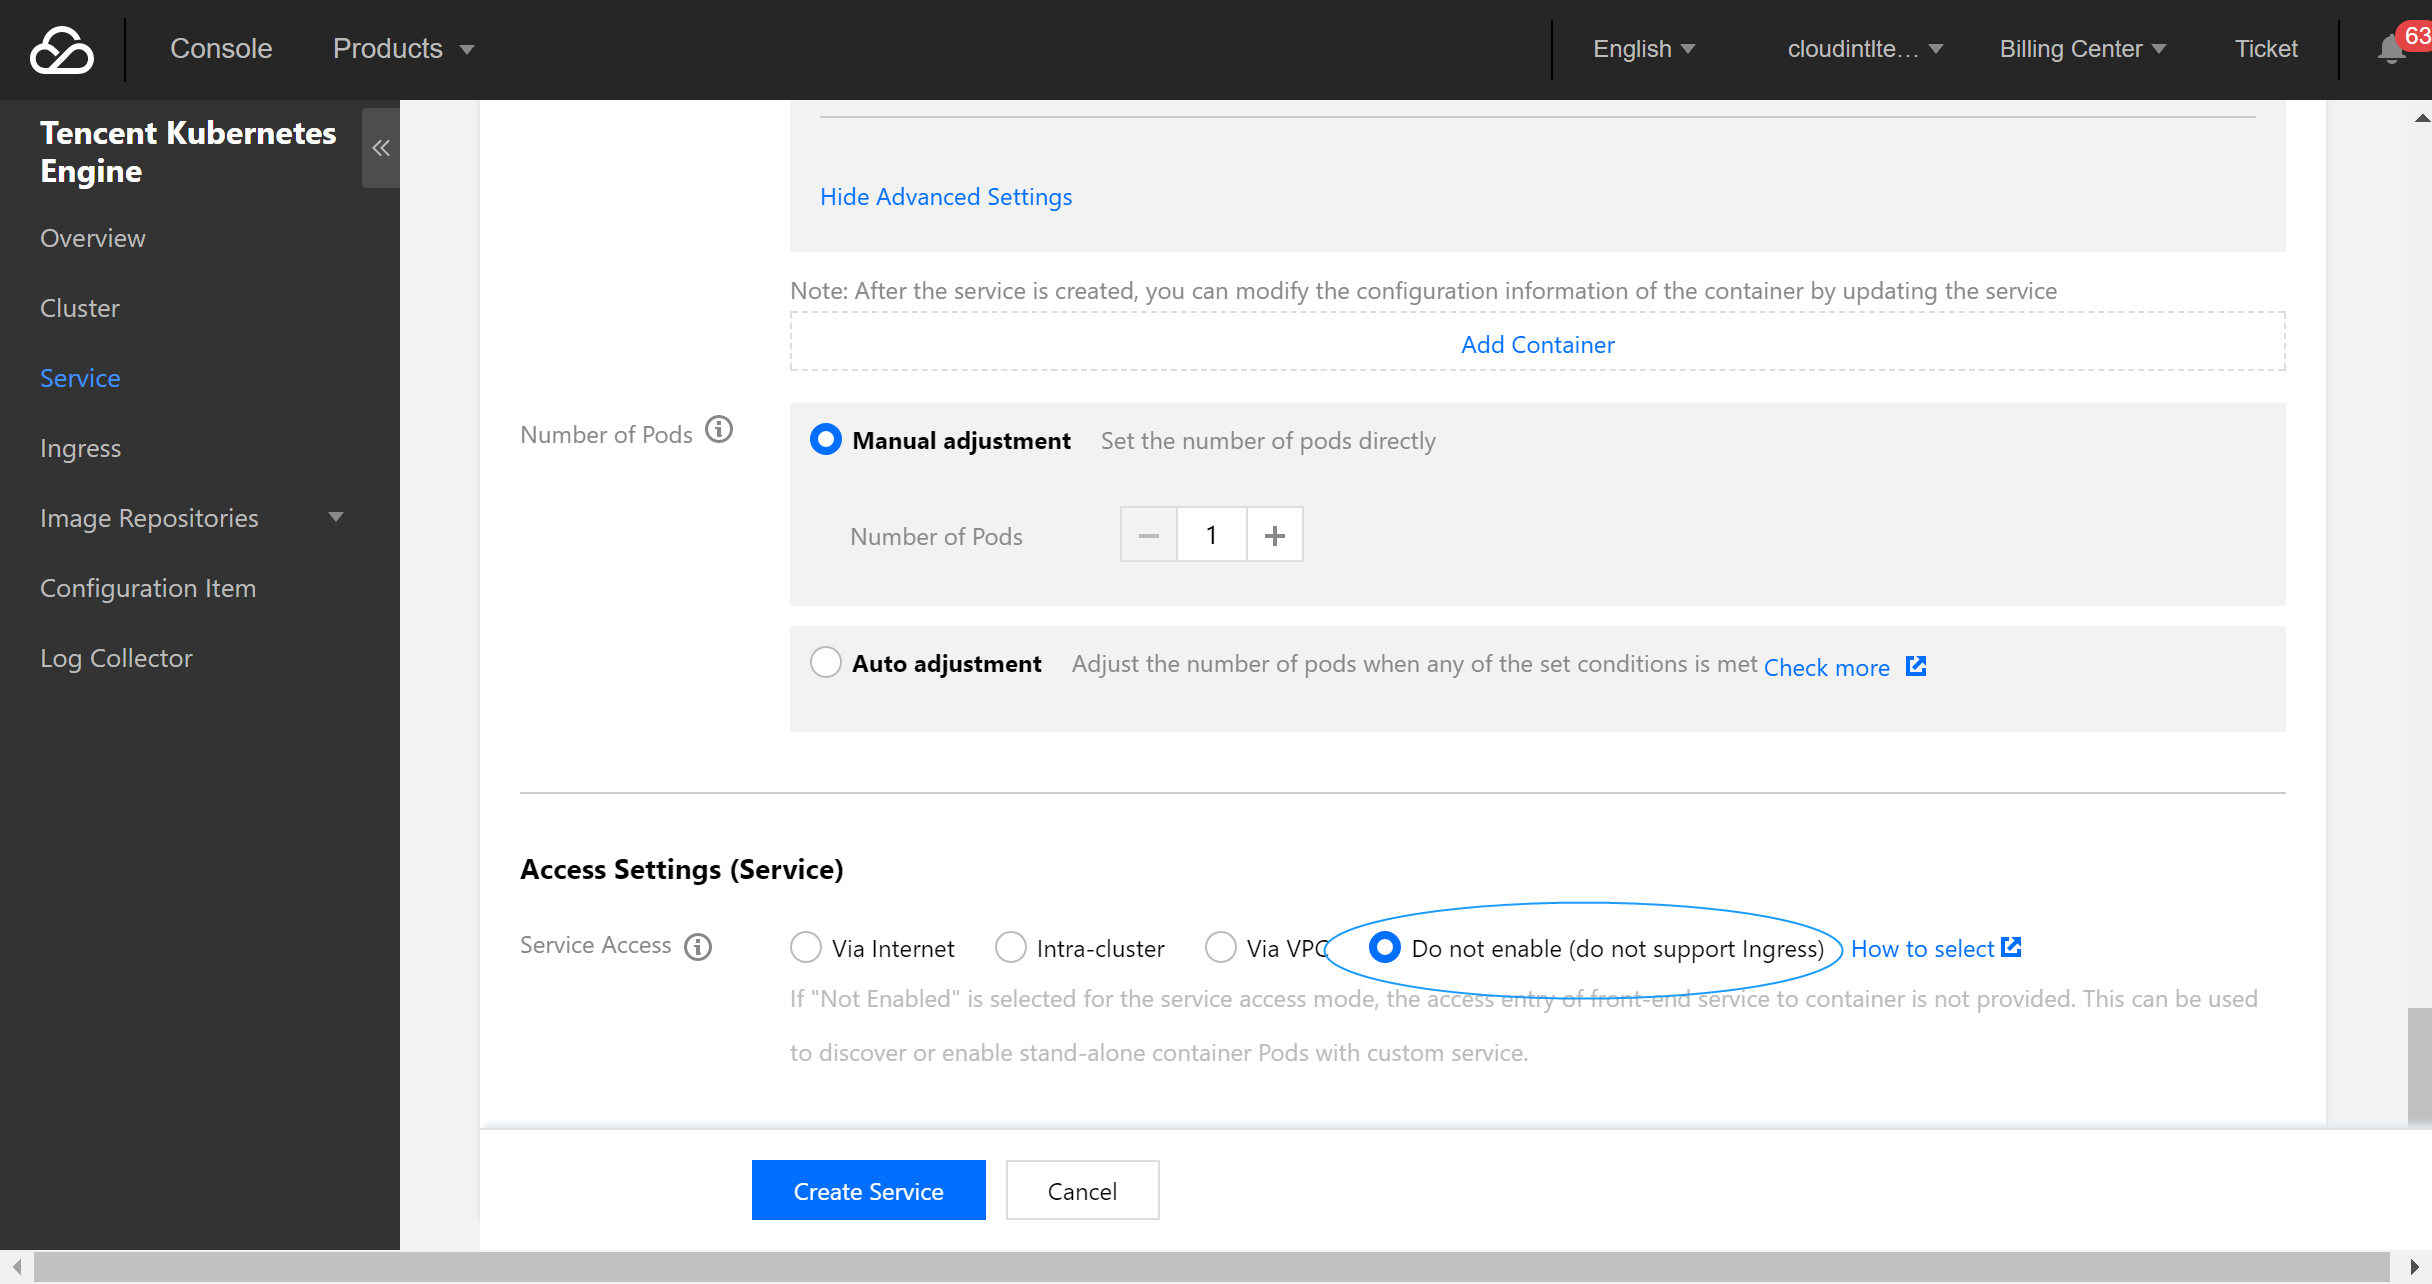
- Configure the service parameters and create a service as needed.
Configuration file description
File data sources
input {
    file {
        path => "/var/log/nginx/access.log" # File path
        }
}
filter {
}
output {
  elasticsearch {
    hosts => ["http://172.16.0.89:9200"] # Private VIP address and port of the ES cluster
    index => "nginx_access-%{+YYYY.MM.dd}" # Custom index name suffixed with date. One index is generated per day
 }
}
For more information on connecting file data sources, please see File input plugin.
Kafka data sources
input{
      kafka{
        bootstrap_servers => ["172.16.16.22:9092"]
        client_id => "test"
        group_id => "test"
        auto_offset_reset => "latest" # Start consumption from the latest offset
        consumer_threads => 5
        decorate_events => true # This attribute will bring the current topic, offset, group, partition, and other information into the message
        topics => ["test1","test2"] # Array type. Multiple topics can be configured
        type => "test" # Data source identification field
      }
}

output {
  elasticsearch {
    hosts => ["http://172.16.0.89:9200"] # Private VIP address and port of the ES cluster
    index => "test_kafka"
 }
}
For more information on connection Kafka data sources, please see Kafka input plugin.
Database data sources connected with JDBC
input {
    jdbc {
      # MySQL database address
      jdbc_connection_string => "jdbc:mysql://172.16.32.14:3306/test"
      # Username and password
      jdbc_user => "root"
      jdbc_password => "Elastic123"
      # Driver jar package. You need to download the jar when installing and deploying Logstash on your own as it is not provided by Logstash by default
      jdbc_driver_library => "/usr/local/services/logstash-5.6.4/lib/mysql-connector-java-5.1.40.jar"
      # Driver class name
      jdbc_driver_class => "com.mysql.jdbc.Driver"
      jdbc_paging_enabled => "true"
      jdbc_page_size => "50000"
      # Path and name of the SQL file to be executed
      #statement_filepath => "test.sql"
      # SQL statement to be executed
      statement => "select * from test_es"
      # Set the monitoring interval. The meanings of each field (from left to right) are minutes, hours, days, months, and years. If all of them are `*`, it indicates to update once every minute by default
      schedule => "* * * * *"
      type => "jdbc"
    }
}

output {
    elasticsearch {
        hosts => ["http://172.16.0.30:9200"]
        index => "test_mysql"
        document_id => "%{id}"
    }
}
For more information on connecting JDBC data sources, please see JDBC input plugin.
Using Beats to Access ES Cluster
Beats contains a variety of single-purpose collectors. These collectors are relatively lightweight and can be deployed and run on servers to collect data such as logs and monitoring information. Beats occupies less system resources than Logstash does.
Beats includes FileBeat for collecting file-type data, MetricBeat for collecting monitoring metric data, PacketBeat for collecting network packet data, etc. You can also develop your own Beats components based on the official libbeat library as needed.
Accessing ES cluster from CVM
- Install and deploy Filebeat.
wget https://artifacts.elastic.co/downloads/beats/filebeat/filebeat-5.6.4-linux-x86_64.tar.gz tar xvf filebeat-5.6.4.tar.gz - Configure
filebeat.yml. - Run Filebeat.
nohup ./filebeat 2>&1 >/dev/null &
Accessing ES cluster from Docker
Creating Docker cluster
- Pull the official image of Filebeat.
docker pull docker.elastic.co/beats/filebeat:5.6.9 - Customize the
\*.confconfiguration file based on the data source type and place it in the/usr/share/logstash/pipeline/directory which can be customized. - Run Filebeat.
docker run docker.elastic.co/beats/filebeat:5.6.9
Using TKE
The deployment method of Filebeat through TKE is similar to that of Logstash, and you can use the Filebeat image provided by Tencent Cloud.
Configuration file description
Configure the filebeat.yml file as follows:
// Input source configuration
filebeat.prospectors:
- input_type: log
    paths:
    - /usr/local/services/testlogs/*.log

// Output to ES
output.elasticsearch:
  # Array of hosts to connect to.
  hosts: ["172.16.0.39:9200"]
 Yes
Yes
 No
No
Was this page helpful?