You can view network monitoring data of CCN instances in the console to facilitate your troubleshooting.
Directions
1. Log in to the CCN console and enter the CCN management page.
2. On the CCN instance list page, click the ID/Name of the target CCN instance to enter its details page. Select the Monitoring tab.
3. View the following monitoring data of the current bandwidth limit mode:
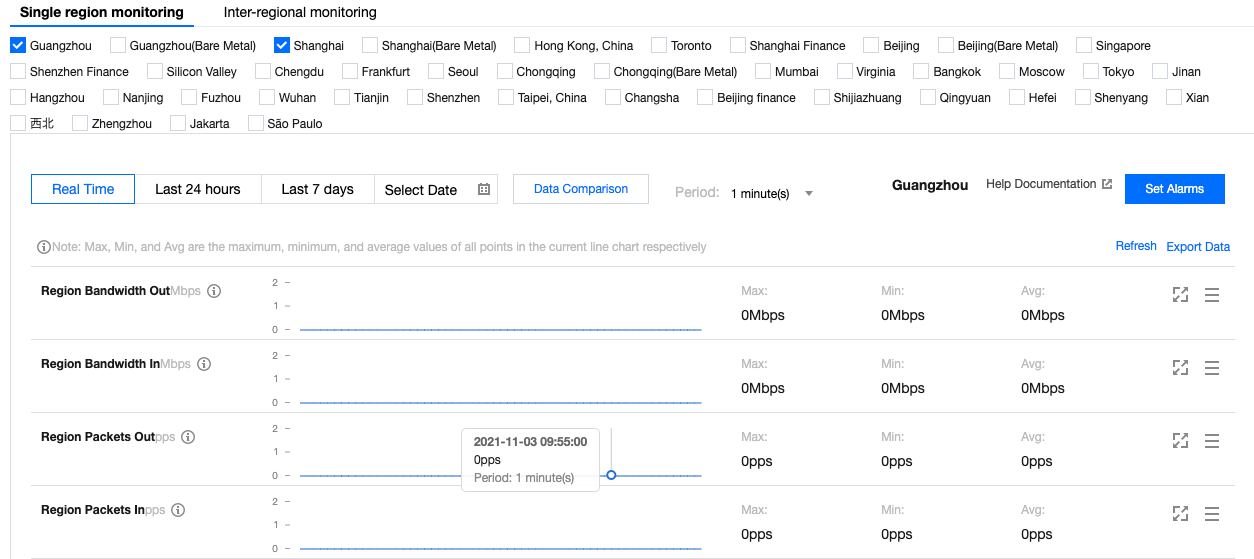
Single-region monitoring
Select a region where network instances are associated with the CCN instance, and view Region bandwidth out, Region bandwidth in, Region packets out and Region packets in metrics. You can click last 24 hours, last 7 days or specify a custom time range to view the monitoring data.
Region bandwidth out: The outbound bandwidth used by the network instances in this region.
Region bandwidth in: The inbound bandwidth used by the network instances in this region.
Region packets out: Number of data packets sent from the network instances in this region.
Region packets in: Number of data packets received by the network instances in this region.
Note:
Click the
icon to show more data of the selected metric. Click the
icon to download it.
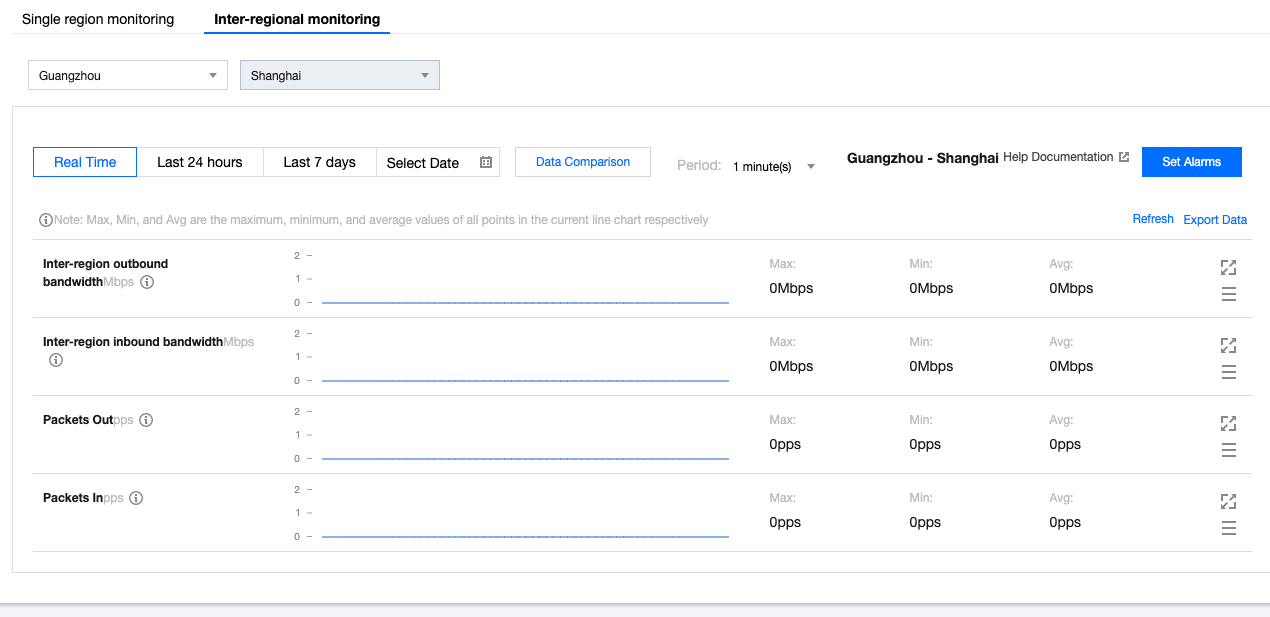
Inter-region monitoring
Select two regions where network instances are associated with the CCN instance, and view Inter-region outbound bandwidth, Inter-region inbound bandwidth, Packets out and Packets in metrics. You can click last 24 hours, last 7 days or specify a custom time range to view the monitoring data.
Inter-region outbound bandwidth: The outbound bandwidth used in the source region between the source and destination regions.
Inter-region inbound bandwidth: The inbound bandwidth used in the source region between the source and destination regions.
Packets out: Number of data packets sent from the source region to the destination region.
Packets in: Number of data packets received by the source region from the destination region.
Note:
Click the
icon to show more data of the selected metric. Click the
icon to download it.
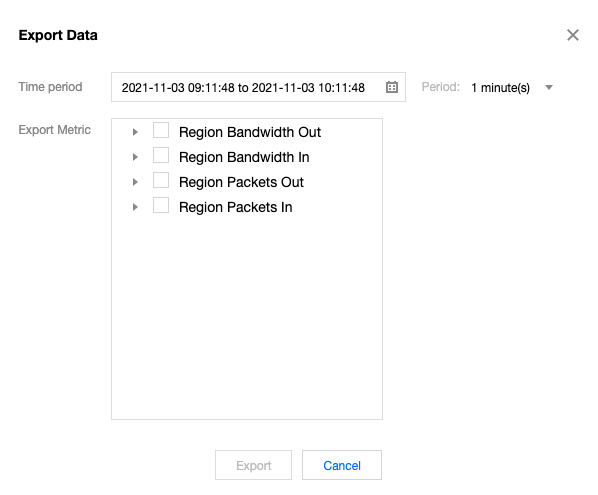
4. To export the monitoring data, click the top-right Export data. Specify the time range, time granularity and the metrics to export in the pop-up window, and click Export.


 Yes
Yes
 No
No
Was this page helpful?