Cluster events include event lists and event policies.
Event list: It records key change events and abnormal events occurring in the cluster.
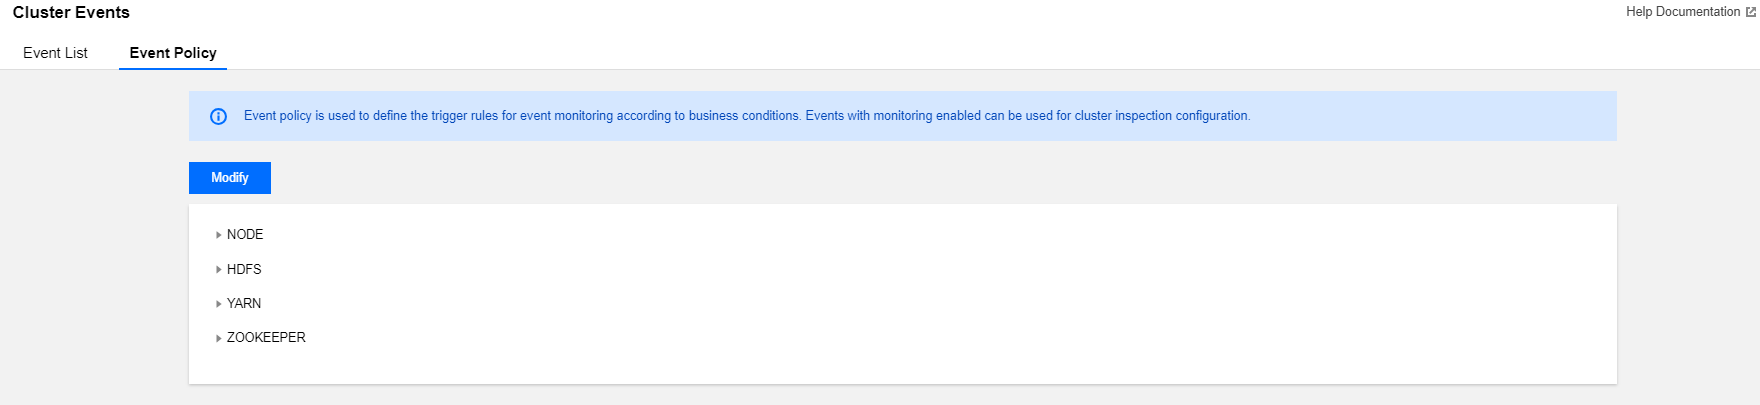
Event policy: Event monitoring trigger policies can be customized based on the actual business conditions. Events with monitoring enabled can be set as cluster inspection items.
Viewing Event List
1. Log in to the EMR console and click the ID/Name of the target cluster in the cluster list to enter the cluster details page.
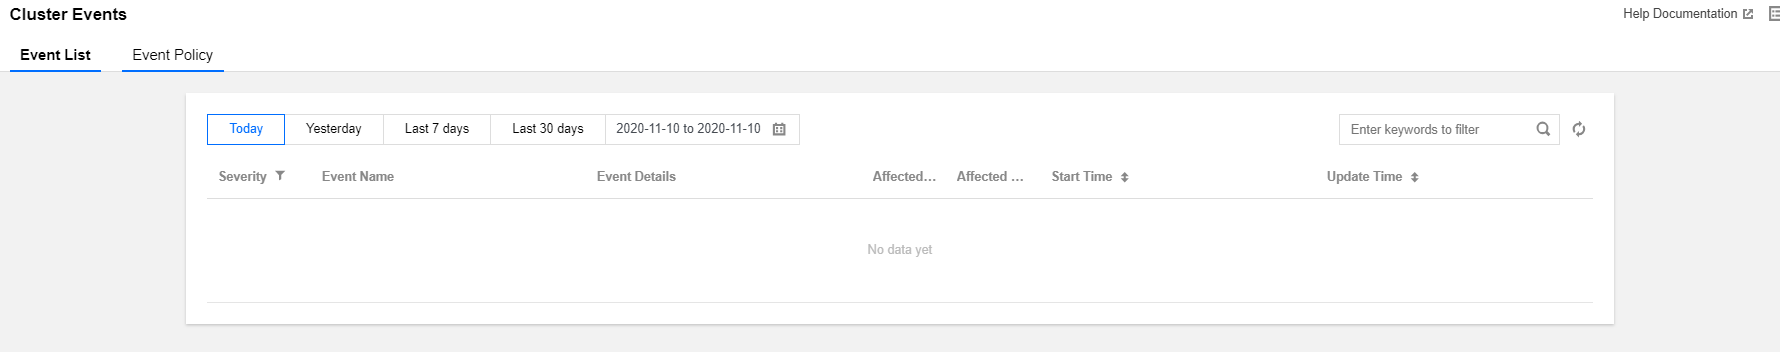
2. On the cluster details page, select Cluster monitoring > Cluster events > Event list to view all operation events in the current cluster.
The severity divides into the following:
Fatal: Exception events of a node or service that require manual intervention and will cause service interruption if left unattended. Such events may last for a period of time.
Severe: Alert events that currently have not caused service or node interruption but will cause fatal events if left unattended.
Moderate: Regular events occurring in the cluster that generally do not require special processing.
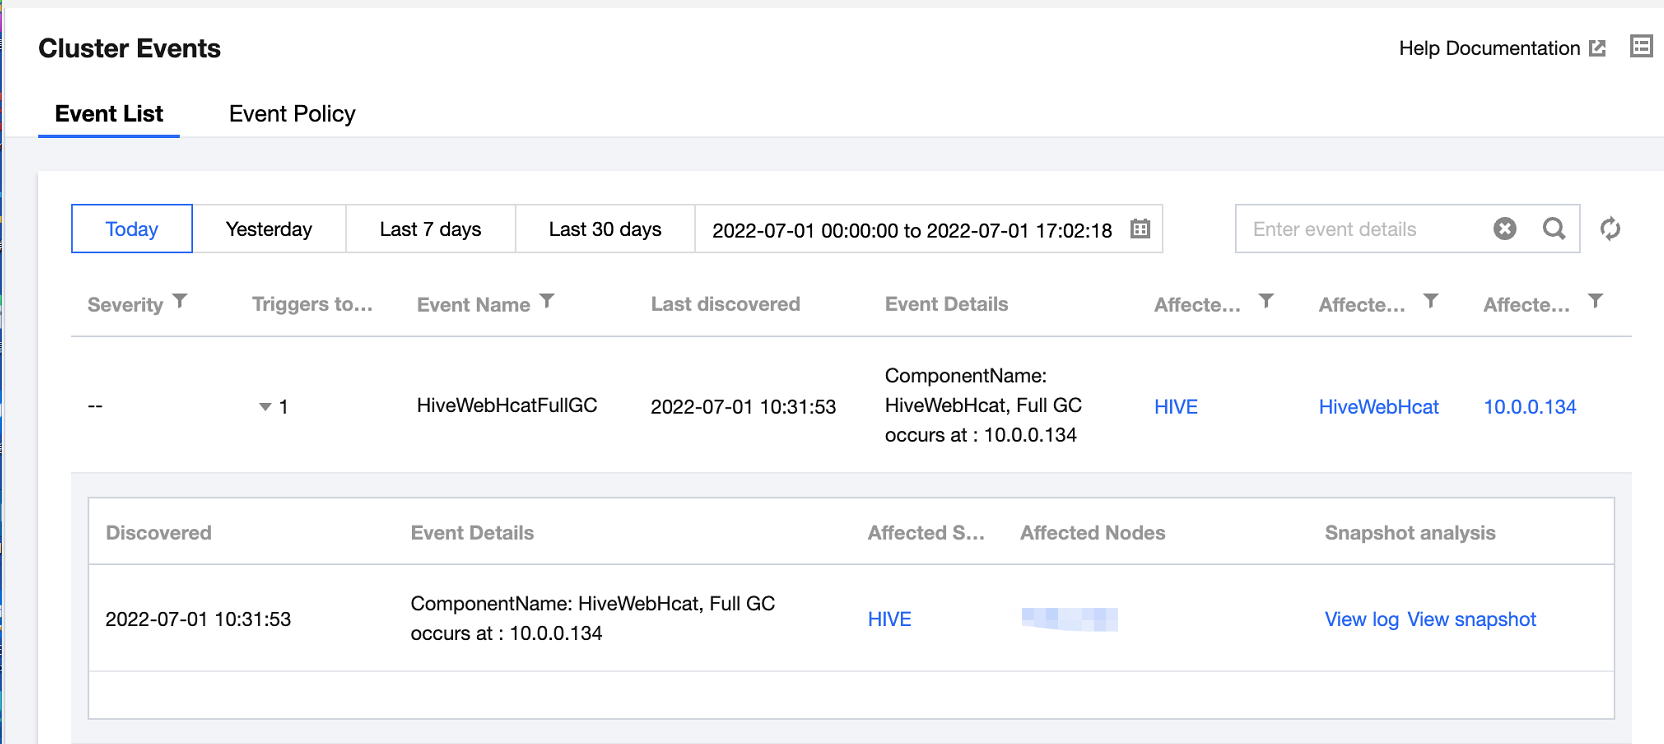
3. Click the value in the Triggers today column to view the event's trigger records, metrics, logs, and snapshots.
Setting Event Policies
1. Log in to the EMR console and click the ID/Name of the target cluster in the cluster list.
2. On the cluster details page, select Cluster monitoring > Cluster events > Event policy and you can customize the event monitoring trigger policies.
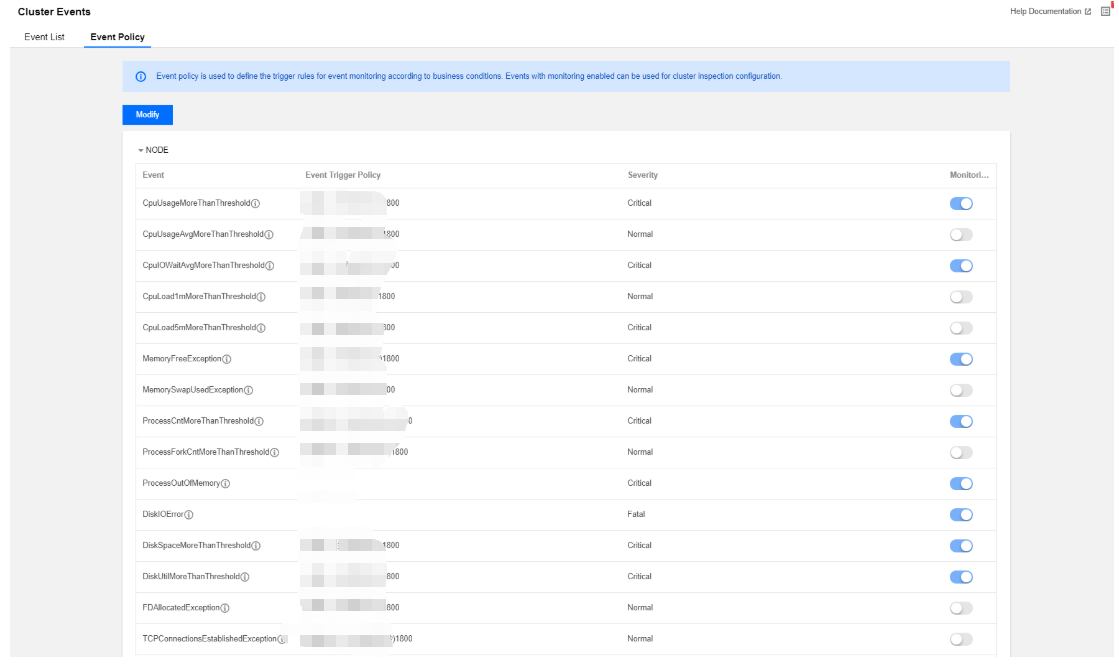
3. The event configuration list contains the event name, event trigger policy, severity (fatal, severe, and moderate), and option to enable/disable monitoring, which can be modified and saved.
4. Event trigger policies cover two types of events: fixed system policy events (which cannot be modified) and custom events (which can be configured based on the business standards).
5. You can select whether to enable event monitoring in an event policy. Only events with monitoring enabled can be selected as cluster inspection items. Monitoring is enabled by default for some events and is enabled by default and cannot be disabled for some other events. The following are the specific rules:
Category
Event Name
Description
Recommendations and Measure
Default Value
Severity
Disabling Allowed
Enabled by Default
Node
The average CPU utilization exceeds the threshold
The average server CPU utilization has been greater than or equal to m for t (300 ≤ t ≤ 2,592,000) seconds continuously
Expand the node capacity or upgrade the node
m=85, t=1,800
Moderate
Yes
No
The average CPU io wait utilization exceeds the threshold
The average CPU iowait utilization of the server in the last t (300 ≤ t ≤ 2,592,000) seconds has been greater than or equal to m
Manually troubleshoot the issue
m=60, t=1,800
Severe
Yes
Yes
The 1-minute CPU load exceeds the threshold continuously
The 1-minute CPU load has been greater than or equal to m for t (300 ≤ t ≤ 2,592,000) seconds continuously
Expand the node capacity or upgrade the node
m=8, t=1,800
Moderate
Yes
No
The 5-minute CPU load exceeds the threshold continuously
The 5-minute CPU load has been greater than or equal to m for t (300 ≤ t ≤ 2,592,000) seconds continuously
Expand the node capacity or upgrade the node
m=8, t=1,800
Severe
Yes
No
The memory utilization exceeds the threshold continuously
The memory utilization has been greater than or equal to m for t (300 ≤ t ≤ 2,592,000) seconds continuously
Expand the node capacity or upgrade the node
m=85, t=1,800
Severe
Yes
Yes
The total number of system processes exceeds the threshold continuously
The total number of system processes has been greater than or equal to m for t (300 ≤ t ≤ 2,592,000) seconds continuously
Manually troubleshoot the issue
m=10,000, t=1,800
Severe
Yes
Yes
The node file handle utilization exceeds the threshold continuously
The node file handle utilization has been greater than or equal to m for t (300 ≤ t ≤ 2,592,000) seconds continuously
Manually troubleshoot the issue
m=85, t=1,800
Moderate
Yes
No
The number of TCP connections to the node exceeds the threshold continuously
The number of TCP connections to the node has been greater than or equal to m for t (300 ≤ t ≤ 2,592,000) seconds continuously
Check whether there are connection leaks
m=10,000, t=1,800
Moderate
Yes
No
The configured node memory utilization exceeds the threshold
The memory utilization configured for all roles on the node exceeds the node's physical memory threshold
Adjust the allocated node process heap memory
90%
Severe
Yes
No
Metadatabase exception
The metadatabase cannot be connected properly using the connection test command.
Manually troubleshoot the issue
-
Severe
Yes
Yes
The utilization of a single disk exceeds the threshold continuously
The single disk space utilization has been greater than or equal to m for t (300 ≤ t ≤ 2,592,000) seconds continuously
Expand the node capacity or upgrade the node
m=0.85, t=1,800
Severe
Yes
Yes
The I/O utilization of a single disk exceeds the threshold continuously
The single disk I/O device utilization has been greater than or equal to m for t (300 ≤ t ≤ 2,592,000) seconds continuously
Expand the node capacity or upgrade the node
m=0.85, t=1,800
Severe
Yes
Yes
The single disk inodes utilization exceeds the threshold continuously
The single disk inodes utilization has been greater than or equal to m for t (300 ≤ t ≤ 2,592,000) seconds continuously
Expand the node capacity or upgrade the node
m=0.85, t=1,800
Severe
Yes
Yes
The difference between the UTC time and NTP time of the server exceeds the threshold
The difference between the UTC time and NTP time of the server exceeds the threshold (in ms)
1. Make sure that the NTP daemon is running.
2. Make sure that the network communication with the NTP server is normal.
Difference=30000
Severe
Yes
Yes
Automatic node replenishment
If automatic node replenishment is enabled, when any exceptions in task and router nodes are detected, the system automatically purchases nodes of the same model to replace the affected nodes.
1. If the replenishment is successful, no more attention is required.
2. If the replenishment fails, manually terminate the affected nodes in the console and purchase new nodes to replace them.
An operational exception has occurred on the instance, requiring authorization for maintenance.
Log in to the Cloud Virtual Machine (CVM) console > Maintenance Task to authorize the maintenance task.
-
Severe
Yes
Yes
Instance operational risk pending authorization
The instance operational risks are pending authorization.
Log in to the Cloud Virtual Machine (CVM) console > Maintenance Task to authorize the maintenance task.
-
Severe
Yes
No
Connection tracking table full
The connection tracking table is full.
1.Manually troubleshoot the issue.
2.Submit a ticket for consultation.
-
Severe
Yes
No
Sub-machine NVMe device error
Disk dropout is caused by a sub-machine NVMe device error.
1.Isolate the read/write operations of the problematic disk and uninstall the corresponding directory.
2.Submit a ticket for consultation.
-
Severe
Yes
Yes
Packet loss due to the exceeded connection limit
Packet loss occurs due to an exceeded connection limit.
1.Manually troubleshoot the issue.
2.Submit a ticket for consultation.
-
Severe
Yes
No
Packet loss due to the exceeded outbound public network bandwidth
Packet loss occurs when the outbound public network bandwidth of the Cloud Virtual Machine (CVM) instance exceeds the outbound public network bandwidth limit of the host. Packet loss caused by bandwidth data spikes will not be reflected in the bandwidth charts.
Cause: The finest granularity for bandwidth statistics is level 10 (total traffic within 10 seconds/10 seconds). If the constant bandwidth does not significantly exceed the limit, this issue can be ignored.
Increase the public network bandwidth cap. If the maximum purchase limit is reached, you can use load balancing or similar methods to reduce the bandwidth for a single machine.
-
Severe
Yes
No
Machine restart
The machine restarts.
This event is triggered when a CVM is restarted. Check whether the status change meets expectations based on the actual situation.
-
Severe
Yes
Yes
Memory OOM
System memory usage is overloaded.
Evaluate whether the currently configured system memory meets the business memory requirements. If more memory is needed, it is recommended to upgrade the CVM memory configurations.
-
Severe
Yes
Yes
Kernel failure
A fatal error has occurred in the operating system kernel due to a bug in the operating system kernel or a driver issue.
Check whether the system has loaded any kernel driver modules other than the native kernel drivers. Try not to load these modules and observe the system's operation.
-
Severe
Yes
Yes
Read-only disk
Data cannot be written to the disk.
Check whether the current running status of the CVM is normal. If the system hangs or similar issues occur, it can be recovered by performing a restart (forced restart) via the console.
-
Severe
Yes
Yes
Node metric data collection loss
Node metric data collection exception has occurred.
Manually troubleshoot the issue.
-
Moderate
Yes
Yes
HDFS
The total number of HDFS files exceeds the threshold continuously
The total number of files in the cluster has been greater than or equal to m for t (300 ≤ t ≤ 2,592,000) seconds continuously
Increase the NameNode memory
m=50,000,000, t=1,800
Severe
Yes
No
The total number of HDFS blocks exceeds the threshold continuously
The total number of blocks in the cluster has been greater than or equal to m for t (300 ≤ t ≤ 2,592,000) seconds continuously
Increase the NameNode memory or the block size
m=50,000,000, t=1,800
Severe
Yes
No
The number of HDFS data nodes marked as dead exceeds the threshold continuously
The number of data nodes marked as dead has been greater than or equal to m for t (300 ≤ t ≤ 2,592,000) seconds continuously
Manually troubleshoot the issue
m=1, t=1,800
Moderate
Yes
No
The HDFS storage space utilization exceeds the threshold continuously
The HDFS storage space utilization has been greater than or equal to m for t (300 ≤ t ≤ 2,592,000) seconds continuously
Clear files in HDFS or expand the cluster capacity
m=85, t=1,800
Severe
Yes
Yes
Active/Standby NameNodes were switched
Active/Standby NameNodes were switched
Locate the cause of NameNode switch
-
Severe
Yes
Yes
The NameNode RPC request processing latency exceeds the threshold continuously
The RPC request processing latency has been greater than or equal to m milliseconds for t (300 ≤ t ≤ 2,592,000) seconds continuously
Manually troubleshoot the issue
m=300, t=300
Severe
Yes
No
The number of current NameNode connections exceeds the threshold continuously
The number of current NameNode connections has been greater than or equal to m for t (300 ≤ t ≤ 2,592,000) seconds continuously
Manually troubleshoot the issue
m=2,000, t=1,800
Moderate
Yes
No
A full GC event occurred on a NameNode
A full GC event occurred on a NameNode
Fine-tune the parameter settings
-
Severe
Yes
Yes
The NameNode JVM memory utilization exceeds the threshold continuously
The NameNode JVM memory utilization has been greater than or equal to m for t (300 ≤ t ≤ 2,592,000) seconds continuously
Adjust the NameNode heap memory size
m=85, t=1,800
Severe
Yes
Yes
The DataNode RPC request processing latency exceeds the threshold continuously
The RPC request processing latency has been greater than or equal to m milliseconds for t (300 ≤ t ≤ 2,592,000) seconds continuously
Manually troubleshoot the issue
m=300, t=300
Moderate
Yes
No
The number of current DataNode connections exceeds the threshold continuously
The number of current DataNode connections has been greater than or equal to m for t (300 ≤ t ≤ 2,592,000) seconds continuously
Manually troubleshoot the issue
m=2,000, t=1,800
Moderate
Yes
No
A full GC event occurred on a DataNode
A full GC event occurred on a NameNode
Fine-tune the parameter settings
-
Moderate
Yes
No
The DataNode JVM memory utilization exceeds the threshold continuously
The NameNode JVM memory utilization has been greater than or equal to m for t (300 ≤ t ≤ 2,592,000) seconds continuously
Adjust the DataNode heap memory size
m=85, t=1,800
Moderate
Yes
Yes
Both NameNodes of HDFS are in Standby service status
Both NameNode roles are in Standby status at the same time
Manually troubleshoot the issue
-
Severe
Yes
Yes
The number of HDFS MissingBlocks exceeds the threshold continuously.
The number of missing blocks in the cluster has been greater than or equal to m for t (300 ≤ t ≤ 604,800) seconds continuously
We recommend you troubleshoot HDFS data block corruption and run the
hadoop fsck /
command to check the HDFS file distribution
m=1, t=1,800
Severe
Yes
Yes
HDFS NameNode enters safe mode
The NameNode has entered safe mode (for 300 seconds continuously).
It is recommended to troubleshoot HDFS data block corruption and run the hadoop fsck / command to check the HDFS file distribution.
-
Severe
Yes
Yes
HDFS NameNode
Not performed for an extended period
checkpoint
The HDFS NameNode has not performed a checkpoint for an extended period.
1. Check the status of the SecondaryNameNode (Standby NameNode).
2. Check the parameters dfs.namenode.checkpoint.period and dfs.namenode.checkpoint.txns
3. in the HDFS configuration file hdfs-site.xml.
4. View the log information of the HDFS cluster.
m=24
Moderate
Yes
Yes
HDFS small file proportion exceeds the specified threshold
The proportion of small files is greater than or equal to 50%, inspected once per day.
Merge small files of the same type, regularly clean up small files, or use Cloud Object Storage (COS) to store them.
m=50
Moderate
Yes
Yes
HDFS directory full
The HDFS directory exists with the number of nodes exceeding the alert threshold.
Remove the number of nodes in the directory or increase the capacity limit of the directory.
m=95
Severe
Yes
Yes
YARN
The number of currently missing NodeManagers in the cluster exceeds the threshold continuously
The number of currently missing NodeManagers in the cluster has been greater than or equal to m for t (300 ≤ t ≤ 2,592,000) seconds continuously
Check the NodeManager process status and check whether the network connection is smooth
m=1, t=1,800
Moderate
Yes
No
The number of pending containers exceeds the threshold continuously
The number of pending containers has been greater than or equal to m for t (300 ≤ t ≤ 2,592,000) seconds continuously
Reasonably specify resources that can be used by YARN jobs
m=90, t=1,800
Moderate
Yes
No
The cluster memory utilization exceeds the threshold continuously
The memory utilization has been greater than or equal to m for t (300 ≤ t ≤ 2,592,000) seconds continuously
Scale out the cluster
m=85, t=1,800
Severe
Yes
Yes
The cluster CPU utilization exceeds the threshold continuously
The CPU utilization has been greater than or equal to m for t (300 ≤ t ≤ 2,592,000) seconds continuously
Scale out the cluster
m=85, t=1,800
Severe
Yes
Yes
The number of available CPU cores in each queue is below the threshold continuously.
The number of available CPU cores in each queue has been less than or equal to m for t (300 ≤ t ≤ 2,592,000) seconds continuously
Assign more resources to the queue
m=1, t=1,800
Moderate
Yes
No
The available memory in each queue is below the threshold continuously
The available memory in each queue has been less than or equal to m for t (300 ≤ t ≤ 2,592,000) seconds continuously
Assign more resources to the queue
m=1,024, t=1,800
Moderate
Yes
No
Active/Standby ResourceManagers were switched
Active/Standby ResourceManagers were switched
Check the ResourceManager process status and view the standby ResourceManager logs to locate the cause of active/standby switch
-
Severe
Yes
Yes
A full GC event occurred in a ResourceManager
A full GC event occurred in a ResourceManager
Fine-tune the parameter settings
-
Severe
Yes
Yes
The ResourceManager JVM memory utilization exceeds the threshold continuously
The ResourceManager JVM memory utilization has been greater than or equal to m for t (300 ≤ t ≤ 2,592,000) seconds continuously
Adjust the ResourceManager heap memory size
m=85, t=1,800
Severe
Yes
Yes
A full GC event occurred in a NodeManager
A full GC event occurred in a NodeManager
Fine-tune the parameter settings
-
Moderate
Yes
No
The available memory in NodeManager is below the threshold continuously
The available memory in a single NodeManager has been less than or equal to m for t (300 ≤ t ≤ 2,592,000) seconds continuously
Adjust the NodeManager heap memory size
m=1, t=1,800
Moderate
Yes
No
The NodeManager JVM memory utilization exceeds the threshold continuously
The NodeManager JVM memory utilization has been greater than or equal to m for t (300 ≤ t ≤ 2,592,000) seconds continuously
Adjust the NodeManager heap memory size
m=85, t=1,800
Moderate
Yes
No
YARN ResourceManager has no active status
YARN ResourceManager has no active status.
Manually troubleshoot the issue.
t=90
Severe
Yes
Yes
Running failure count of YARN Application jobs exceeds the threshold continuously
YARN Application jobs fail to execute.
Manually troubleshoot the issue.
m=1,t=300
Moderate
Yes
No
Current unhealthy YARN NodeManager count exceeds the threshold continuously
The unhealthy NodeManager count has been greater than or equal to m for
t (300 ≤ t ≤ 2,592,000) seconds continuously.
Manually troubleshoot the issue.
m=1,t=1800
Moderate
Yes
No
For the Application query metadata-accelerated bucket, the bandwidth of a single bucket exceeds the specified threshold
For the Application query metadata acceleration bucket,
the read bandwidth of a single bucket exceeds or is equal to the specified threshold of
>=m(GB/s),
the write bandwidth of a single bucket exceeds or is equal to the specified threshold of
>=m(GB/s)
Manually troubleshoot the issue.
m1=10(GB/s) m2=10(GB/s)
Moderate
Yes
No
For the Application query metadata-accelerated bucket, the request frequency of a single bucket exceeds the specified threshold
For the Application query metadata acceleration bucket, the API request frequency of a single bucket exceeds or is equal to the specified threshold of m requests per second.
Manually troubleshoot the issue.
m1=10000
m2=10000 m3=10000 m4=10000
Moderate
Yes
No
YARN Application runtime exceeds the threshold
The YARN Application runtime is greater than or equal to m minutes.
Manually troubleshoot the issue.
t=30min
Moderate
Yes
No
Blocklisted NodeManager threshold
The number of blocklisted nodes in the Application exceeds the threshold.
Manually troubleshoot the issue.
m=0
Moderate
Yes
No
Metadata acceleration bucket or CHDFS traffic bandwidth gets full
A COS bucket generates 503 errors within 10 minutes.
Manually troubleshoot the issue.
m=3.8
Moderate
Yes
No
YARN Queue (Requires Application)
The resource utilization of the queue exceeds the specified threshold.
The APP's resource utilization of the YARN queue exceeds the threshold.
Manually troubleshoot the issue.
Queue APP m = 50
Moderate
Yes
No
APP's physical node local disk utilization of the queue exceeds the specified threshold
The APP's physical node local disk utilization of the YARN queue exceeds a certain threshold on a single node.
Manually troubleshoot the issue.
Queue APP m = 50
Moderate
Yes
No
APP's physical node CPU utilization of the queue exceeds the specified threshold
The APP's physical CPU utilization of the YARN queue exceeds a certain proportion on a single node.
Manually troubleshoot the issue.
Queue APP m = 50
Moderate
Yes
No
Alarm: The queue task execution crosses midnight.
The YARN queue task execution crosses midnight.
Manually troubleshoot the issue.
None
Moderate
Yes
No
Queue task runtime exceeds the threshold
The execution time of tasks in the YARN queue exceeds the preset threshold (minutes).
1. Check task configurations: Confirm whether the timeout threshold set for the task is reasonable.
2. Allocate resources: Check the queue's resource allocation to ensure that tasks have sufficient resources to run.
3. Analyze logs: View the task logs to locate the specific cause for the timeout.
4. Optimize tasks: Optimize task logics or resource configurations based on analysis results.
m=10 min
Moderate
Yes
No
YARN
(Grayscale Support Requires Enabling Related Insights)
Application physical CPU utilization exceeds the specified threshold
The Application physical CPU utilization exceeds a certain proportion.
Manually troubleshoot the issue.
m=50
Moderate
Yes
No
Application physical memory utilization exceeds the specified threshold
The Application physical memory utilization exceeds a certain proportion.
Manually troubleshoot the issue.
m=50
Moderate
Yes
No
Application physical node disk read-write exceeds the specified threshold
The Application physical disk read-write IO exceeds a certain threshold on a single node.
Manually troubleshoot the issue.
m=50 (kb/s)
Moderate
Yes
No
Application physical node CPU utilization exceeds the specified threshold
The Application physical CPU utilization exceeds a certain proportion on a single node.
Manually troubleshoot the issue.
m=50
Moderate
Yes
No
Application physical node memory utilization exceeds the specified threshold
The Application physical memory utilization exceeds a certain proportion on a single node.
Manually troubleshoot the issue.
m=50
Moderate
Yes
No
Application job day-over-day submission count exceeds the specified threshold
The Application job day-over-day submission count exceeds the specified threshold.
Manually troubleshoot the issue.
m=50
Moderate
Yes
No
Application's physical node local disk utilization exceeds the specified threshold
The Application's physical node local disk utilization exceeds a certain threshold on a single node.
Manually troubleshoot the issue.
m=60
Moderate
Yes
No
HBase
The number of regions in RIT status in the cluster exceeds the threshold continuously
The number of regions in RIT status in the cluster has been greater than or equal to m for t (300 ≤ t ≤ 2,592,000) seconds continuously
If the HBase version is below 2.0, run
hbase hbck -fixAssignment
m=1, t=60
Severe
Yes
Yes
The number of dead RegionServers exceeds the threshold continuously
The number of dead RegionServers has been greater than or equal to m for t (300 ≤ t ≤ 2,592,000) seconds continuously
Manually troubleshoot the issue
m=1, t=300
Moderate
Yes
Yes
The average number of regions in each RegionServer in the cluster exceeds the threshold continuously
The average number of regions in each RegionServer in the cluster has been greater than or equal to m for t (300 ≤ t ≤ 2,592,000) seconds continuously
Expand the node capacity or upgrade the node
m=300, t=1,800
Moderate
Yes
Yes
A full GC event occurred on HMaster
A full GC event occurred on HMaster
Fine-tune the parameter settings
m=5, t=300
Moderate
Yes
Yes
The HMaster JVM memory utilization exceeds the threshold continuously
The HMaster JVM memory utilization has been greater than or equal to m for t (300 ≤ t ≤ 2,592,000) seconds continuously
Adjust the HMaster heap memory size
m=85, t=1800
Severe
Yes
Yes
The number of current HMaster connections exceeds the threshold continuously
The number of current HMaster connections has been greater than or equal to m for t (300 ≤ t ≤ 2,592,000) seconds continuously
Manually troubleshoot the issue
m=1000, t=1800
Moderate
Yes
No
A full GC event occurred in RegionServer
A full GC event occurred in RegionServer
Fine-tune the parameter settings
m=5, t=300
Severe
Yes
No
The RegionServer JVM memory utilization exceeds the threshold continuously
The RegionServer JVM memory utilization has been greater than or equal to m for t (300 ≤ t ≤ 2,592,000) seconds continuously
Adjust the RegionServer heap memory size
m=85, t=1800
Moderate
Yes
No
The number of current RPC connections to RegionServer exceeds the threshold continuously
The number of current RPC connections to RegionServer has been greater than or equal to m for t (300 ≤ t ≤ 2,592,000) seconds continuously
Manually troubleshoot the issue
m=1000, t=1800
Moderate
Yes
No
The number of RegionServer StoreFiles exceeds the threshold continuously
The number of RegionServer StoreFiles has been greater than or equal to m for t (300 ≤ t ≤ 2,592,000) seconds continuously
Run the major compaction
m=50,000, t=1,800
Moderate
Yes
No
Both HMaster of HBase in Standby service status
Both HMaster roles are in Standby status at the same time.
Manually troubleshoot the issue.
-
Severe
Yes
Yes
HMaster
primary/secondary switch
The HMaster has occurred the primary/secondary switch.
Troubleshooting via HMaster service logs.
-
Severe
Yes
Yes
Insufficient HBase resource group nodes
The HBase resource group has insufficient nodes (less than or equal to 1).
Manually troubleshoot the issue.
-
Moderate
Yes
Yes
Hive
A full GC event occurred in HiveServer2
A full GC event occurred in HiveServer2
Fine-tune the parameter settings
m=5, t=300
Severe
Yes
Yes
The HiveServer2 JVM memory utilization exceeds the threshold continuously
The HiveServer2 JVM memory utilization has been greater than or equal to m for t (300 ≤ t ≤ 2,592,000) seconds continuously
Adjust the HiveServer2 heap memory size
m=85, t=1,800
Severe
Yes
Yes
A full GC event occurred in HiveMetaStore
A full GC event occurred in HiveMetaStore
Fine-tune the parameter settings
m=5, t=300
Moderate
Yes
Yes
A full GC event occurred in HiveWebHcat
A full GC event occurred in HiveWebHcat
Fine-tune the parameter settings
m=5, t=300
Moderate
Yes
Yes
HIVE SQL compilation time exceeds the threshold
The HIVE SQL compilation time exceeds the threshold.
Manually troubleshoot the issue.
t=60
Moderate
Yes
No
Hive table bucket version mismatch
The bucket versions in Hive tables are inconsistent.
Adjust the parameter hive.exec.bucketing.version for the corresponding table.
-
Moderate
Yes
No
Hive full table scan on the partitioned tables
Perform full table scans on the partitioned tables.
Check the scan conditions.
-
Moderate
Yes
No
Hive select *
Use select * to query data.
Add limit conditions.
-
Moderate
Yes
No
ZooKeeper
The number of ZooKeeper connections exceeds the threshold continuously
The number of ZooKeeper connections has been greater than or equal to m for t (300 ≤ t ≤ 2,592,000) seconds continuously
Manually troubleshoot the issue
m=65,535, t=1,800
Moderate
Yes
No
The number of ZNodes exceeds the threshold continuously
The number of ZNodes has been greater than or equal to m for t (300 ≤ t ≤ 2,592,000) seconds continuously
Manually troubleshoot the issue
m=2,000, t=1,800
Moderate
Yes
No
ZooKeeper leader switch
The ZooKeeper leader switch has occurred.
Troubleshooting via ZooKeeper service logs.
-
Severe
Yes
Yes
Data volume stored in ZooKeeper exceeds the threshold
The data volume stored in ZooKeeper is greater than or equal to the threshold (byte).
Manually troubleshoot the issue.
104857600Byte(100MB)
Moderate
Yes
No
Impala
The ImpalaCatalog JVM memory utilization exceeds the threshold continuously
The ImpalaCatalog JVM memory utilization has been greater than or equal to m for t (300 ≤ t ≤ 604,800) seconds continuously
Adjust the ImpalaCatalog heap memory size
m=0.85, t=1,800
Moderate
Yes
No
The Impala daemon JVM memory utilization exceeds the threshold continuously
The Impala daemon JVM memory utilization has been greater than or equal to m for t (300 ≤ t ≤ 604,800) seconds continuously
Adjust the Impala daemon heap memory size
m=0.85, t=1,800
Moderate
Yes
No
The number of Impala Beeswax API client connections exceeds the threshold
The number of Impala Beeswax API client connections has been greater than or equal to m
Adjust the value of
fe_service_threads
in the
impalad.flgs
configuration in the console
m=64, t=120
Severe
Yes
Yes
The number of Impala HiveServer2 client connections exceeds the threshold
The number of Impala HiveServer2 client connections has been greater than or equal to m
Adjust the value of
fe_service_threads
in the
impalad.flgs
configuration in the console
m=64, t=120
Severe
Yes
Yes
The query execution duration exceeds the threshold
The query execution duration exceeds m seconds
Manually troubleshoot the issue
-
Severe
Yes
No
The total number of failed queries exceeds the threshold
The total number of failed queries has been greater than or equal to m for t seconds (300 ≤ t ≤ 604,800)
Manually troubleshoot the issue
m=1, t=300
Severe
Yes
No
The total number of committed queries exceeds the threshold
The total number of committed queries has been greater than or equal to m for t seconds (300 ≤ t ≤ 604,800)
Manually troubleshoot the issue
m=1, t=300
Severe
Yes
No
The query execution failure rate exceeds the threshold
The query execution failure rate has been greater than or equal to m for t seconds (300 ≤ t ≤ 604,800)
Manually troubleshoot the issue
m=1, t=300
Severe
Yes
No
Total number of the Created status exceeds the threshold
The total number of the Created status exceeds the threshold.
Manually troubleshoot the issue.
m = 50, t = 300
Moderate
Yes
No
Duration of the Created status exceeds the threshold
The duration of the Created status exceeds the threshold.
Manually troubleshoot the issue.
t=1
Moderate
Yes
No
PrestoSQL
The current number of failed PrestoSQL nodes exceeds the threshold continuously
The current number of failed PrestoSQL nodes has been greater than or equal to m for t (300 ≤ t ≤ 604,800) seconds continuously
Manually troubleshoot the issue
m=1, t=1,800
Severe
Yes
Yes
The number of queuing resources in the current PrestoSQL resource group exceeds the threshold continuously
The number of queuing tasks in the PrestoSQL resource group has been greater than or equal to m for t (300 ≤ t ≤ 604,800) seconds continuously
Fine-tune the parameter settings
m=5,000, t=1,800
Severe
Yes
Yes
The number of failed PrestoSQL queries exceeds the threshold
The number of failed PrestoSQL queries is greater than or equal to m
Manually troubleshoot the issue
m=1, t=1,800
Severe
Yes
No
A full GC event occurred in a PrestoSQLCoordinator
A full GC event occurred in a PrestoSQLCoordinator
Fine-tune the parameter settings
-
Moderate
Yes
No
The PrestoSQLCoordinator JVM memory utilization exceeds the threshold continuously
The PrestoSQLCoordinator JVM memory utilization has been greater than or equal to m for t (300 ≤ t ≤ 604,800) seconds continuously
Adjust the PrestoSQLCoordinator heap memory size
m=0.85, t=1,800
Severe
Yes
Yes
A full GC event occurred on a PrestoSQL worker
A full GC event occurred on a PrestoSQL worker
Fine-tune the parameter settings
-
Moderate
Yes
No
The PrestoSQLWorker JVM memory utilization exceeds the threshold continuously
The PrestoSQLWorker JVM memory utilization has been greater than or equal to m for t (300 ≤ t ≤ 604,800) seconds continuously
Adjust the PrestoSQLWorker heap memory size
m=0.85, t=1,800
Severe
Yes
No
Consumed CPU time or cumulative memory of the Presto queries exceeds the specified threshold
The consumed CPU time or cumulative memory of the queries exceeds the specified threshold.
Manually troubleshoot the issue.
m = 60, t = 1
Moderate
Yes
No
Alarm: presto execution duration
The consumed CPU time or cumulative memory of the queries exceeds the specified threshold.
Manually troubleshoot the issue.
t=1800
Moderate
Yes
No
Presto
The current number of failed Presto nodes exceeds the threshold continuously
The current number of failed Presto nodes has been greater than or equal to m for t (300 ≤ t ≤ 604,800) seconds continuously
Manually troubleshoot the issue
m=1, t=1,800
Severe
Yes
Yes
The number of queuing resources in the current Presto resource group exceeds the threshold continuously
The number of queuing tasks in the Presto resource group has been greater than or equal to m for t (300 ≤ t ≤ 604,800) seconds continuously
Fine-tune the parameter settings
m=5,000, t=1,800
Severe
Yes
Yes
The number of failed Presto queries exceeds the threshold
The number of failed Presto queries is greater than or equal to m
Manually troubleshoot the issue
m=1, t=1,800
Severe
Yes
No
A full GC event occurred on a PrestoSQL coordinator
A full GC event occurred on a PrestoSQL coordinator
Fine-tune the parameter settings
-
Moderate
Yes
No
The Presto coordinator JVM memory utilization exceeds the threshold continuously
The Presto coordinator JVM memory utilization has been greater than or equal to m for t (300 ≤ t ≤ 604,800) seconds continuously
Adjust the Presto coordinator heap memory size
m=0.85, t=1,800
Moderate
Yes
Yes
A full GC event occurred on a Presto worker
A full GC event occurred on a Presto worker
Fine-tune the parameter settings
-
Moderate
Yes
No
The Presto worker JVM memory utilization exceeds the threshold continuously
The Presto worker JVM memory utilization has been greater than or equal to m for t (300 ≤ t ≤ 604,800) seconds continuously
Adjust the Presto worker heap memory size
m=0.85, t=1,800
Severe
Yes
No
Alarm: Presto execution duration exceeds the threshold
The execution duration exceeds the threshold (seconds).
Manually troubleshoot the issue.
t=1800
Moderate
Yes
No
Trino
Metrics of the Trino query tasks exceed the specified threshold
The corresponding dimensional metrics of the Trino query tasks exceed the specified threshold.
Adjust cluster resource configurations or check and modify queries.
m1=9999999
or
m2=9999999999
or m3=9999999999999
or m4=9999999999999
Severe
Yes
No
Consumed CPU time or cumulative memory of the Trino queries exceeds the specified threshold
The consumed CPU time or cumulative memory exceeds the specified threshold.
Manual troubleshooting of Spark task execution failed
t=1800
Moderate
Yes
No
Alarm: Trino execution duration
The execution duration exceeds the threshold (seconds).
Manually troubleshoot the issue.
t=1800
Moderate
Yes
No
Trino full table scan on the partitioned tables
Perform full table scans on the partitioned tables.
Check the scan conditions.
-
Moderate
Yes
Yes
Alarm: Trino execution duration exceeds the threshold
The execution duration exceeds the threshold (seconds).
Manually troubleshoot the issue.
t=1800
Moderate
Yes
No
Alluxio
The current total number of Alluxio workers is below the threshold continuously
The current total number of Alluxio workers has been smaller than or equal to m for t (300 ≤ t ≤ 604,800) seconds continuously
Manually troubleshoot the issue
m=1, t=1,800
Severe
Yes
No
Resource utilization on the Alluxio worker tier exceeds the threshold continuously
The utilization of the capacity on all tiers of the current Alluxio worker has been greater than or equal to the threshold for t (300 ≤ t ≤ 604,800) seconds continuously
Fine-tune the parameter settings
m=0.85, t=1,800
Severe
Yes
No
A full GC event occurred on an Alluxio master
A full GC event occurred on an Alluxio master
Manually troubleshoot the issue
-
Moderate
Yes
No
The Alluxio master JVM memory utilization exceeds the threshold continuously
The Alluxio master JVM memory utilization has been greater than or equal to m for t (300 ≤ t ≤ 604,800) seconds continuously
Adjust the Alluxio worker heap memory size
m=0.85, t=1,800
Severe
Yes
Yes
A full GC event occurred on an Alluxio worker
A full GC event occurred on an Alluxio worker
Manually troubleshoot the issue
-
Moderate
Yes
No
The Alluxio worker JVM memory utilization exceeds the threshold continuously
The Alluxio worker JVM memory utilization has been greater than or equal to m for t (300 ≤ t ≤ 604,800) seconds continuously
Adjust the Alluxio master heap memory size
m=0.85, t=1,800
Severe
Yes
Yes
Kudu
The cluster replica skew exceeds the threshold
The cluster replica skew has been greater than or equal to the threshold for t (300 ≤ t ≤ 3,600) seconds continuously
Run the
rebalance
command to balance the replicas
m=100, t=300
Moderate
Yes
Yes
The hybrid clock error exceeds the threshold
The hybrid clock error has been greater than or equal to the threshold for t (300 ≤ t ≤ 3,600) seconds continuously
Make sure that the NTP daemon is running and the network communication with the NTP server is normal
m=5,000,000, t=300
Moderate
Yes
Yes
The number of running tablets exceeds the threshold
The number of running tablets has been greater than or equal to m for t (300 ≤ t ≤ 3,600) seconds continuously
Too many tablets on a node can affect the performance. We recommend you clear unnecessary tables and partitions or expand the capacity as needed.
m=1,000, t=300
Moderate
Yes
Yes
The number of failed tablets exceeds the threshold
The number of failed tablets has been greater than or equal to m for t (300 ≤ t ≤ 3,600) seconds continuously
Check whether any disk is unavailable or data file is corrupted
m=1, t=300
Moderate
Yes
Yes
The number of failed data directories exceeds the threshold
The number of failed data directories has been greater than or equal to m for t (300 ≤ t ≤ 3,600) seconds continuously
Check whether the path configured in the
fs_data_dirs
parameter is available
m=1, t=300
Severe
Yes
Yes
The number of full data directories exceeds the threshold
The number of full data directories has been greater than or equal to m for t (120 ≤ t ≤ 3,600) seconds continuously
Clear unnecessary data files or expand the capacity as needed
m=1, t=120
Severe
Yes
Yes
The number of write requests rejected due to queue overloading exceeds the threshold
The number of write requests rejected due to queue overloading has been greater than or equal to m for t (300 ≤ t ≤ 3,600) seconds continuously
Check whether the number of write hotspots or worker threads is small
m=10, t=300
Moderate
Yes
No
The number of expired scanners exceeds the threshold
The number of expired scanners has been greater than or equal to m for t (300 ≤ t ≤ 3,600) seconds continuously
Be sure to call the method for closing a scanner after reading data
m=100, t=300
Moderate
Yes
Yes
The number of error logs exceeds the threshold
The number of error logs has been greater than or equal to m for t (300 ≤ t ≤ 3,600) seconds continuously
Manually troubleshoot the issue
m=10, t=300
Moderate
Yes
Yes
The number of RPC requests that timed out while waiting in the queue exceeds the threshold
The number of RPC requests that timed out while waiting in the queue has been greater than or equal to m for t (300 ≤ t ≤ 3,600) seconds continuously
Check whether the system load is too high
m=100, t=300
Moderate
Yes
Yes
Spark
Spark task execution failed
The cluster has more than m failed Spark tasks.
Manually troubleshoot the issue.
m=0
Moderate
Yes
No
SparkSQL full table scan on the partitioned tables
Perform full table scans on the partitioned tables.
Check the scan conditions.
-
Moderate
Yes
No
Multiple Spark Apps concurrently insert into the same table
Spark Apps that write to the same table at intersecting times
Set mapreduce.fileoutputcommitter.cleanup.skipped and mapreduce.fileoutputcommitter.task.cleanup.enabled to true
-
Low
Yes
Yes
Kerberos
Kerberos response time exceeds the threshold continuously
The Kerberos response time has been greater than or equal to m (ms) for t (300 ≤ t ≤ 604,800) seconds continuously
Manually troubleshoot the issue
m=100, t=1,800
Severe
Yes
Yes
StarRocks
Alarm: StarRocks execution duration exceeds the threshold
The execution duration exceeds the threshold (seconds).
Manually troubleshoot the issue.
m=180
Moderate
Yes
No
StarRocks full table scan on the partitioned tables
Perform full table scans on the partitioned tables.
Check the scan conditions.
-
Moderate
Yes
No
UNIFFLE
ShuffleServer application writes to TopN
metric source shuffle server /metrics topN_of_total_data_size_for_app
Terminate the App or scale out disk capacity
Average Disk usage exceeding 50% within 3 minutes
Low
Yes
No
Cluster
Auto scaling policy execution failed
1. The cluster is not in a scalable status.
2. The account balance is insufficient. The scale-out rule fails to execute.
3. The preset scale-out resource specifications are sold out.Scale-out cannot be triggered.
4. The delivery of elastic scale-out resources fails.
5. The remaining resource quota of the current account is insufficient. The scale-out rule fails to execute.
6. The disk space for elastic scale-out resources is insufficient.
7. The cluster scale-in process is mutually exclusive for identical nodes. Some Task nodes (%s) specified by the auto scaling are already in the scale-in process.
8. There are conflicts in the cluster process.
9. The subnet bound to the cluster has insufficient elastic IP addresses, resulting in a scale-out rule failure.
10. The current setting for expiration retry time is too short. The rule is not triggered for scaling within the expiration retry time.
11. An internal error has occurred.
1. It is recommended to try again later or Submit a Ticket to contact internal R&D personnel.
2. Top up the account to ensure a sufficient balance.
3. It is recommended to switch to the specifications with sufficient resources.
4. It is recommended to try again later or Submit a Ticket to contact internal R&D personnel.
5. It is recommended to adjust the resource quota or switch to a model with a sufficient quota.
6. It is recommended to switch to a disk type with sufficient resource specifications or Submit a Ticket to contact internal R&D personnel.
7. -
8. Try again later.
9. It is recommended to switch to another subnet within the same VPC.
10. It is recommended to extend the expiration retry time.
11. It is recommended to Submit a Ticket to contact internal R&D personnel.
-
Severe
No
Yes
Auto scaling policy not triggered
1. No scale-out resource specifications are configured. The scale-out rule cannot be triggered.
2. Elastic resources have reached the maximum node limit. Scale-out cannot be triggered.
3. Elastic resources have reached the minimum node limit. Scale-in cannot be triggered.
4. No elastic resources are available in the cluster.The scale-in rule cannot be triggered.
5. No eligible elastic resources (excluding scheduled termination resources) are available in the cluster.The scale-in rule cannot be triggered.
6. The execution time range for time-based scaling has expired.
7. The cluster is in the cooldown period.Scaling operations are temporarily unavailable.
1. Add configurations for scaling specifications. At least 1 elastic resource specification should be set.
2. It is recommended to adjust the maximum node limit.
3. It is recommended to adjust the minimum node limit.
4. It is recommended to supplement elastic resources before executing the scale-in rule.
5. It is recommended to supplement elastic resources before executing the scale-in rule.
6. If you want to continue using this rule for auto scaling, modify the effective time range of the rule.
7. It is recommended to adjust the cooldown duration of the scaling rules.
-
Moderate
Yes
Yes
Auto scaling partially successful
1. Elastic scale-out resources have reached the maximum node limit. The scale-out rule is executed partially successfully.
2. The inventory of the preset scale-out resource specifications is insufficient.Only partial resources are supplemented.
3. The actual delivery quantity is less than the target scale-out quantity.Only partial resources are supplemented.
4. The model quota is insufficient. Only partial resources are supplemented.
5. The disk space for elastic scale-out resources is insufficient.
6. There are conflicts in the cluster process.
7. The subnet bound to the cluster has insufficient elastic IP addresses, resulting in a resource supplement failure.
8. The account balance is insufficient. The resource supplement fails.
9. An internal error has occurred.
1. If further scale-out is required, it is recommended to adjust the maximum node limit.
2. It is recommended to manually scale out resources with sufficient inventory to supplement the lack of required resources.
3. It is recommended to manually scale out resources with sufficient inventory to supplement the lack of required resources.
4. It is recommended to adjust the resource quota or switch to a model with a sufficient quota.
5. It is recommended to switch to a disk type with sufficient resource specifications or submit a ticket to contact internal R&D personnel.
6. Try again later.
7. It is recommended to switch to another subnet within the same VPC.
8. It is recommended to top up the account to ensure a sufficient balance.
9. It is recommended to Submit a Ticket to contact internal R&D personnel.
-
Moderate
Yes
Yes
JVM old generation memory exception
An exception has occurred in the old generation memory.
Manually troubleshoot the issue.
1. The old generation memory utilization reaches 80% for 5 consecutive minutes; or
2. The JVM memory utilization reaches 90%.
Severe
Yes
Yes
Service role health status timeout
The service role health status has timed out for t (180 ≤ t ≤ 604,800) seconds continuously.
The service role health status has timed out for consecutive minutes.
Handling method: View the corresponding service role logs and address the issue based on the logs.
t=300
Moderate
Yes
No
Service role health status exception
An exception has occurred affecting the service role health status for t seconds (180 ≤ t ≤ 604,800) continuously.
The service role health status has been unavailable for consecutive minutes.
Handling method: View the corresponding service role logs and address the issue based on the logs.
t=300
Severe
Yes
Yes
Node role process restart
The node role process has restarted.
Manually troubleshoot the issue.
-
Moderate
No
Yes
Bootstrap script execution failed
The Bootstrap script fails to execute.
Manually troubleshoot the issue.
-
Moderate
No
Yes
Process killed by OOMKiller
The process was killed by OOMKiller.
1. Check the system resource usage with the top or htop command to view CPU, memory, and disk usage. Confirm whether the memory leak or resource contention issues occur.
2. Analyze Java heap memory usage and adjust JVM parameters.
3. Increase the node memory.
-
Severe
Yes
Yes
Configuration file exception
An exception has occurred in the configuration file.