Viewing Database Proxy Monitoring Data
Unduh
Mode fokus
Ukuran font
This document describes how to view database proxy node monitoring through the TDSQL-C for MySQL console.
Prerequisites
Database Proxy Node Monitoring Metrics
Note:
When you obtain monitoring data through calling APIs, the monitoring metric names used in the call parameter items should follow the Callable Metric Name column in the table below.
To monitor the SQL full-link average latency, DB execution average latency, and Proxy internal average latency metrics, the database proxy kernel version (stable edition) must be greater than or equal to 1.3.22.
Monitoring Metric Name | Callable Metric Name | Unit |
Current Connections | ProxyCurrentConnections | pcs |
Requests | ProxyQueries | counts/sec |
Read Requests | ProxyRouteSlave | counts/sec |
Write Requests | ProxyRouteMaster | counts/sec |
CPU Utilization | ProxyCpuUseRate | % |
Memory Utilization | ProxyMemoryUseRate | % |
Memory Usage | ProxyMemoryUsage | MB |
Proxy-to-Client Traffic per Second | ProxyBytesSent | MB/s |
Client-to-Proxy Traffic per Second | ProxyBytesReceived | MB/s |
SQL Full Link Avg Duration | ProxySQLFullRT | μs |
DB Execution Avg Duration | ProxyDbRT | μs |
Proxy Internal Average Time Consumption | ProxyInternalRT | μs |
Operation Steps
1. Log in to the TDSQL-C for MySQL console, select a cluster with the proxy enabled in the cluster list, and click the cluster ID to go to the cluster management page.
2. In the topology diagram under Cluster Management > Cluster Details, hover the mouse pointer over the database proxy section and click Details to enter the database proxy management page. Alternatively, you can directly select the Database Proxy tab on the cluster management page to enter the database proxy management page.
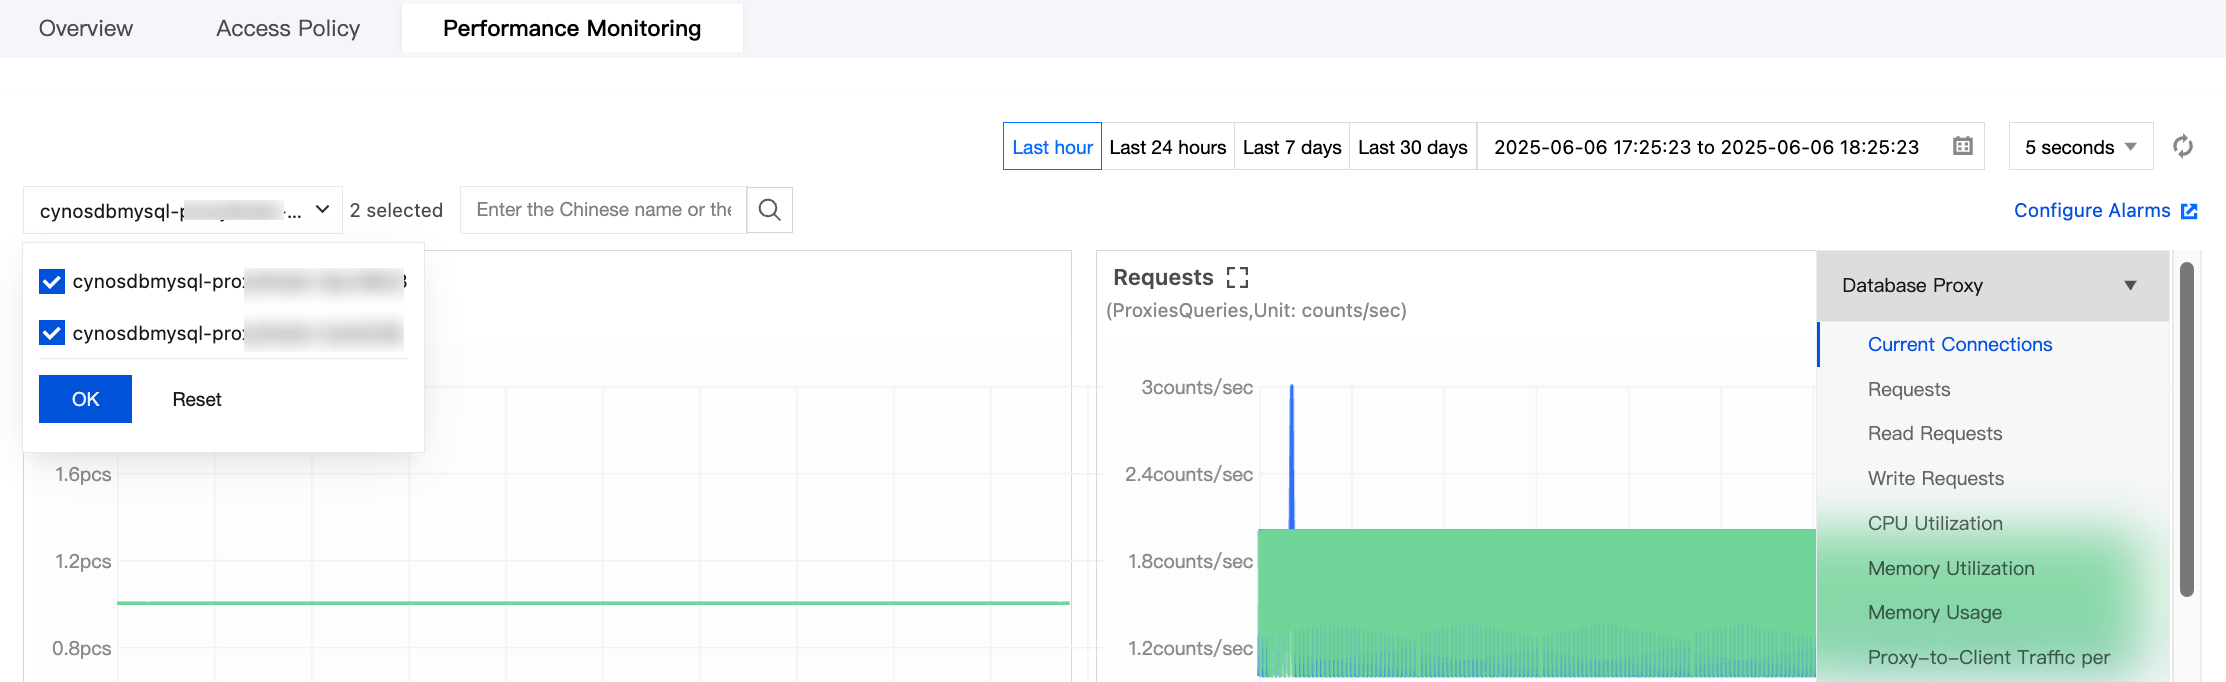
3. On the Database Proxy page, select Performance Monitoring, and click the node name to view the monitoring of each proxy node.
Bantuan dan Dukungan
Apakah halaman ini membantu?
Anda juga dapat Menghubungi Penjualan atau Mengirimkan Tiket untuk meminta bantuan.
masukan