Cloud Log Service (CLS) supports pay-as-you-go (postpaid), and you can choose it based on your business needs.
Note:
If you want to know how much it will cost for an expected resource usage, you can use the Price Calculator to estimate costs and export the estimation list.
Billing Mode
Billing Mode
Log writing traffic (basic service)
Pay-as-you-go (postpaid)
Default billing mode, which is supported in all available regions. Users are charged based on their actual storage usage, requests, traffic, and other billable items on a daily basis.
Billing Details
Category
Log writing traffic (basic service)
Billing cycle
Daily. The fees generated for the current day will be settled at 00:00 on the next day.
CLS has the following billable items. The index traffic, log storage, and index storage fees are subject to the log storage class. For more information, see Storage Class Overview.
CLS Billale items
Billable items in Uploading logs, Search logs(enable indexes are needed), download, ship, consume logs in CLS are as shown below:
Traffic
fees
Log writing traffic (basic service)
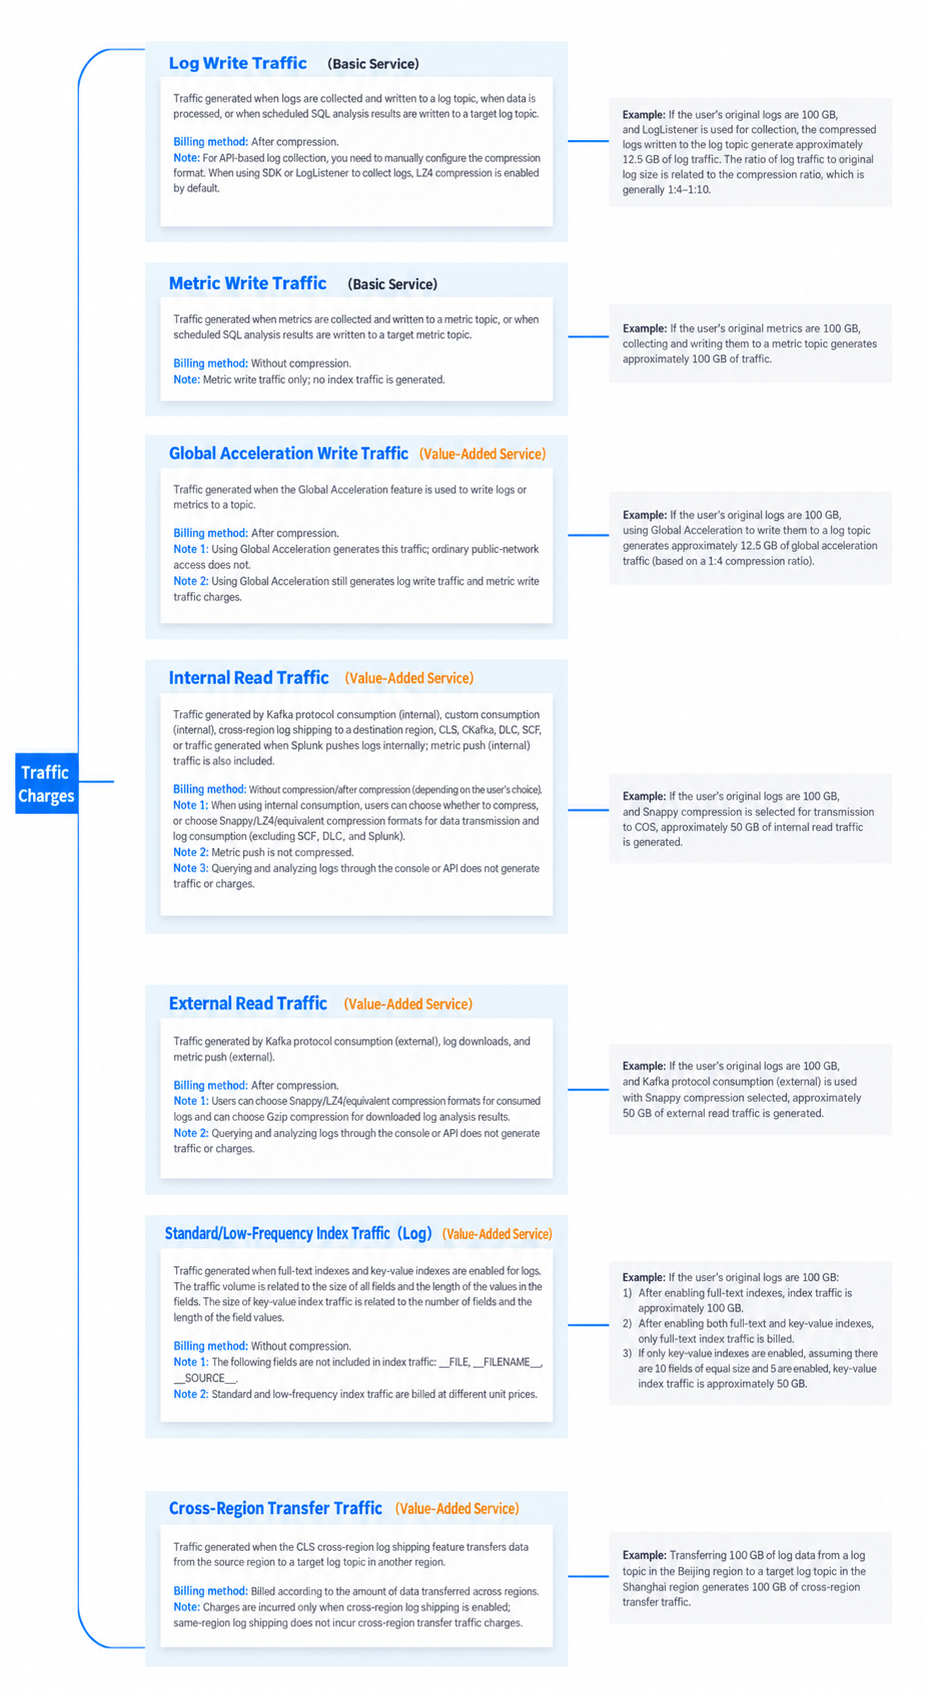
Traffic generated when logs are written into log topics during log collection in data processing and scheduled SQL analysis tasks.
Measurement method: compressed.
Note: When users collect logs by calling APIs, they need to manually configure the compression format. When SDK and LogListener are used to collect logs, the LZ4 compression format is enabled by default.
Example: A user's raw logs of a 100GB size are collected using LogListener, compressed, and written into log topics, generating approximately 12.5GB of write traffic. The write traffic volume depends on the log compression ratio, which is generally from 1:4 to 1:10.
Example: A user generates 100GB of raw logs per day and uses Loglistener for collection. Logs are retained for 7 days. After compression, approximately 12.5GB of log storage volume is produced per day. From the 8th day onwards, the daily log storage volume is stable at 87.5GB (12.5GB x 7 days).
Traffic generated when logs are written into metric topics during metric data collection in scheduled SQL analysis tasks.
The raw logs are 100 GB. After being collected by Loglistener, the logs are compressed and written to a log topic, generating approximately 12.5 GB of write traffic. The write traffic volume depends on the log compression ratio, which is generally 1:4 - 1:10.
Note: Metric data writes only generate write traffic and do not generate index traffic.
Example: A user's raw metric data of a size of 100GB is collected and written into metric topics, generating approximately 100GB of write traffic.
Example: A user's raw logs of a size of 100GB undergo data processing, generating 100GB of data processing volume.
Traffic generated when logs are written into log topics by using the global acceleration feature.
The raw metrics are 100 GB. After the raw metrics are collected and written to a metric topic, approximately 100 GB of write traffic is generated.
Note 1: Such traffic is generated only if the global acceleration feature is enabled. Common public network access does not generate such traffic.
Note 2: When the global acceleration feature is enabled, log writing traffic is not repeatedly generated.
Example: A user generates 100GB of raw logs per day and uses Loglistener for collection. Logs are retained for 7 days. After compression, approximately 12.5GB of log storage volume is produced per day. From the 8th day onwards, the daily log storage volume is stable at 87.5GB (12.5GB x 7 days).
Traffic generated when logs are consumed (private network consumption) by using the Kafka protocol, logs are shipped to Tencent Cloud COS within the same region, CKafka, as well as SCF, and metric data is shipped (private network).
The raw logs are 100 GB. After being compressed, the logs are written to a log topic through global acceleration, generating approximately 12.5 GB of global acceleration write traffic (the compression ratio is generally 1:4 - 1:10).
Cross-region transfer traffic (value-added service)
Metering method: metered based on the actual volume of data transferred across regions.
Note 1: This billable item is generated only for cross-region delivery. No cross-region transfer traffic fee is incurred when the source log topic and the destination log topic are in the same region.
Deliver 100 GB of log data from a log topic in the Hong Kong (China) region to the Singapore region, generating 100 GB of cross-region transfer traffic. The unit price for cross-region transfer traffic between Hong Kong (China) and regions outside the Chinese mainland is USD 0.1778/GB, and the cross-region transfer traffic fee for this transfer is 100 GB × USD 0.1778/GB = USD 17.78.
Note: Users can choose not to compress, ship, or consume logs in compression formats such as Snappy and LZ4 (except for shipment to SCF).
Definition: Traffic generated when logs are consumed (private network consumption) by using the Kafka protocol, logs are delivered to Tencent Cloud COS, CKafka, and SCF in the same region, and metric data is delivered (private network).
Public network read traffic (value-added service)
Traffic generated when logs are consumed (public network consumption) by using the Kafka protocol, logs are downloaded, and metric data is shipped (public network).
The raw logs are 100 GB. If you select the Snappy compression format and deliver them to COS, approximately 50 GB of private network read traffic is generated.
Note: Users can choose not to compress or to consume logs in compression formats such as Snappy and LZ4. The downloaded retrieval and analysis results are in the Gzip compression format by default.
Example: A user's raw logs of a size of 100GB are consumed (public network consumption) by using the Kafka protocol in the Snappy compression format, generating approximately 50GB of public network read traffic.
STANDARD/STANDARD_IA index traffic (log) (value-added service)
Traffic generated when full-text and key-value index are enabled for logs. The size of full-text index traffic is related to the length of all fields and their values in user logs. The size of key-value index traffic is related to fields with indexing enabled and their values.
Measurement method: uncompressed.
The raw logs are 100 GB. If you consume them over the public network using the Kafka protocol and select the Snappy compression format, approximately 50 GB of public network read traffic is generated.
Note 2: The unit price of STANDARD/STANDARD_IA index traffic differs.
Example: A user's raw logs is of a size of 100GB.
Example: A user generates 100GB of raw logs per day with indexing enabled. Logs are retained for 7 days.
b. With both full-text and key-value index enabled, only the full-text index traffic is measured.
c. With only key-value index enabled, the size of index traffic is approximately 50GB based on the assumption that there are 10 fields of similar sizes, with 5 fields being indexed.
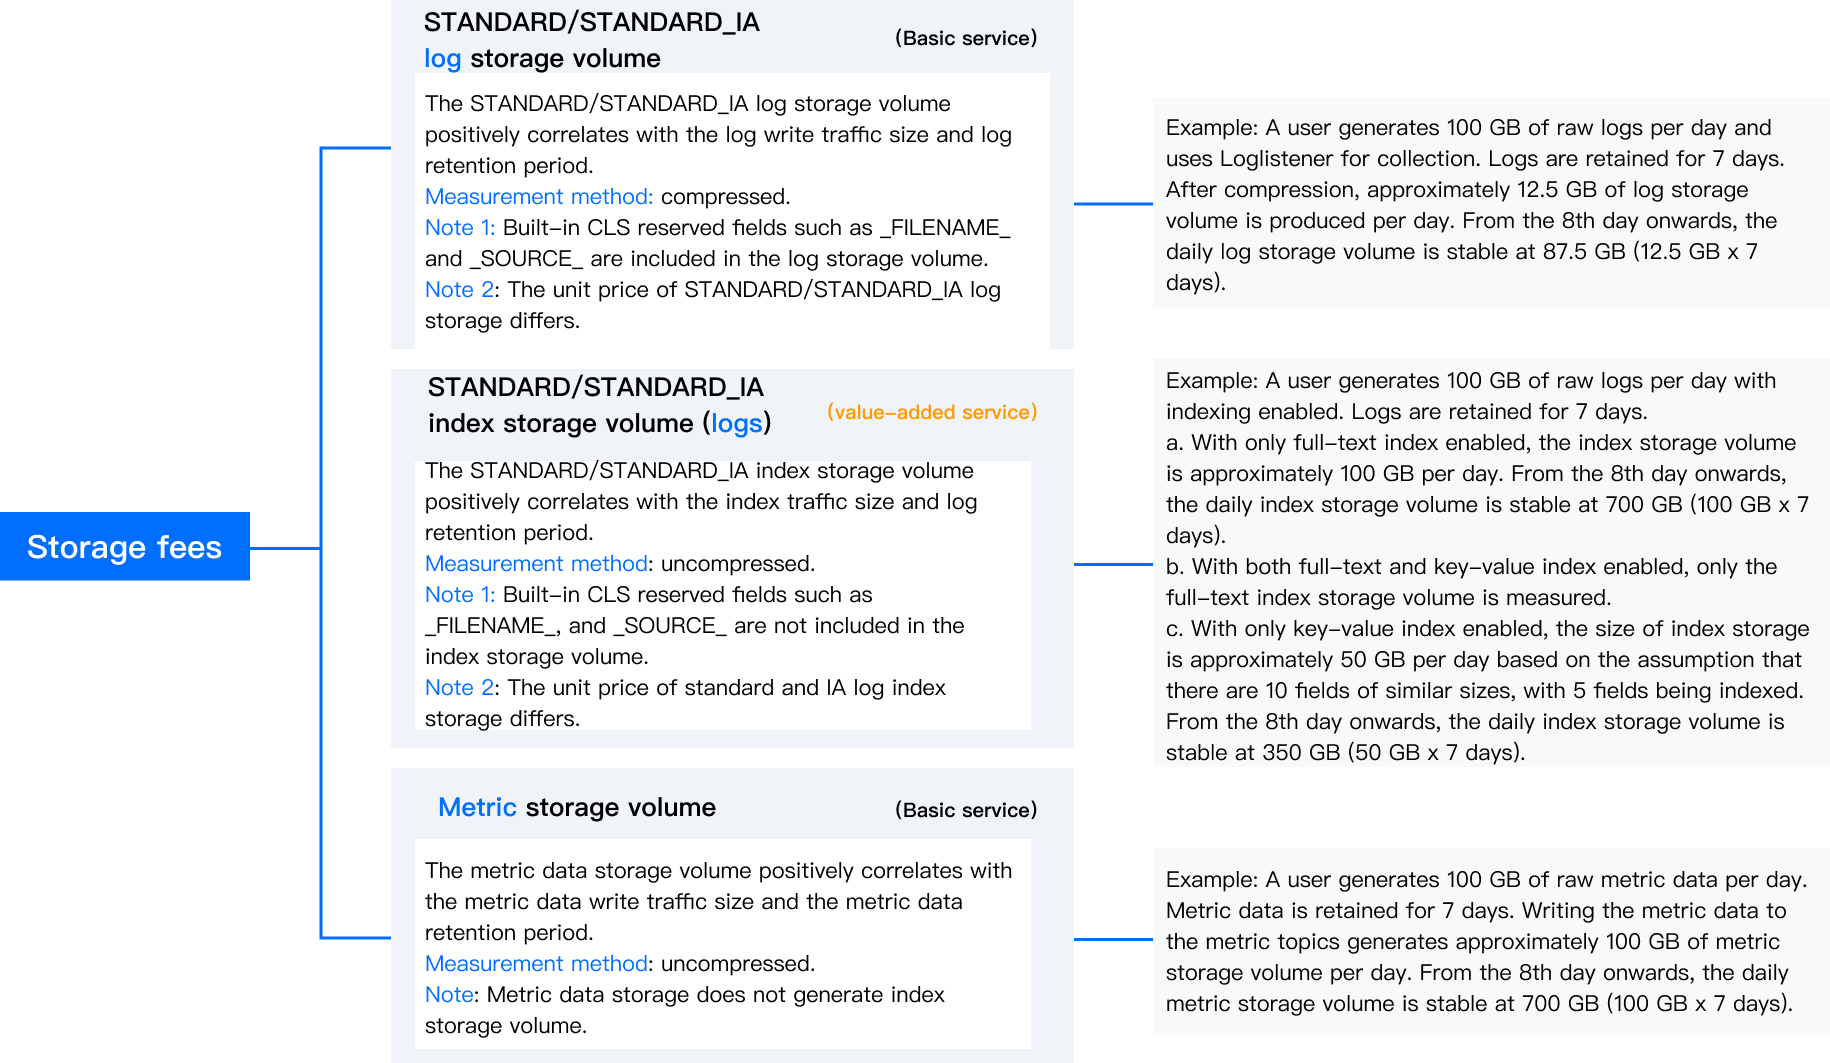
3. The STANDARD/STANDARD_IA log storage volume positively correlates with the log write traffic size and log retention period.
Measurement method: compressed.
Note 1: Built-in CLS reserved fields such as _FILENAME_ and _SOURCE_ are included in the log storage volume.
Note 2: The unit price of STANDARD/STANDARD_IA log storage differs.
Example: A user generates 100GB of raw logs per day and uses Loglistener for collection. Logs are retained for 7 days. After compression, approximately 12.5GB of log storage volume is produced per day. From the 8th day onwards, the daily log storage volume is stable at 87.5GB (12.5GB x 7 days).
STANDARD/STANDARD_IA index storage volume (logs) (value-added service)
The STANDARD/STANDARD_IA index storage volume positively correlates with the index traffic size and log retention period.
The user generates 100 GB of raw logs every day. The logs are collected by Loglistener and stored for 7 days. After being compressed, the logs are written to a log topic, generating approximately 12.5 GB of log storage every day. From the 8th day onwards, the daily log storage volume stabilizes at 12.5 GB*7 days = 87.5 GB.
Note 1: Built-in CLS reserved fields such as _FILENAME_, and _SOURCE_ are not included in the index storage volume.
Note 2: The unit price of standard and IA log index storage differs.
Example: A user generates 100GB of raw logs per day with indexing enabled. Logs are retained for 7 days.
a. With only full-text index enabled, the index storage volume is approximately 100GB per day. From the 8th day onwards, the daily index storage volume is stable at 700GB (100GB x 7 days).
b. With both full-text and key-value index enabled, only the full-text index storage volume is measured.
c. With only key-value index enabled, the size of index storage is approximately 50GB per day based on the assumption that there are 10 fields of similar sizes, with 5 fields being indexed. From the 8th day onwards, the daily index storage volume is stable at 350GB (50GB x 7 days).
1. Metric data storage volume (basic service)
2. The metric data storage volume positively correlates with the metric data write traffic size and the metric data retention period
3. If only key-value indexing is enabled, with 10 fields of similar size and 5 of them indexed, the index storage volume is approximately 50GB/day. From the 8th day onwards, the daily index storage volume is stable at 50GB*7 days=350GB.
Note: Metric data storage does not generate index storage volume.
Example: A user generates 100GB of raw metric data per day. Metric data is retained for 7 days. Writing the metric data to the metric topics generates approximately 100GB of metric storage volume per day. From the 8th day onwards, the daily metric storage volume is stable at 700GB (100GB x 7 days).
Example: A user generates 100GB of raw logs per day with indexing enabled. Logs are retained for 7 days.
fees
The user generates 100 GB of raw metrics every day, and the metrics are stored for 7 days. After the metrics are written to a metric topic, approximately 100 GB of metric storage is generated every day. From the 8th day onwards, the daily metric storage volume stabilizes at 100 GB*7 days = 700 GB.
The size of the data processing volume is equivalent to the write traffic to the source log topic (after decompression).
Measurement method: uncompressed.
Note: Built-in reserved fields in CLS such as _FILENAME_ and _SOURCE_ are not included in the data processing volume.
Example: A user's raw logs of a size of 100GB undergo data processing, generating 100GB of data processing volume.
Other
fees
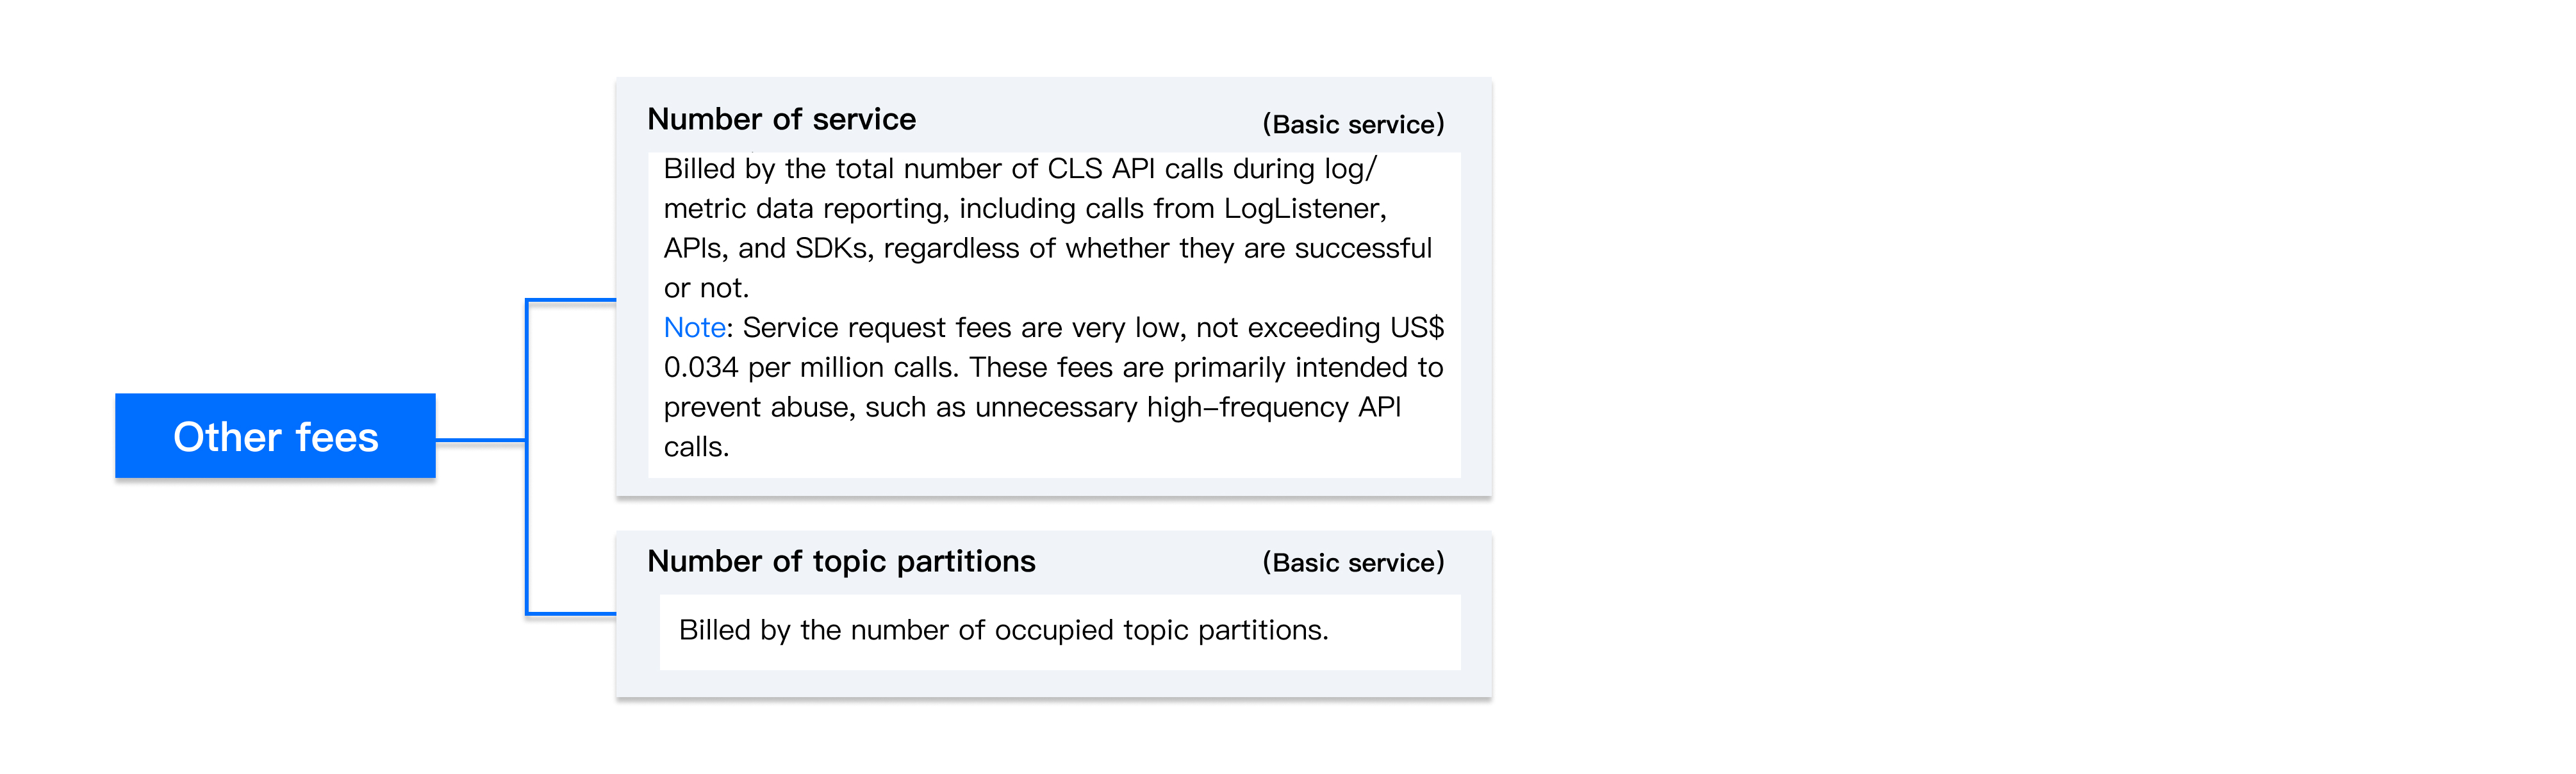
Number of service requests (basic service)
Billed by the total number of CLS API calls during log/metric data reporting, including calls from LogListener, APIs, and SDKs, regardless of whether they are successful or not.
Note: Service request fees are very low, not exceeding US$0.034 per million calls. These fees are primarily intended to prevent abuse, such as unnecessary high-frequency API calls.
Number of topic partitions (basic service)
Billed by the number of occupied topic partitions.
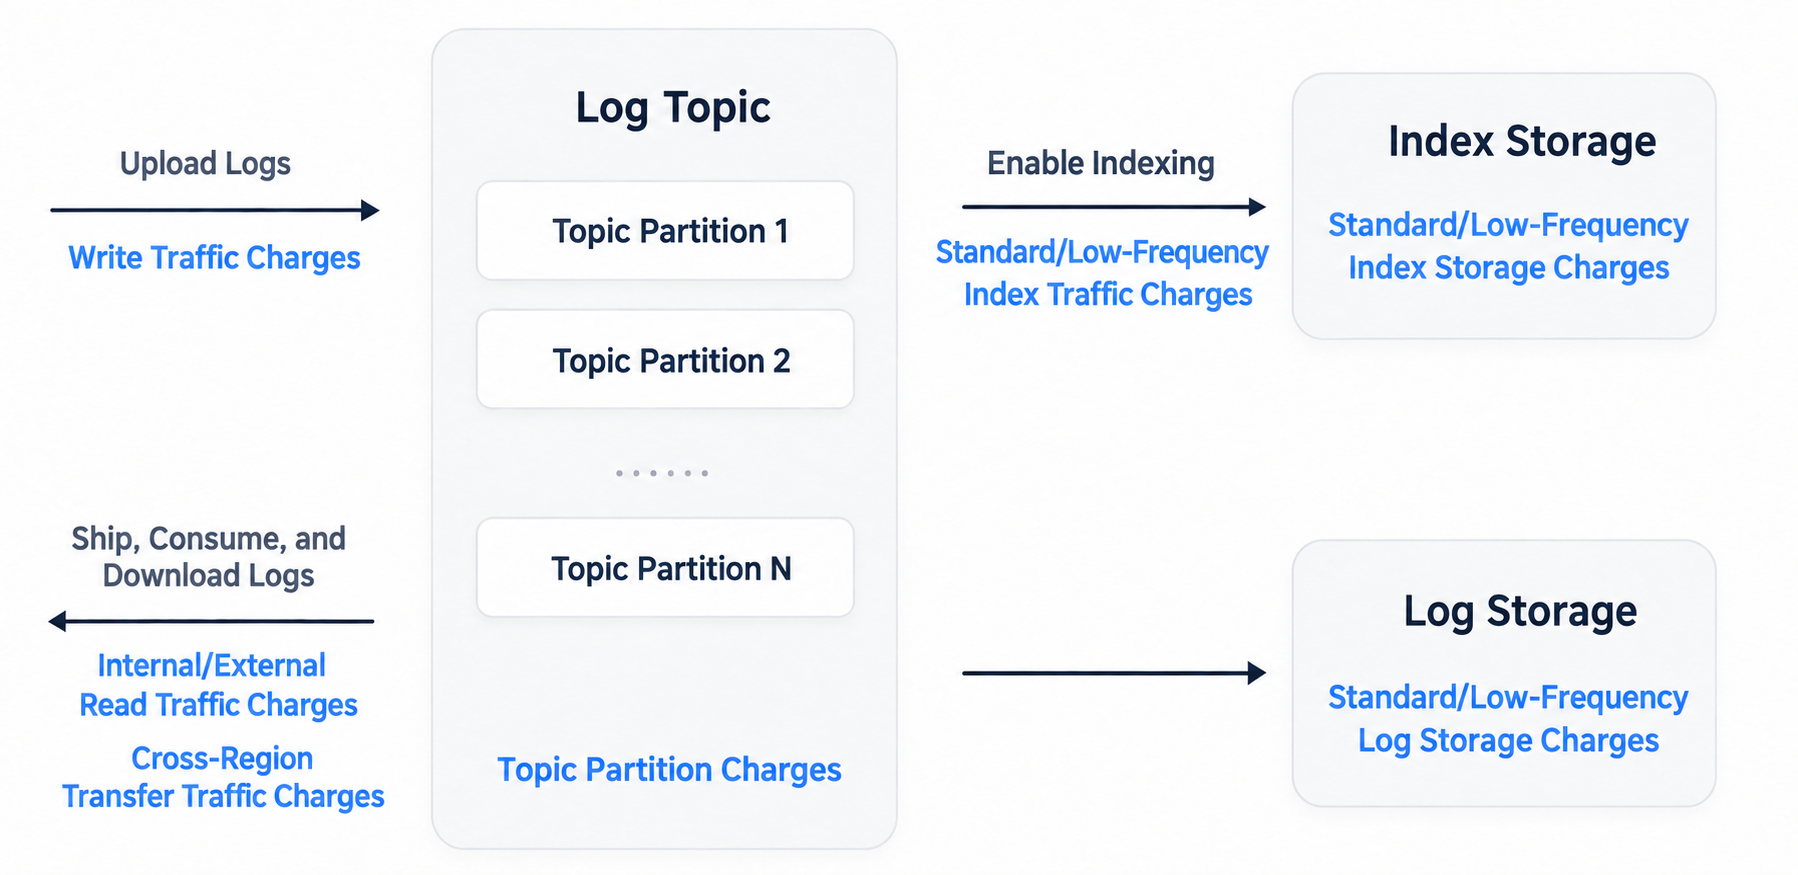
Overview Diagram
Here is a schematic diagram of the fees that may be incurred when using log topics:
Billed by the number of occupied topic partitions.
Use Cases and Costs of Log Topics - 1
Billable items in steps of data processing in CLS are as shown below: