Alarm
ダウンロード
フォーカスモード
フォントサイズ
The alarm module of Database Risk Monitor accurately identifies and closes the loop on violations by monitoring security events of database assets in real time. The system detects high-risk behaviors such as abnormal access, violations, and non-service account operations in real time based on built-in alarm policies, and supports alarm viewing, handling, allowlist management, and policy configuration. This document describes how to view, handle, and manage policies for alarms in the CSC console.
Operation Overview
Operation | Applicable Scenarios | |
| View security alarms triggered by current database assets and their handling status. | |
| Analyze the alarm trigger reasons, violation details, and associated assets. | |
Mark the status of false positive or unhandled alarms to eliminate interference in risk statistics. | ||
| Add the policy triggered by the behavior that requires long-term access to the allowlist. | |
| Update the status of alarms for which emergency response has been completed to close the handling loop. | |
Customize alarm rules based on business requirements, and configure trigger conditions and risk levels. | ||
| Enable or disable built-in alarm policies to control the scope of alarm generation. | |
| Adjust the threat level and content of the alarm policy. | |
View the list and details of currently added alarm allowlist policies. | ||
| Add alarm allowlist rules proactively to permanently allow specific behaviors. | |
| Modify the content of added alarm allowlist rules. | |
Viewing the Alarm List
View the security alarms triggered by your current database assets and their processing status.
1. Log in to the CSC console. In the left navigation pane, click Data Security Situation Management > Database Risk Monitor.
2. On the Database Risk Monitoring page, click the Alarm Tag.

3. On the Alarm Tag page, you can view the relevant alarm information for your current database assets. The alarm list displays the alarm name/type, alarm level, asset instance ID/name, database account, associated user/type, alarm detection time, and processing status.
Note:
The alarm export feature automatically converts the detection time in the alarm list to UTC+08:00 (East 8 Zone / Beijing Time). These two time representations correspond to the same event occurrence moment. They differ only in the time zone used for statistical display, while the original data remains consistent.
Viewing Alarm Details
View the alarm trigger reason, details of the violation, associated assets, and other information to analyze the alarm and determine a handling plan.
1. Log in to the CSC console. In the left navigation pane, click Data Security Situation Management > Database Risk Monitor.
2. On the Database Risk Monitoring page, click the Alarm Tag.
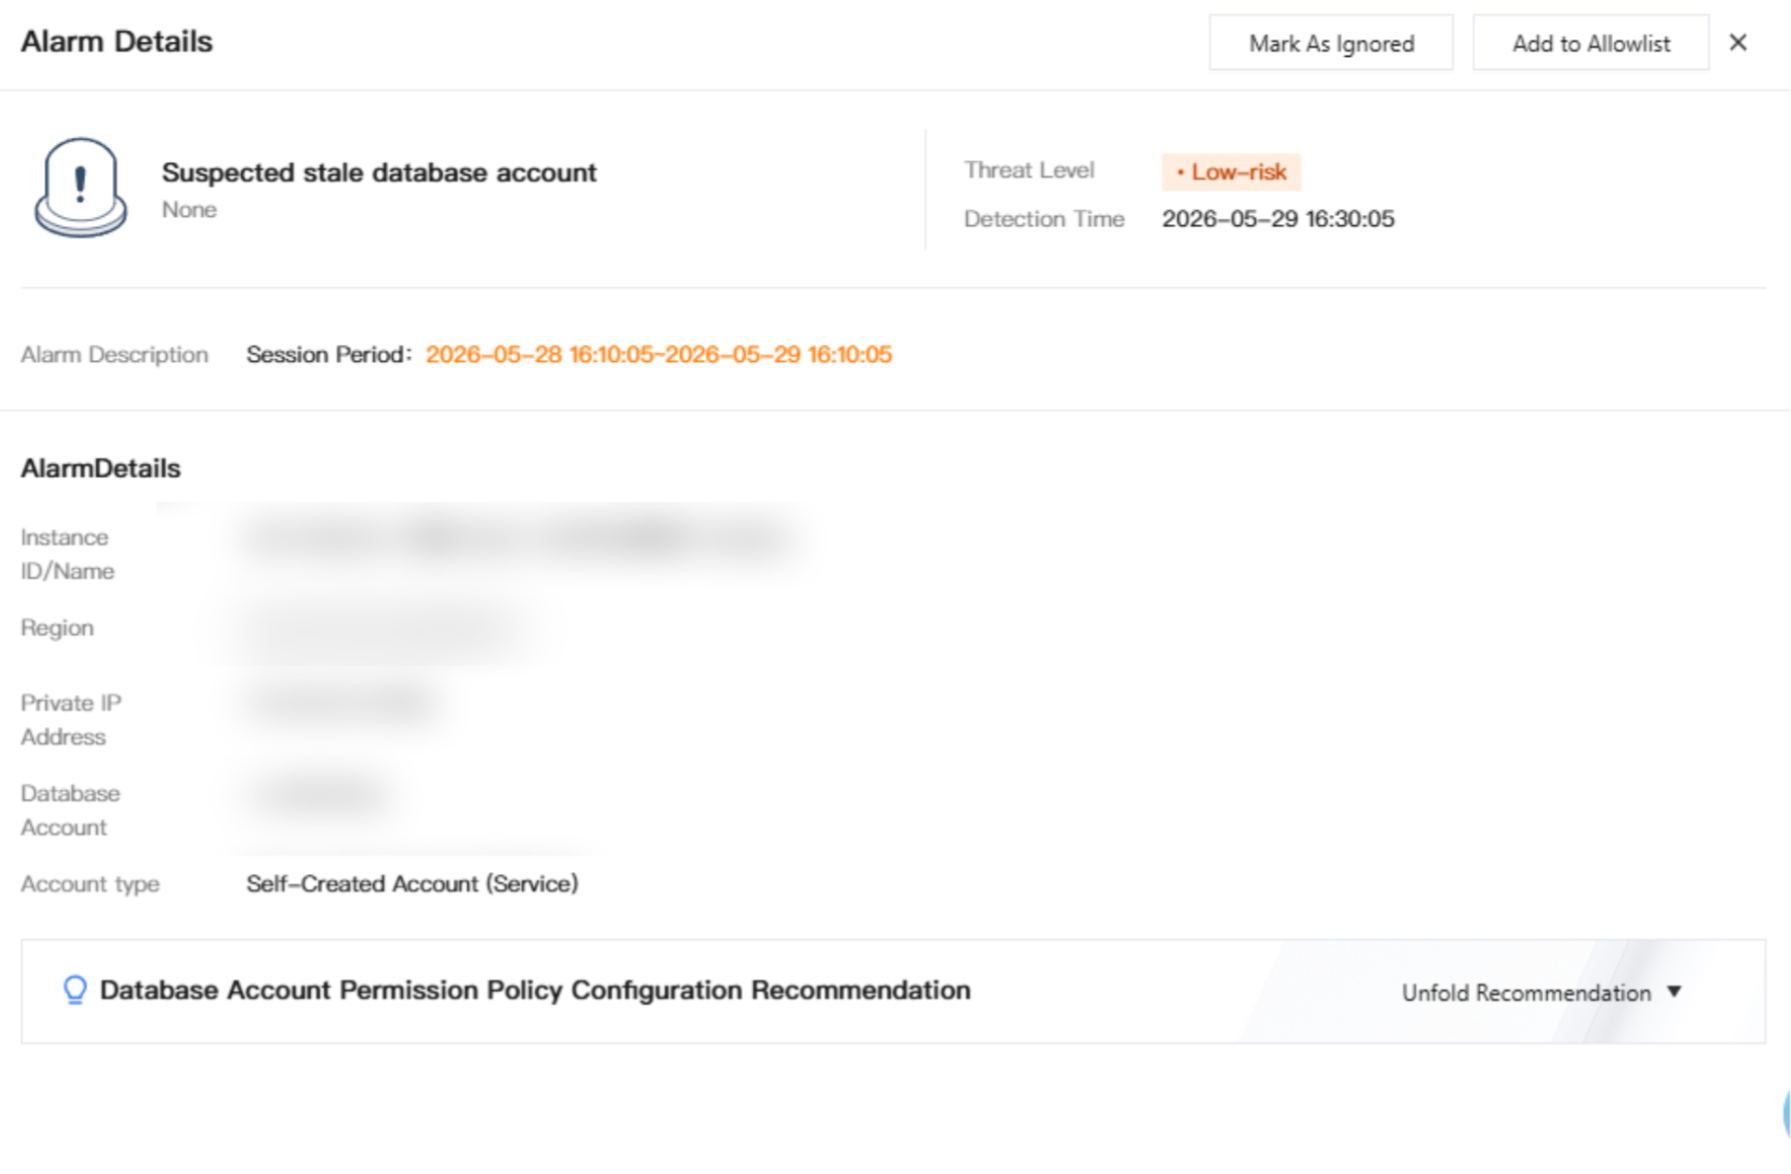
3. On the Alarm Tag page, click the target Alarm name to view information such as the alarm trigger reason, details of the violation (including the SQL statement and source IP address), and associated assets.
Alarm Handling
Marking As Ignored
Mark the status of false positive or non-actionable alarms to eliminate interference in risk statistics.
Note:
If an alarm's handling status is marked as Ignored, the corresponding risk will not be included in risk statistics.
1. On the Alarm Tag page, you can process target alarms individually or in batches:
Single Alarm Handling: In the target alarm's operation column, click Mark As Ignored.

Batch Handling: Select multiple target alarms, and click Mark As Ignored.

2. In the secondary confirmation dialog, click Confirm to mark the alarm as ignored.
Adding Allowlists
For behaviors that require long-term allowance, you can add the policy triggered by the alarm to the rule allowlist.
1. On the Alarm Tag page, in the target alarm's operation column, click Add to Allowlist.

2. In the Add to Allowlist window, review the allowlist policy content. After confirming it is correct, click Confirm to add the policy information triggered by this alarm to the allowlist.
Note:
After the allowlist policy rule takes effect, the corresponding behavior no longer triggers an alarm.
Marking as Handled
Update the status of alarms for which emergency response has been completed to achieve a closed-loop handling process.
1. On the Alarm Tag page, select one or multiple target alarms, and click Tag Disposal.

2. In the confirmation window, verify the alarm information. After confirming it is correct, click OK to mark the alarm as handled.
Note:
After an alarm's handling status is marked as Handled, the alarm will not be included in risk statistics.
Managing Alarm Policies
Adding an Alarm Policy
1. Log in to the CSC console. In the left navigation pane, click Data Security Situation Management > Database Risk Monitor.
2. On the Database Risk Monitoring page, click Policy Management in the upper-right corner.

3. In the Policy Management window, click the Alarm Policy Tag.
4. On the Alarm Policy Tag page, click Add Policy.
5. In the Add Alarm Policy window, configure the basic information:
Parameter | Description |
Policy Name | Name of the custom rule, used to identify the specific rule. The length is 1 to 64 characters and cannot be duplicated. |
Policy Remarks | Rule description information, not exceeding 100 characters. |
Risk Level | Risk level corresponding to the rule, including Info, Low, Medium, and High. If the rule is matched, you can view log information of the corresponding level on the Audit Risk page. |
Policy Switch | Controls whether the policy is enabled. It is enabled by default and takes effect immediately after creation. |
6. In the rule configuration area, configure specific alarm trigger conditions. The following rule types are supported:
Rule Type | Rule Description |
Client IP Address | You can configure multiple IP addresses and network segments. Enter an IP address or network segment and press Enter to add it, for example, 192.168.1.1,192.168.1.0/24. |
Client Port | Configure the port number. The default value is 0. |
Database IP Address | You can configure multiple IP addresses and network segments. Enter an IP address or network segment and press Enter to add it. |
Database port | Configure the port number. The default value is 0. |
Database account. | You can configure multiple accounts. Enter an account and press Enter to add it, for example, sys,root,system. |
Database Name | You can configure multiple database names. Enter a database name and press Enter to add it, for example, mysql,test. |
Table Name | Enter a table name. To add multiple table names, enter a name and press Enter. |
SQL Type | Enter an SQL type. To add multiple SQL types, enter a type and press Enter. |
SQL Statement | Enter an SQL statement. To add multiple SQL statements, enter a statement and press Enter. |
Execution Time | Configure the execution time threshold. The unit is milliseconds, and the default value is 0. |
Number of Affected Rows | Configure the affected row quantity threshold. The unit is rows, and the default value is 0. |
Return Code | Configure the return code threshold. The default value is 0. |
7. After confirming the information is correct, click Confirm.
Note:
Multiple rules are in an AND relationship and must be met simultaneously to trigger an alarm. An alarm is generated only when all configured rule conditions, such as client IP address, client port, and database IP address, are matched.
Rule configuration supports flexible combinations. We recommend that you configure rule conditions properly based on your actual business scenarios to avoid an excessive number of alarms caused by overly broad rules or missed alarms caused by overly strict rules.
Enabling/Disabling Alarm Policies
1. Log in to the CSC console. In the left navigation pane, click Data Security Situation Management > Database Risk Monitor.
2. On the Database Risk Monitoring page, click Policy Management in the upper-right corner.
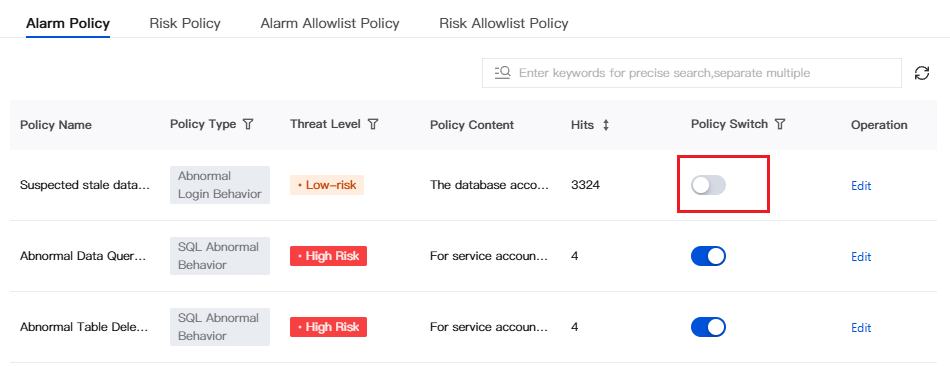
3. On the Alarm Policy Tag page, select the target alarm policy. In the Policy Switch column, click the switch to enable or disable the alarm policy.
Editing Alarm Policies
1. Log in to the CSC console. In the left navigation pane, click Data Security Situation Management > Database Risk Monitor.
2. On the Database Risk Monitoring page, click Policy Management in the upper-right corner.
3. In the Policy Management window, click the Alarm Policy Tag.
4. On the Alarm Policy Tag page, select the target alarm policy. In the Operations column, click Edit.
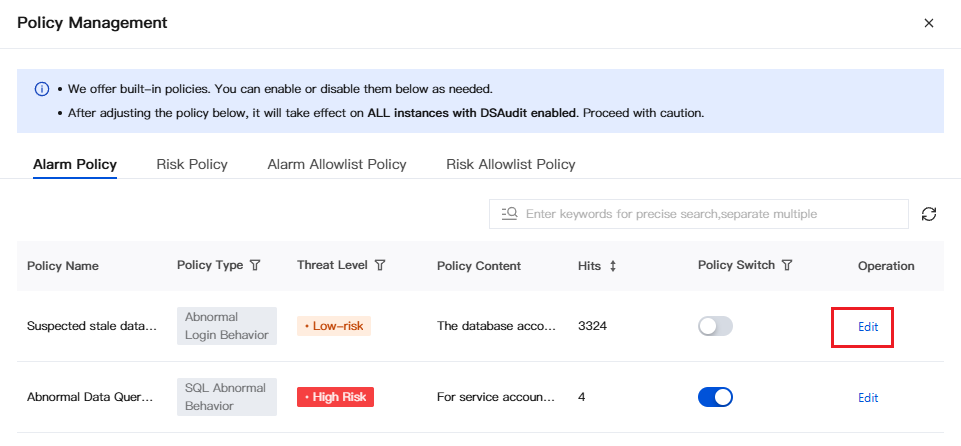
5. In the Edit Policy window, you can modify the threat level and policy content (excluding service accounts).
Managing Alarm Allowlist Policies
Viewing Alarm Allowlist Policies
1. Log in to the CSC console. In the left navigation pane, click Data Security Situation Management > Database Risk Monitor.
2. On the Database Risk Monitoring page, click Policy Management in the upper-right corner.
3. In the Policy Management window, click the Alarm Allowlist Policy Tag.
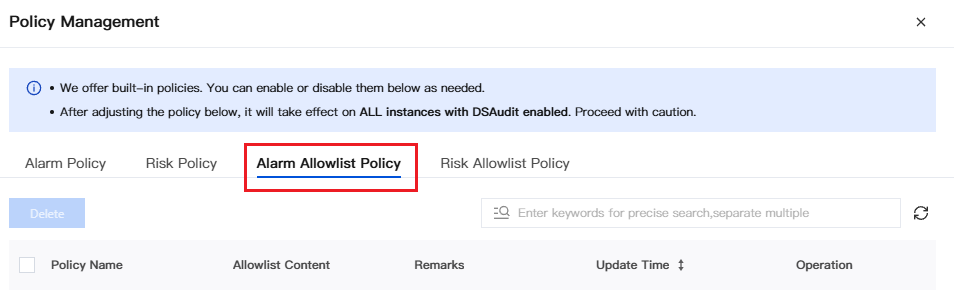
4. On the Alarm Allowlist Policy Tag page, all added alarm allowlist policies are displayed.
Adding an Alarm Allowlist Policy
1. On the Alarm Allowlist Policy Tag page, click Add Policy.
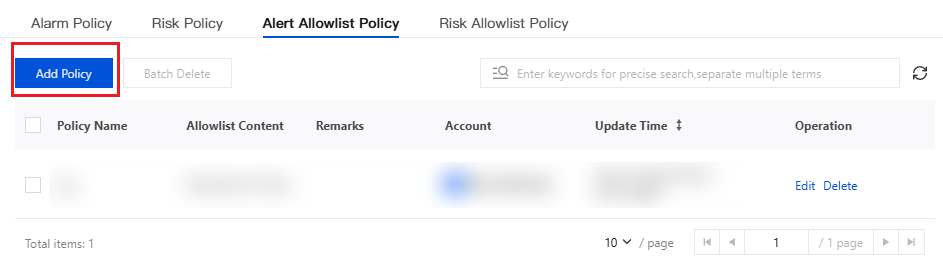
2. In the Add to Allowlist window, configure the allowlist rule content.
3. After confirming the information is correct, click Confirm.
Editing an Alarm Allowlist Policy
1. On the Alarm Allowlist Policy Tag page, find the target allowlist policy. In the Operation column, click Edit.
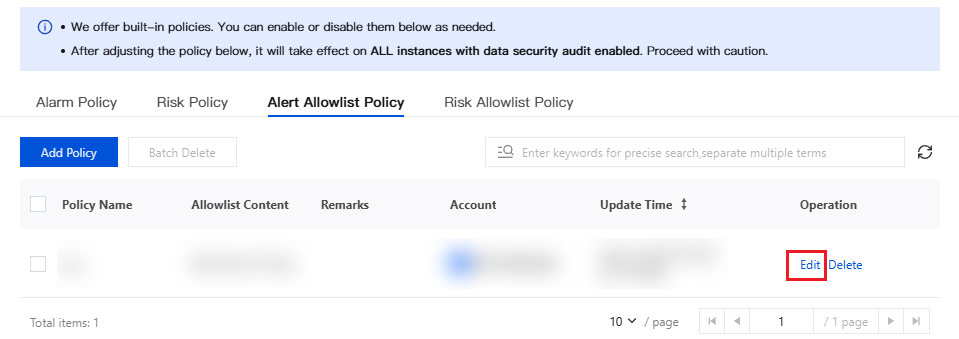
2. In the Edit Allowlist window, modify the allowlist policy content.
3. After confirming the information is correct, click Confirm.
フィードバック