NDR mirrors network traffic to and from servers, performs real-time detection, analysis, and alarm using the Intrusion Defense engine, and records complete traffic logs (including packet headers and payloads). It supports flexible traffic access at the asset level. The access entry points are categorized into the following tabs:
CVM: CVM assets.
Container Cluster: Container cluster nodes.
Internet Border Traffic: Assets such as GAAP, CVM, NAT Gateway, and CLB that are connected through the Internet Firewall.
Before traffic access, the system automatically validates prerequisites such as region, instance, quota, Agent, and Border Firewall connection status. After traffic access is complete, you can further enable encrypted traffic detection for encrypted traffic such as HTTPS.
This document describes the management of traffic access switches, asset status viewing, and access settings such as traffic collection configuration, over-limit handling configuration, and automatic protection for newly added assets. For details on capabilities including threat detection, file sandbox detection, traffic risk analysis, asset fingerprinting, and protocol parsing and storage, see Network Detection and Response Capabilities.
Note:
Go to CFW purchase page to purchase the Network Detection and Response feature.
Log in to the CFW console. In the left sidebar, choose Network Detection and Response > Traffic Access.
For assets with internet-facing traffic (GAAP/CVM/NAT Gateway/CLB), you must first enable the Internet-Facing Serial Firewall for the corresponding EIP in the CFW console. If the above prerequisite is not met, the NDR switch for the corresponding row will display as Cannot be enabled. You can hover the mouse to view the specific reason and click Go and Enable to quickly jump to the CFW console to complete the configuration.
Pre-checks
Before traffic access, the system automatically fetches and validates prerequisites such as account, region, instance, network, quota, bandwidth, Agent, container permissions, and Border Firewall connection status. Based on the validation results, it categorizes assets into the following three states:
Can be enabled: All checks have passed, and NDR can be enabled normally.
Can be enabled - at risk: There are certain risks (such as insufficient bandwidth margin), but it can still be enabled. The system will display risk prompt information.
Cannot be enabled: There are blocking issues (such as unsupported region, incompatible operating system, insufficient quota, or not connected to the corresponding Border Firewall). You must resolve all issues according to the guidance before you can enable it.
The system performs checks from the following dimensions. If the pre-check fails, the NDR switch status of the asset will be displayed as Cannot be enabled or Can be enable - at risk. For details on specific exceptions and solutions, see Asset Status Description.
Check Dimension
Check Method
Check Content
Region and Product Availability
Pre-check
Whether the region supports the traffic analysis service.
Resource Existence and Basic Information
Pre-check / Triggered check
Valid subnet ID of the instance, and no conflicting image binding on the instance.
Instance and OS Compatibility
Pre-check
Whether the instance type supports mirroring mode, and whether the operating system is on the supported list.
Network and Bandwidth Health
Triggered check
Real-time bandwidth of the instance and the threshold; purchased bandwidth limit of the account.
Quotas and Resource Limits
Pre-check
Upper limit on the number of enabled instances.
Container Scenarios and Permissions
Pre-check
Access permissions for the container cluster KubeConfig; DaemonSet status and Pod health.
Account and Allowlist
Pre-check
Whether the VPC traffic mirroring allowlist has been enabled.
Instance TAT / Agent Status
Pre-check
Whether TAT has been installed.
Border Firewall Access Status
Pre-check / Triggered check
Whether the EIP associated with the asset has enabled the internet boundary serial firewall in the internet boundary scenario.
Note:
Pre-check: The system automatically checks every 5 minutes whether the assets meet the enabling conditions.
Triggered Check: The system triggers verification when a user selects an asset and enables the NDR toggle or the encrypted traffic detection toggle. After the verification is complete, the system synchronously updates the pre-check status.
The pre-check also applies to Internet border traffic assets. When the pre-check fails, the NDR switch in the corresponding row is uniformly displayed as Cannot be enabled. Hover the mouse over it to view the blocking items and handling instructions.
CVM Asset
On the Network Detection and Response > Traffic Access > CVM page, select the corresponding operation based on the access granularity:
Individual Switch: In the operation column of the target asset's row, click Enable NDR to enable the NDR feature. Click it again to stop the NDR feature.
All Switches: Click Enable all or Disable all at the top of the page to enable or disable the NDR switch for all CVM assets.
Note:
When all are enabled, the system performs a pre-check on each asset. Assets whose pre-check status is "Cannot Enable" are skipped, and the system prompts the reason for skipping.
Batch Switch: If you only need to operate on some assets:
1.1 Select the target CVM assets.
1.2 Click Batch enable or Batch disable at the top of the page.
On the Network Detection and Response > Traffic Access> Container Cluster page, select the corresponding operation based on the access granularity:
Individual Switch: In the operation column of the target cluster or node's row, click Enable NDR or Enable all to enable the NDR feature. Click again or click Disable All to stop the NDR feature.
All Switches: Click Enable all or Disable all at the top of the page to enable or disable the NDR switch for all container cluster assets.
Note:
When all are enabled, the system performs a pre-check on each asset. Assets whose pre-check status is "Cannot Enable" are skipped, and the system prompts the reason for skipping.
Batch Switch: If you only need to operate on some assets:
1.1 Select the target cluster or node.
1.2 Click Batch enable or Batch disable at the top of the page.
On the Network Detection and Response > Traffic Access> Internet Boundary Traffic page, select the corresponding operation based on the access granularity:
Note:
If the same CVM asset is connected to both CVM and Internet Border Traffic, they are billed and collected independently. Select the appropriate connection method based on your actual business needs.
Individual Switch: In the operation column of the target asset's row, click Enable NDR to enable the NDR feature. Click it again to stop the NDR feature.
All Switches: Click Enable all or Disable all at the top of the page to enable or disable the NDR switch for all internet boundary traffic assets.
Note:
When all are enabled, the system performs a pre-check on each asset. Assets whose pre-check status is "Cannot Enable" are skipped, and the system prompts the reason for skipping.
Batch Switch: If you only need to operate on some assets:
1.1 Select the target internet border traffic assets.
1.2 Click Batch enable or Batch disable at the top of the page.
Asset Status Description
On the Network Detection and Response > Traffic Access page, the system displays the real-time operational status of assets in the NDR Switch Status column. This status comprehensively reflects the pre-check results and runtime conditions:
Status Column
Possible Values
Description
NDR switch status
Enabled, Closing, Can be enabled - at risk, Cannot be enable, Startup failed, Enabling, Closing
Displays the enabled status and abnormal conditions of NDR traffic collection.
Note:
For assets that fail the pre-check, the NDR switch is uniformly displayed as Cannot be enable. Hover the mouse over it to view the specific blocking items and the corresponding Go and Enable jump entry in the bubble.
When the status is abnormal (for example, startup fails, cannot be enabled, or the terminal Agent is abnormal), the page displays a red warning icon and exception information, indicating that the current detection is unavailable. Hover over the status to view the specific cause and operation instructions. The exception information and instructions include:
Failure Reason Categories
Solution
The current region does not support the traffic analysis service.
The Traffic Analysis service is not deployed in the current region. Please submit a ticket to confirm regional support and assess deployment feasibility.
The subnet ID of the asset instance does not exist.
An invalid or deleted subnet ID of the asset instance has been detected. Please go to VPC Firewall to verify the subnet information, and then click Sync Assets to retry.
The IP address format of the asset instance is invalid.
The IP address format of the asset instance does not comply with the specification. Please go to VPC Firewall to verify the subnet information, and then click Sync Assets to retry.
The current operating system type is not supported.
The current operating system is not supported. Please go to technical solution to confirm compatibility.
Endpoint TAT not detected.
The instance does not have Endpoint TAT installed. Please see TAT Deployment Guide and retry after completing the installation.
Network bandwidth has reached the upper limit.
Real-time bandwidth has reached the purchased limit. Recommendation:
1. Disable non-essential traffic access.
2. Go to Renewal Center to upgrade the full traffic detection specification or wait for traffic to decrease and try again.
The number of asset instances that can be connected has reached the upper limit.
Please submit a ticket to request adjusting the asset instance connection limit.
Single machine bandwidth overloaded operation
The real-time bandwidth utilization of the current server is >40% (meaning the combined real-time bandwidth usage and mirrored traffic exceed 80% of the total bandwidth). The system has automatically limited the traffic access feature. Recommendation:
1. Wait for 10 minutes and retry.
2. Go to the Instance page to upgrade the instance specification.
The current instance type does not support traffic mirroring mode.
The current instance model does not support traffic mirroring mode. Please submit a ticket to request adding model adaptation.
The traffic mirroring feature is not enabled.
The current account has not been added to the allowlist for VPC traffic mirroring. Please submit a ticket to apply for enabling the service. Provide the VPC ID and region information.
An existing traffic mirroring instance has been detected. Please go to the Mirror Traffic page to delete the collection ENI and then retry.
The number of traffic mirrors exceeds the quota limitation.
A single VPC supports up to 5 traffic mirroring instances by default. If scaling out is required, please submit a ticket (provide the VPC ID and the required quantity).
Internet Border Serial Firewall not enabled (for Internet border traffic assets).
The current EIP does not have Internet Firewall serial mode enabled, so internet border traffic cannot be collected. Hover the mouse over the NDR switch, click Enable in the pop-up bubble, and then navigate to Internet Firewall to complete serial mode access and retry.
The server is temporarily unavailable. Please try again later.
Temporary unavailability of the server has been detected. Please wait 5 minutes and try again. If the issue persists, please submit a ticket to contact technical support.
Terminal Agent loading exception
A loading exception occurred during the Agent deployment process. Please try again later. If the exception persists, please submit a ticket to contact technical support.
Terminal Agent abnormal
1. The Agent network may be abnormal. Please check whether security groups allow access.
2. Operation of the Agent process may be abnormal. Please verify the operating system status.
3. If no abnormalities are detected, submit a ticket to contact technical support.
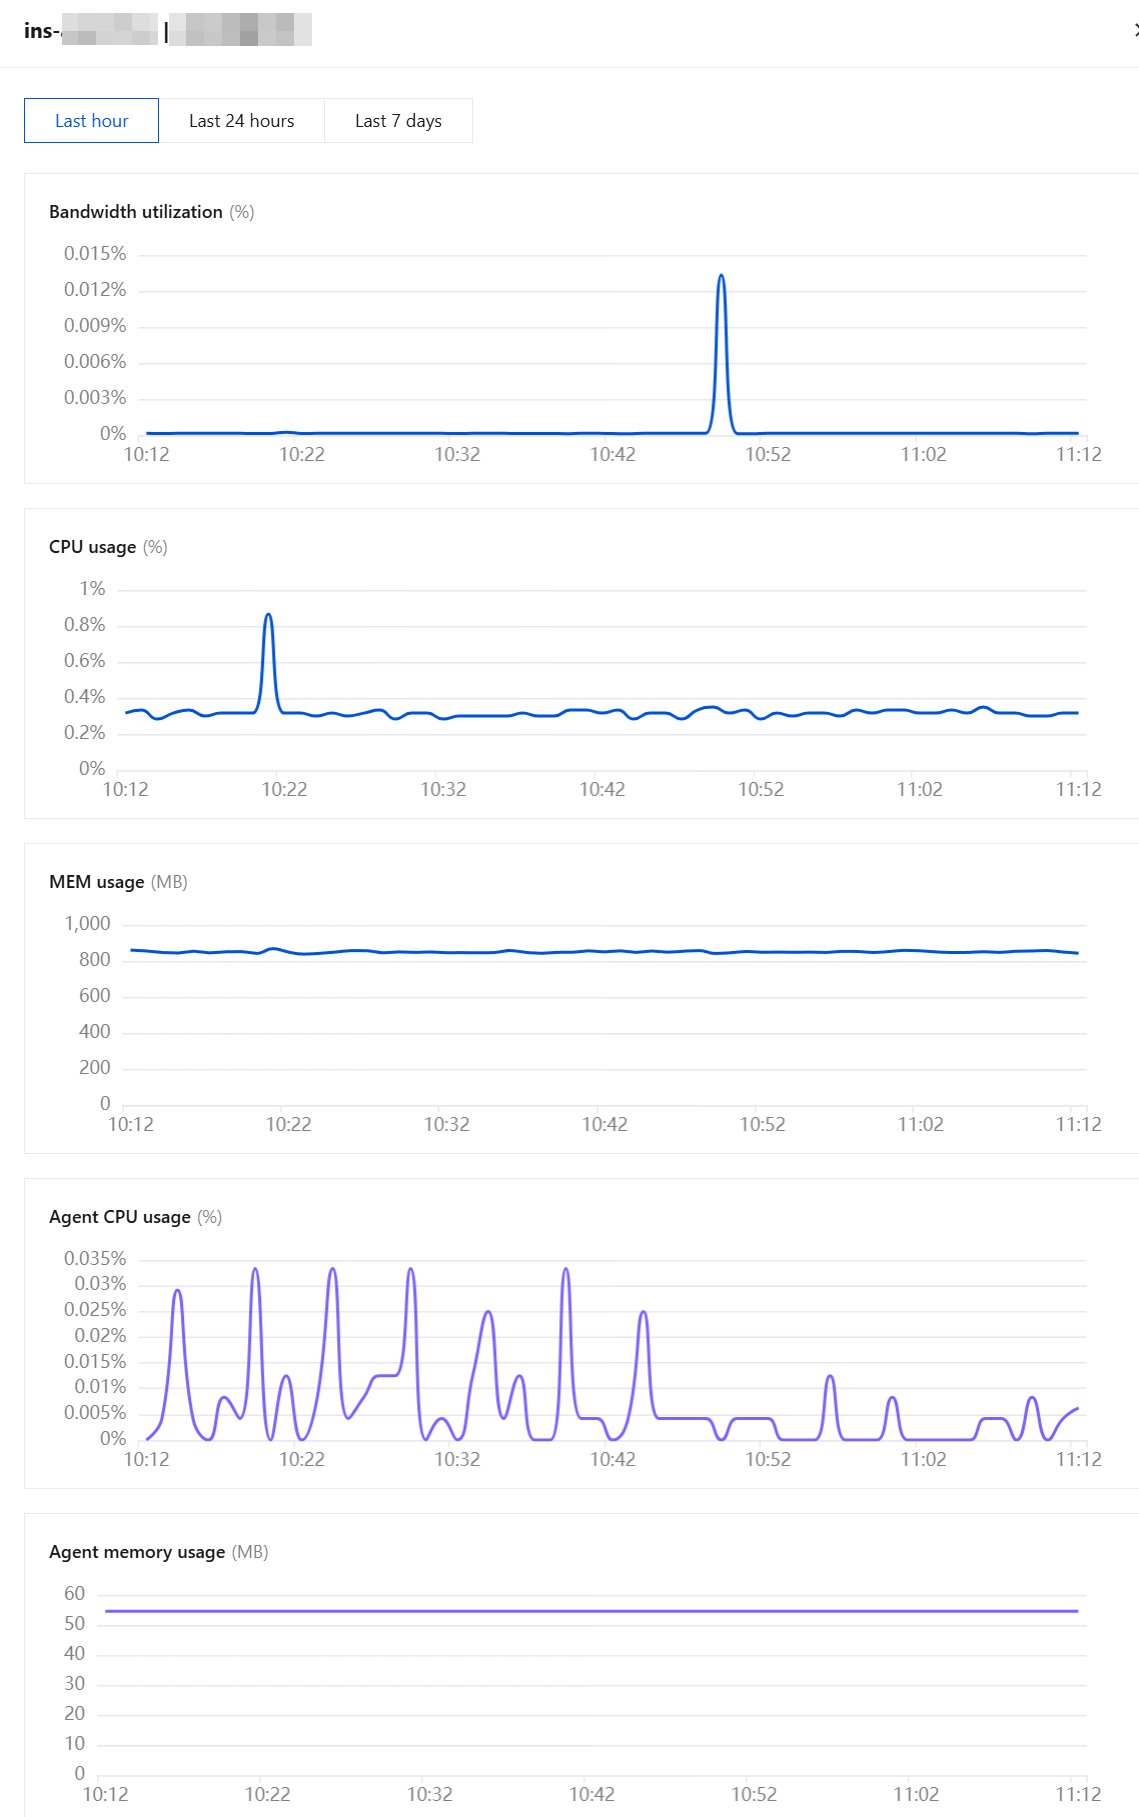
icon for the asset. The system displays the machine resource usage of that asset in the side panel, which includes the following metrics:
Monitoring Metric
Description
Alarm Threshold
Bandwidth utilization
Displays the real-time bandwidth usage of the asset.
Displays a limit red line when the value exceeds 40%.
CPU usage
Displays the CPU utilization of the asset.
-
MEM usage
Displays the memory usage of the asset.
-
Agent CPU usage
Displays the CPU utilization of the NDR Agent (visible when encrypted traffic detection is enabled).
Displays a limit red line when the value exceeds 50%.
Agent memory usage
Displays the memory usage of the NDR Agent (visible when encrypted traffic detection is enabled).
Displays a limit red line when the memory usage exceeds 600 MB.
Note:
When a monitoring metric exceeds its limit threshold, the system displays a corresponding risk alert in the monitoring chart. This helps promptly identify and address potential resource bottleneck issues.
Status Monitoring
The Status Monitoring module provides a dedicated statistics panel for traffic access, helping you gain real-time visibility into the operational status and overall scale of current traffic access.
Dedicated Statistics:
Peak bandwidth in: displays the total inbound peak bandwidth and its ratio to the specification, and supports switching between 24 hours, 7 days, and 30 days time ranges.
Peak bandwidth out: displays the total outbound peak bandwidth and its ratio to the specification, and supports switching between 24 hours, 7 days, and 30 days time ranges.
Network Detection and Response bandwidth / purchased bandwidth: displays the ratio of bandwidth occupied by traffic access to purchased bandwidth, and supports switching between 24 hours, 7 days, and 30 days time ranges.
Statistical Charts:
Real-time traffic trend: displays the real-time dynamic traffic trend of traffic access, and supports switching between 24 hours, 7 days, and 30 days time ranges.
Peak bandwidth in: displays the TOP 5 assets by inbound peak bandwidth.
Peak bandwidth out: displays the TOP 5 assets by outbound peak bandwidth.
Traffic in: displays the TOP 5 assets by inbound cumulative traffic.
Traffic out: displays the TOP 5 assets by outbound cumulative traffic.
Traffic Collection Configuration
This section configures the basic parameters for NDR traffic collection. For detailed field descriptions and operation steps, see Configuring Traffic Collection Scope.
Overage Handling Configuration
This section manages policies for traffic throttling, recovery, and notification during bandwidth overage and single-machine overload scenarios. It includes three parts: bandwidth configuration, overage handling policy, and excess notification.
1. On the Network Detection and Response > Traffic Access page, click Overage Handling Configuration in the upper-right corner.
2. You can manage three types of configurations here: bandwidth settings, overage handling policy, and overage notification.
Bandwidth Setting
Total traffic is the sum of peak inbound and outbound traffic of all instances. Please ensure the traffic analysis bandwidth or elastic analysis bandwidth is larger than the total traffic.
Elastic protection: This feature allows you to configure an elastic analysis bandwidth. Traffic is analyzed when it is less than the elastic analysis bandwidth. When traffic exceeds the elastic analysis bandwidth, overage handling is triggered. For details on billing and overage handling, see Bandwidth. Adjust the elastic analysis bandwidth value as needed. Click Edit to modify the value. After completing the modification, click Confirm to Adjust to save the settings.
Overage Handling: Traffic analysis bandwidth overage does not cause packet loss or affect the traffic rate of customer business traffic. However, the NDR feature will be unavailable.
Bandwidth specification exceeded traffic throttling and recovery mechanism
Traffic throttling mechanism: when real-time bandwidth exceeds purchase specs, the system automatically closes high-weight resolutions first (if weights are identical, close in descending order of peak bandwidth) until real-time bandwidth drops to within purchase specs.
Recovery mechanism: when real-time bandwidth is less than or equal to purchase specs, the system automatically enables high-weight resolutions first (if weights are identical, enable in descending order of peak bandwidth) and automatically ingests traffic.
Single machine bandwidth overload self-protection and recovery mechanism
Self-protection mechanism: The system checks server bandwidth utilization every 30 seconds. When server bandwidth utilization > 40% (corresponding to total bandwidth utilization > 80% due to mirrored traffic), the system disables traffic ingress for that server.
Recovery mechanism: The system checks server bandwidth utilization every 30 seconds. When server bandwidth utilization remains ≤ 40% for the last 2 minutes of the cooldown period, the system automatically restores traffic ingress.
Supports batch editing of weights.
Excess Notification Setting: When bandwidth specification exceeded or bandwidth overload for a single CVM occurs, a system banner alert is displayed. Alarm notifications, overage notifications, and recovery notifications are all sent according to the notification configuration here.
Receive notifications: When it is enabled, relevant alarm notifications will be received; when it is disabled, they will no longer be received.
Sent to: Select the sub-accounts to be notified from the sub-account list, and simultaneously select the master account for notification.
Alarm time window: Set the valid time period for alarm delivery. Alarms outside this period are ignored by default. Please configure this carefully. The minimum interval for a single time window is 1 hour, and you can configure up to 5 different time windows simultaneously.
Automatic Protection for New Assets
This setting configures whether to automatically ingest traffic and enable encrypted traffic parsing when new assets are discovered, eliminating the need for manual operations each time an asset is added.
Note:
Automatic protection for newly added assets is only effective for CVM and Container Clusters. It is not currently applicable to Internet Border Traffic or VPC Border Traffic. Relevant assets must be manually connected on their respective pages.
1. On the Network Detection and Response > Traffic Access page, click New asset automatic protection in the upper-right corner.
2. This feature allows you to configure whether new assets are Auto on all traffic detect and respond (that is, the NDR switch is automatically enabled) and whether Automatically enable encrypted traffic analysis (that is, encrypted traffic detection is automatically enabled).
When the asset type is set to All New Assets
When Automatic Traffic Access is enabled, traffic is automatically ingested upon the discovery of new public network and non-public network CVMs and containers.
When Automatic Traffic Access is disabled, traffic is not automatically ingested after new assets (public network and non-public network CVMs and containers) are discovered.
When Automatically Enable Encrypted Traffic Analysis is enabled, encrypted traffic analysis is automatically enabled upon the discovery of new public network and non-public network CVMs and containers.
When Automatically Enable Encrypted Traffic Analysis is disabled, encrypted traffic analysis is not automatically enabled after new assets (public network and non-public network CVMs and containers) are discovered.
When the asset type is set to Only New Public Network Assets
When Automatic Traffic Access is enabled, traffic is automatically ingested upon the discovery of new public network CVM assets. Non-public network assets are not automatically ingested.
When Automatic Traffic Access is disabled, traffic is not automatically ingested after new assets (public network and non-public network CVMs and containers) are discovered.
When Automatically Enable Encrypted Traffic Analysis is enabled, encrypted traffic analysis is automatically enabled upon the discovery of new public network CVM assets. Encrypted traffic analysis is not automatically enabled for non-public network assets.
When Automatically Enable Encrypted Traffic Analysis is disabled, encrypted traffic analysis is not automatically enabled after new assets (public network and non-public network CVMs and containers) are discovered.
NDR Alarms
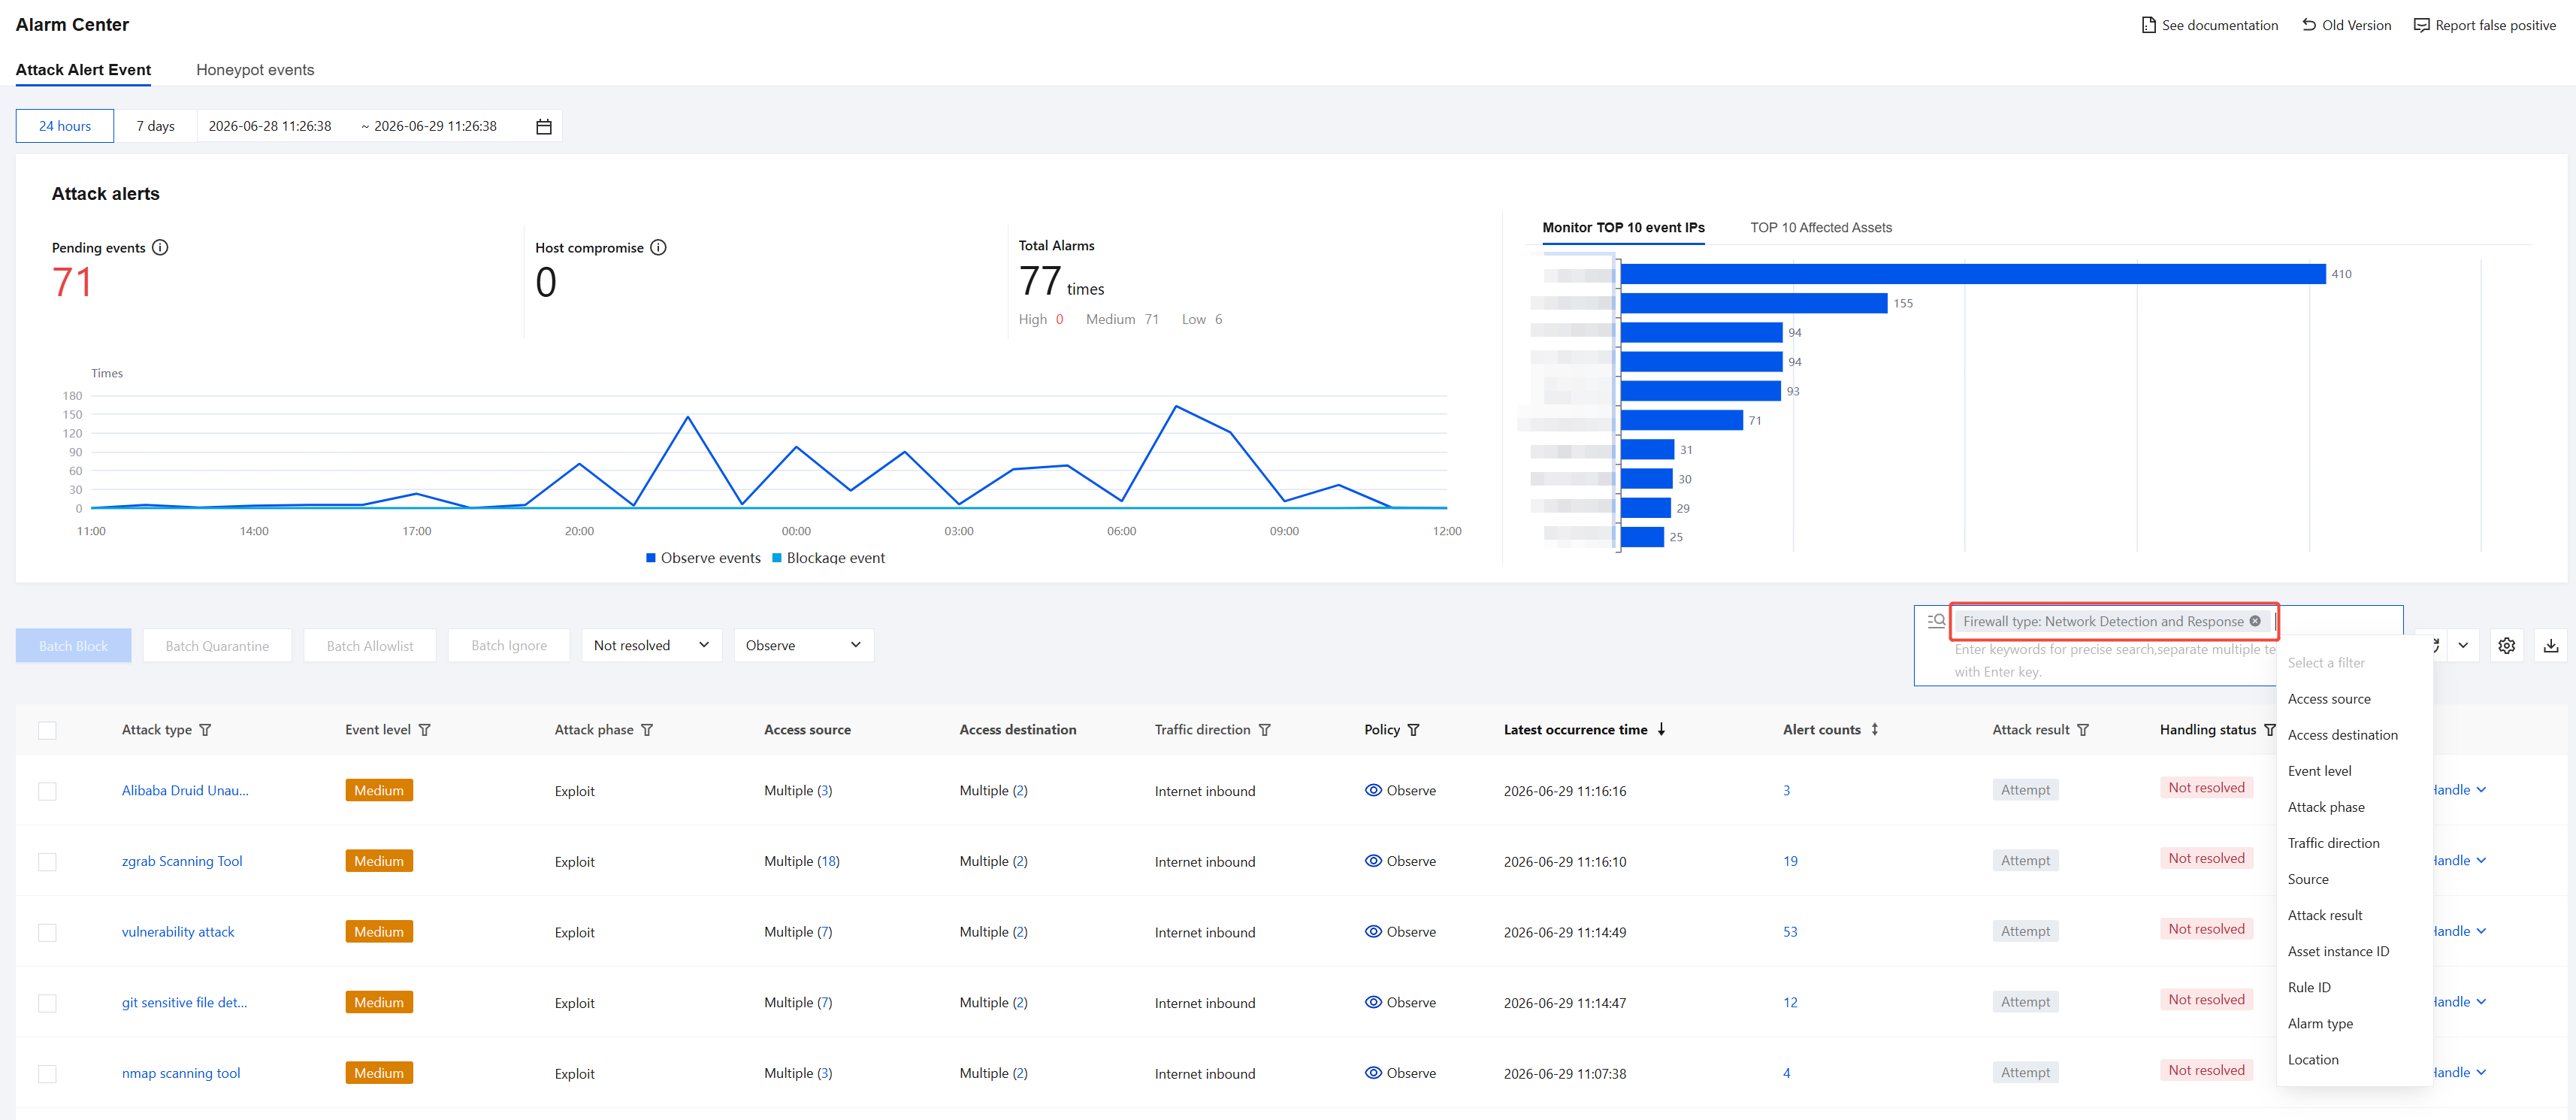
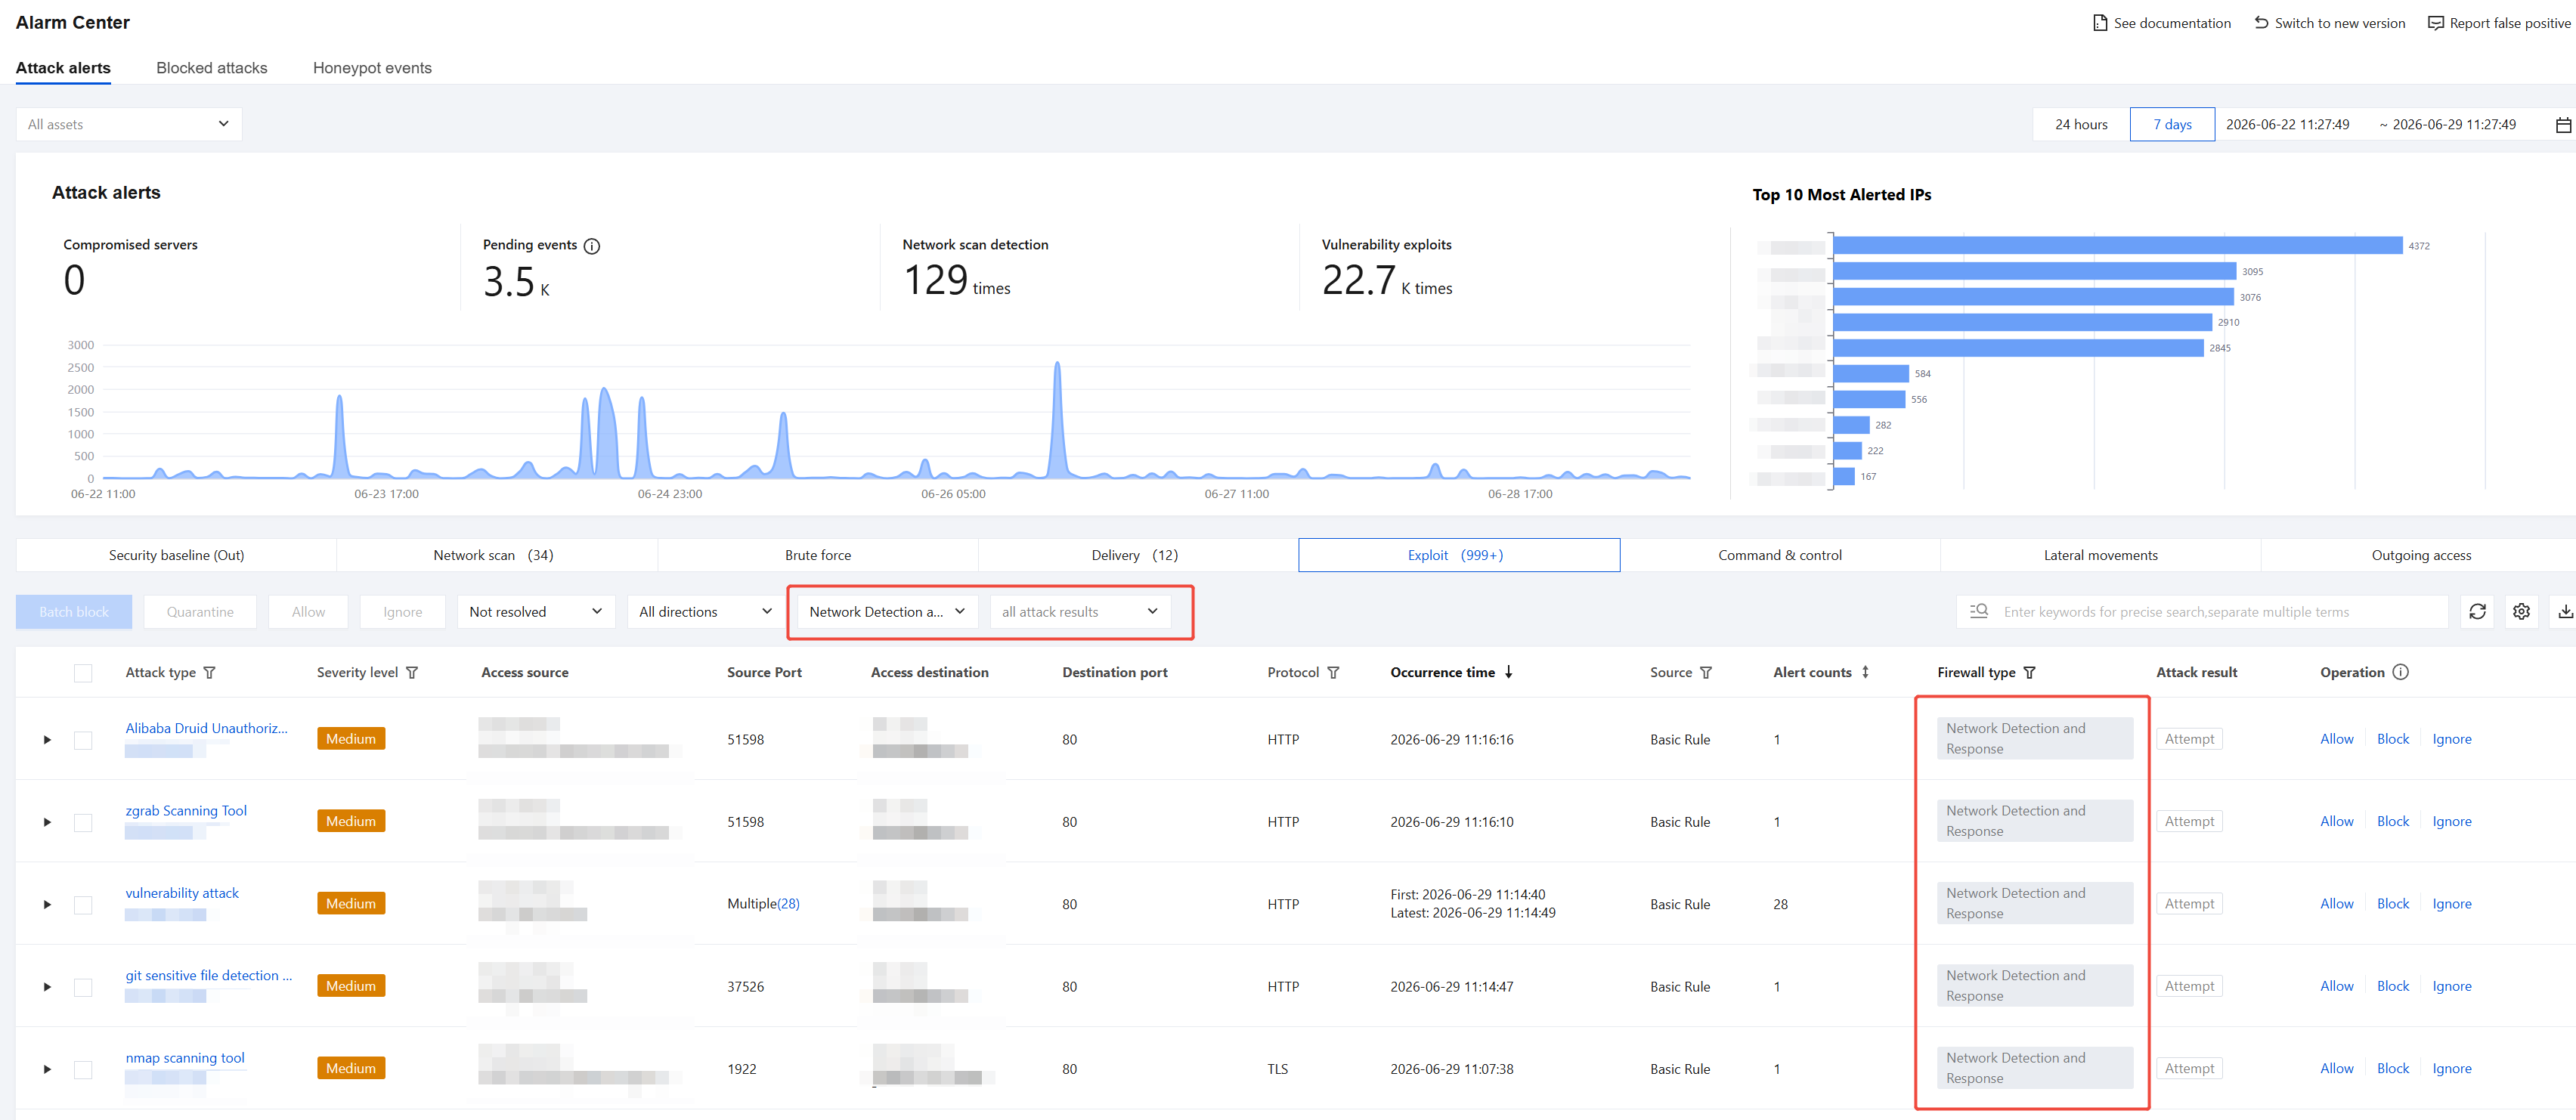
On the Alarm Center page, you can view multiple types of threat alarms, such as lateral movement and active outbound connections, discovered by traffic access, and determine whether attacks are successful.
New Version of Alarm Center
Old Version of Alarm Center
Network Detection and Response Log
On the Network Detection and Response page, select the target asset instance. In its operation column, click View Alarm Logs or View Traffic Logs to navigate to the detailed alarm log or traffic log page for that instance. For specific operation instructions on the log page, see View Network Detection and Response Logs.
On the Network Detection and Response Logs page, you can view core log information related to NDR, including: traffic analysis logs, traffic alarm logs, traffic risk logs, and file detection logs. This page provides a basic log overview feature. For specific operation instructions, see View Network Detection and Response Logs.
On the Log Analysis page, you can obtain complete information of all previously stored NDR logs, quickly locate target logs using custom search queries, and perform in-depth analysis and value insight on log data through reporting and statistical analysis services. This page provides advanced analysis and visualization features. For specific operation instructions, see Log Analysis.